

Key Insights
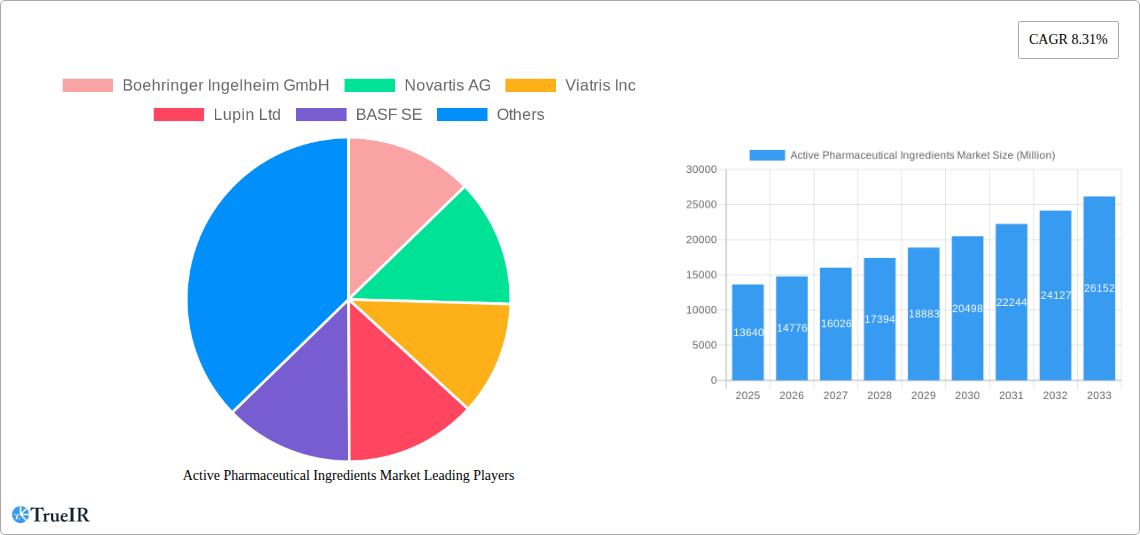
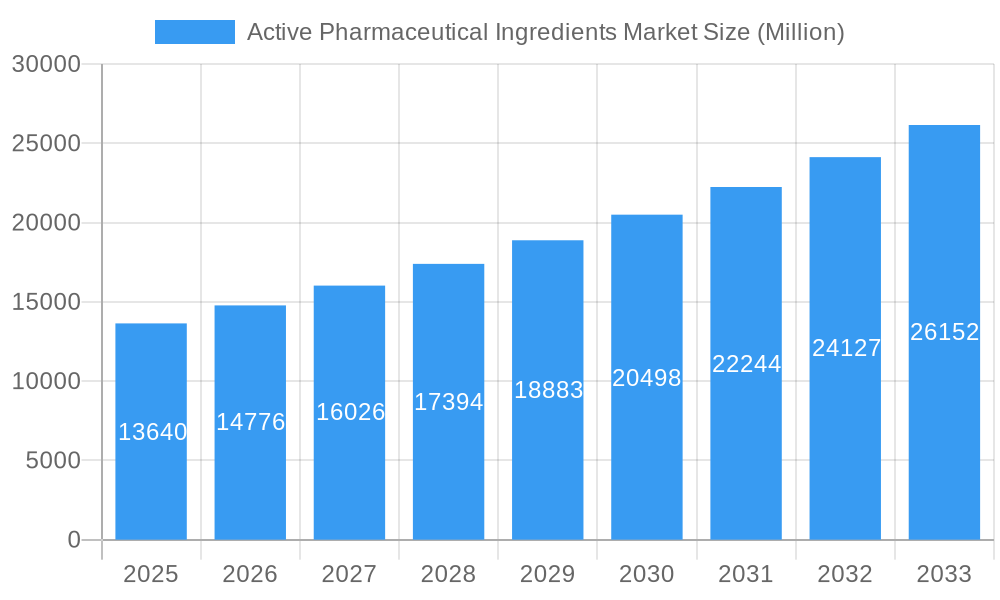
The Active Pharmaceutical Ingredients (API) market, valued at $13.64 billion in 2025, is projected to experience robust growth, driven by several key factors. The rising prevalence of chronic diseases globally, coupled with an aging population, fuels increased demand for pharmaceuticals, directly impacting API consumption. Technological advancements in drug discovery and development, particularly in areas like biotechnology and personalized medicine, are creating opportunities for innovative APIs and novel therapeutic approaches. Furthermore, the increasing outsourcing of API manufacturing to contract research organizations (CROs) and contract manufacturing organizations (CMOs) in emerging economies like India and China contributes to market expansion. However, stringent regulatory requirements, fluctuating raw material prices, and intense competition among established players pose significant challenges. The market is segmented by synthesis type (synthetic and biotech), drug type (generic and branded), and application (cardiology, oncology, pulmonology, neurology, orthopedic, ophthalmology, and others). Major players, including Boehringer Ingelheim, Novartis, Viatris, Lupin, BASF, Sun Pharmaceutical Industries, Aurobindo Pharma, Sanofi, Dr. Reddy's Laboratories, GlaxoSmithKline, and Pfizer, are actively shaping the market landscape through strategic partnerships, mergers and acquisitions, and continuous innovation.
Active Pharmaceutical Ingredients Market Market Size (In Billion)
The market's segmented nature reflects the diverse therapeutic areas leveraging APIs. The oncology segment, for instance, is expected to witness considerable growth due to the increasing incidence of cancer globally and the development of targeted therapies. Similarly, the burgeoning demand for generic drugs, particularly in developing countries, is driving significant growth in the generic API segment. The captive API business model, wherein pharmaceutical companies produce their own APIs, is prevalent, although the merchant API model (external supply) is steadily gaining traction due to its cost-effectiveness and flexibility. Regional variations in market growth exist, with North America and Europe currently holding substantial market shares, though the Asia Pacific region is projected to exhibit the highest growth rate over the forecast period due to increasing healthcare expenditure and rising pharmaceutical manufacturing capabilities. The continued expansion and diversification of this market highlight its importance within the broader pharmaceutical industry.
Active Pharmaceutical Ingredients Market Company Market Share
Active Pharmaceutical Ingredients (API) Market Report: 2019-2033
This comprehensive report provides an in-depth analysis of the global Active Pharmaceutical Ingredients (API) market, offering a detailed examination of market size, growth drivers, key players, and future trends from 2019 to 2033. The report covers a wide range of segments, including synthesis type, drug type, application, and business model, providing granular insights into the market's dynamics and competitive landscape. This report is essential for industry stakeholders, investors, and researchers seeking a thorough understanding of this crucial sector within the pharmaceutical industry. The market is estimated to be worth xx Million in 2025 and projected to reach xx Million by 2033, exhibiting a CAGR of xx% during the forecast period (2025-2033).
Active Pharmaceutical Ingredients Market Market Structure & Competitive Landscape
The global Active Pharmaceutical Ingredients (API) market is characterized by a dynamic and moderately concentrated structure. While a few large multinational corporations currently hold substantial market share, the competitive landscape is continually evolving. Concentration ratios, often measured by CR4 and CR8 metrics, are anticipated to remain relatively fluid throughout the forecast period. This dynamic is largely influenced by strategic mergers and acquisitions (M&A) activity, the successful integration of acquired entities, and the continuous entry of new, agile players, particularly within the burgeoning generic API segment. The market is marked by intense competition, where companies strategically differentiate themselves through relentless innovation, rigorous cost optimization initiatives, strategic alliances, and a strong emphasis on robust supply chain management.
- Market Concentration: The top 10 players are projected to collectively account for approximately 55-65% of the global market share by 2025, indicating a degree of consolidation yet leaving room for specialized and emerging players.
- Innovation Drivers: Continuous and substantial investments in Research & Development (R&D) are the primary catalysts for innovation, driving advancements in novel drug delivery systems, the development and manufacturing of biosimilars, and the creation of increasingly complex and high-potency APIs.
- Regulatory Impacts: Stringent and evolving regulatory frameworks, particularly concerning API quality assurance, patient safety protocols, and advanced manufacturing processes, significantly shape market dynamics. Adherence to these demanding compliance costs directly influences pricing strategies, operational expenses, and overall profitability for market participants.
- Product Substitutes: The widespread availability of cost-effective generic APIs exerts considerable downward pricing pressure on established branded APIs. Furthermore, the accelerating emergence of biosimilars and innovative alternative drug delivery systems presents both challenges and opportunities for API manufacturers.
- End-User Segmentation: The API market serves a highly diverse clientele, encompassing major pharmaceutical companies, specialized contract development and manufacturing organizations (CDMOs), and a vast array of generic drug manufacturers. Each of these segments exhibits distinct growth trajectories and unique market dynamics, necessitating tailored strategies.
- M&A Trends: Consolidation remains a prominent and ongoing trend within the API sector. Larger, established players frequently acquire smaller, innovative companies to strategically expand their product portfolios, enhance their geographical reach, and acquire cutting-edge technological capabilities. The volume of M&A deals in the API sector has averaged between 15-25 per year during the historical period (2019-2024), highlighting active consolidation.
Active Pharmaceutical Ingredients Market Market Trends & Opportunities
The global API market is experiencing robust growth, driven by several key factors. The increasing prevalence of chronic diseases globally fuels demand for pharmaceuticals, consequently boosting API demand. Technological advancements in API synthesis and manufacturing processes are enhancing efficiency and cost-effectiveness. Growing consumer preferences for branded and generic drugs, particularly in emerging markets, contribute to market expansion. The rise of biosimilars presents a significant opportunity for API manufacturers, while increased regulatory scrutiny and price pressure from generic competition present ongoing challenges. Furthermore, the market is witnessing a shift towards outsourcing API manufacturing to CDMOs, leading to changes in the competitive landscape.
The market size grew from xx Million in 2019 to xx Million in 2024, exhibiting a CAGR of xx%. The projected market size is expected to grow from xx Million in 2025 to xx Million by 2033, demonstrating a CAGR of xx% during this period. The market penetration rate of generic APIs is expected to increase from xx% in 2025 to xx% by 2033, driven by increased cost-consciousness among consumers and healthcare systems globally.
Dominant Markets & Segments in Active Pharmaceutical Ingredients Market
The Asia-Pacific region is firmly established as the dominant force in the global API market and is projected to maintain this leading position throughout the forecast period. This dominance is primarily fueled by the immense and continuously expanding pharmaceutical industries in key economies like India and China, coupled with significant cost advantages in manufacturing, and supportive government initiatives aimed at fostering domestic API production. Within the segmented market analysis, APIs manufactured via Synthetic Synthesis Type currently lead the market, representing a substantial portion of the overall market value. The Generic Drug Type segment also commands a significant and growing market share, reflecting global healthcare trends.
-
Key Growth Drivers in Asia-Pacific:
- The rapid and sustained expansion of the pharmaceutical industry across the region.
- The presence of favorable government regulations, including substantial incentives and policies designed to promote and support API manufacturing.
- Access to highly cost-effective and efficient manufacturing capabilities.
- The continuously rising global and regional prevalence of chronic diseases, driving increased demand for pharmaceuticals.
-
Dominant Segments:
- Synthesis Type: APIs produced through Synthetic routes currently hold the largest market share. However, the Biotechnology segment is exhibiting exceptionally robust growth, driven by the escalating demand for complex biologics and biosimilars.
- Drug Type: The Generic API segment commands a substantial market share, largely due to its inherent cost-effectiveness and the surging demand observed in emerging and developed markets alike. The Branded API segment, while smaller in volume, maintains significant value due to the premium pricing associated with innovator drugs and their associated intellectual property.
- Application: APIs for Oncology and Cardiology applications are leading the market in terms of both value and volume, directly correlated with the high global prevalence of these debilitating diseases. Other significant application areas, such as Pulmonology and Neurology, also display strong and promising growth potential.
- Business Mode: Both captive API production (where companies manufacture APIs for their own use) and merchant API sales (where APIs are sold to third parties) hold significant positions in the market. Their relative market shares are fluid and largely dependent on the specific API, the manufacturing company's strategy, and the prevailing overall market dynamics.
Active Pharmaceutical Ingredients Market Product Analysis
The API market is characterized by a relentless pace of innovation, encompassing advancements in synthesis technologies, sophisticated formulation techniques, and the specialized development of complex APIs, particularly within the rapidly growing biologics sector. Leading companies are increasingly prioritizing the development of APIs that offer enhanced therapeutic efficacy, demonstrably improved safety profiles, and ultimately, better patient outcomes. These continuous product developments are instrumental in driving overall market growth and significantly expanding treatment options for a wide spectrum of diseases. Furthermore, the widespread adoption of advanced analytical techniques plays a crucial role in ensuring precise quality control, batch-to-batch consistency, and optimizing cost-effectiveness throughout the manufacturing process.
Key Drivers, Barriers & Challenges in Active Pharmaceutical Ingredients Market
Key Drivers: Technological advancements in API synthesis and manufacturing, increasing prevalence of chronic diseases, and growing demand for affordable generic medications are significant drivers. Government initiatives such as the PLI scheme in India are further boosting market growth.
Challenges and Restraints: Regulatory hurdles, intellectual property protection issues, and supply chain disruptions pose significant challenges. The impact of price erosion due to competition from generic APIs also limits profitability for some manufacturers. Increased regulatory scrutiny and compliance costs add pressure on companies' profit margins. For instance, a 10% increase in regulatory compliance costs could translate to a xx Million decrease in industry profits.
Growth Drivers in the Active Pharmaceutical Ingredients Market Market
Several key factors are propelling the growth of the Active Pharmaceutical Ingredients (API) market. These include significant technological advancements in API synthesis methodologies, leading to more efficient and cost-effective production. The ever-increasing global demand for generic and biosimilar drugs, driven by healthcare affordability concerns, is a major contributor. Additionally, supportive government policies and initiatives in key geographical markets, aimed at fostering domestic API manufacturing and ensuring supply chain security, are also acting as strong growth catalysts. Furthermore, substantial ongoing investment in R&D for novel APIs and the continuous optimization of existing manufacturing processes are fostering innovation and enhancing overall operational efficiency.
Challenges Impacting Active Pharmaceutical Ingredients Market Growth
Regulatory complexities, supply chain vulnerabilities (as seen during the pandemic), and intense competition, especially from manufacturers in low-cost regions, constrain market growth.
Key Players Shaping the Active Pharmaceutical Ingredients Market Market
Significant Active Pharmaceutical Ingredients Market Industry Milestones
- July 2022: Piramal Pharma Limited strategically launched a new, state-of-the-art API manufacturing plant in Aurora, Ontario, significantly expanding its CDMO capabilities and bolstering its API production capacity within North America.
- March 2022: The Indian government's Production Linked Incentive (PLI) scheme effectively incentivized the domestic manufacturing of 35 critical APIs, playing a pivotal role in reducing reliance on imports, particularly from China, and substantially strengthening India's indigenous API production capabilities.
Future Outlook for Active Pharmaceutical Ingredients Market Market
The API market is poised for continued growth, driven by ongoing technological advancements, expanding pharmaceutical markets in developing economies, and increasing demand for both branded and generic drugs. Strategic partnerships, investments in capacity expansion, and a focus on innovation will be key factors influencing the success of companies in this dynamic market. The market presents significant opportunities for companies that can effectively navigate regulatory landscapes, optimize supply chains, and offer high-quality, cost-effective APIs.
Active Pharmaceutical Ingredients Market Segmentation
-
1. Business Mode
- 1.1. Captive API
- 1.2. Merchant API
-
2. Synthesis Type
- 2.1. Synthetic
- 2.2. Biotech
-
3. Drug Type
- 3.1. Generic
- 3.2. Branded
-
4. Application
- 4.1. Cardiology
- 4.2. Oncology
- 4.3. Pulmonology
- 4.4. Neurology
- 4.5. Orthopedic
- 4.6. Ophthalmology
- 4.7. Other Applications
Active Pharmaceutical Ingredients Market Segmentation By Geography
-
1. North America
- 1.1. United States
- 1.2. Canada
- 1.3. Mexico
-
2. South America
- 2.1. Brazil
- 2.2. Argentina
- 2.3. Rest of South America
-
3. Europe
- 3.1. United Kingdom
- 3.2. Germany
- 3.3. France
- 3.4. Italy
- 3.5. Spain
- 3.6. Russia
- 3.7. Benelux
- 3.8. Nordics
- 3.9. Rest of Europe
-
4. Middle East & Africa
- 4.1. Turkey
- 4.2. Israel
- 4.3. GCC
- 4.4. North Africa
- 4.5. South Africa
- 4.6. Rest of Middle East & Africa
-
5. Asia Pacific
- 5.1. China
- 5.2. India
- 5.3. Japan
- 5.4. South Korea
- 5.5. ASEAN
- 5.6. Oceania
- 5.7. Rest of Asia Pacific
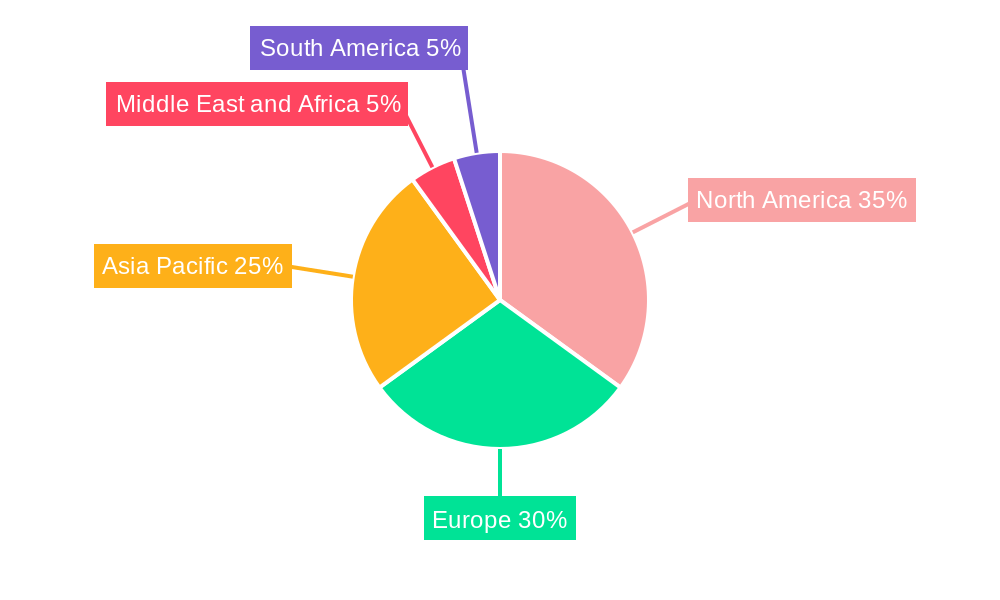
Active Pharmaceutical Ingredients Market Regional Market Share
Geographic Coverage of Active Pharmaceutical Ingredients Market
Active Pharmaceutical Ingredients Market REPORT HIGHLIGHTS
| Aspects | Details |
|---|---|
| Study Period | 2020-2034 |
| Base Year | 2025 |
| Estimated Year | 2026 |
| Forecast Period | 2026-2034 |
| Historical Period | 2020-2025 |
| Growth Rate | CAGR of 8.31% from 2020-2034 |
| Segmentation |
|
Table of Contents
- 1. Introduction
- 1.1. Research Scope
- 1.2. Market Segmentation
- 1.3. Research Objective
- 1.4. Definitions and Assumptions
- 2. Executive Summary
- 2.1. Market Snapshot
- 3. Market Dynamics
- 3.1. Market Drivers
- 3.2. Market Restrains
- 3.3. Market Trends
- 3.4. Market Opportunities
- 4. Market Factor Analysis
- 4.1. Porters Five Forces
- 4.1.1. Bargaining Power of Suppliers
- 4.1.2. Bargaining Power of Buyers
- 4.1.3. Threat of New Entrants
- 4.1.4. Threat of Substitutes
- 4.1.5. Competitive Rivalry
- 4.2. PESTEL analysis
- 4.3. BCG Analysis
- 4.3.1. Stars (High Growth, High Market Share)
- 4.3.2. Cash Cows (Low Growth, High Market Share)
- 4.3.3. Question Mark (High Growth, Low Market Share)
- 4.3.4. Dogs (Low Growth, Low Market Share)
- 4.4. Ansoff Matrix Analysis
- 4.5. Supply Chain Analysis
- 4.6. Regulatory Landscape
- 4.7. Current Market Potential and Opportunity Assessment (TAM–SAM–SOM Framework)
- 4.8. TIR Analyst Note
- 4.1. Porters Five Forces
- 5. Market Analysis, Insights and Forecast 2021-2033
- 5.1. Market Analysis, Insights and Forecast - by Business Mode
- 5.1.1. Captive API
- 5.1.2. Merchant API
- 5.2. Market Analysis, Insights and Forecast - by Synthesis Type
- 5.2.1. Synthetic
- 5.2.2. Biotech
- 5.3. Market Analysis, Insights and Forecast - by Drug Type
- 5.3.1. Generic
- 5.3.2. Branded
- 5.4. Market Analysis, Insights and Forecast - by Application
- 5.4.1. Cardiology
- 5.4.2. Oncology
- 5.4.3. Pulmonology
- 5.4.4. Neurology
- 5.4.5. Orthopedic
- 5.4.6. Ophthalmology
- 5.4.7. Other Applications
- 5.5. Market Analysis, Insights and Forecast - by Region
- 5.5.1. North America
- 5.5.2. South America
- 5.5.3. Europe
- 5.5.4. Middle East & Africa
- 5.5.5. Asia Pacific
- 5.1. Market Analysis, Insights and Forecast - by Business Mode
- 6. Global Active Pharmaceutical Ingredients Market Analysis, Insights and Forecast, 2021-2033
- 6.1. Market Analysis, Insights and Forecast - by Business Mode
- 6.1.1. Captive API
- 6.1.2. Merchant API
- 6.2. Market Analysis, Insights and Forecast - by Synthesis Type
- 6.2.1. Synthetic
- 6.2.2. Biotech
- 6.3. Market Analysis, Insights and Forecast - by Drug Type
- 6.3.1. Generic
- 6.3.2. Branded
- 6.4. Market Analysis, Insights and Forecast - by Application
- 6.4.1. Cardiology
- 6.4.2. Oncology
- 6.4.3. Pulmonology
- 6.4.4. Neurology
- 6.4.5. Orthopedic
- 6.4.6. Ophthalmology
- 6.4.7. Other Applications
- 6.1. Market Analysis, Insights and Forecast - by Business Mode
- 7. North America Active Pharmaceutical Ingredients Market Analysis, Insights and Forecast, 2020-2032
- 7.1. Market Analysis, Insights and Forecast - by Business Mode
- 7.1.1. Captive API
- 7.1.2. Merchant API
- 7.2. Market Analysis, Insights and Forecast - by Synthesis Type
- 7.2.1. Synthetic
- 7.2.2. Biotech
- 7.3. Market Analysis, Insights and Forecast - by Drug Type
- 7.3.1. Generic
- 7.3.2. Branded
- 7.4. Market Analysis, Insights and Forecast - by Application
- 7.4.1. Cardiology
- 7.4.2. Oncology
- 7.4.3. Pulmonology
- 7.4.4. Neurology
- 7.4.5. Orthopedic
- 7.4.6. Ophthalmology
- 7.4.7. Other Applications
- 7.1. Market Analysis, Insights and Forecast - by Business Mode
- 8. South America Active Pharmaceutical Ingredients Market Analysis, Insights and Forecast, 2020-2032
- 8.1. Market Analysis, Insights and Forecast - by Business Mode
- 8.1.1. Captive API
- 8.1.2. Merchant API
- 8.2. Market Analysis, Insights and Forecast - by Synthesis Type
- 8.2.1. Synthetic
- 8.2.2. Biotech
- 8.3. Market Analysis, Insights and Forecast - by Drug Type
- 8.3.1. Generic
- 8.3.2. Branded
- 8.4. Market Analysis, Insights and Forecast - by Application
- 8.4.1. Cardiology
- 8.4.2. Oncology
- 8.4.3. Pulmonology
- 8.4.4. Neurology
- 8.4.5. Orthopedic
- 8.4.6. Ophthalmology
- 8.4.7. Other Applications
- 8.1. Market Analysis, Insights and Forecast - by Business Mode
- 9. Europe Active Pharmaceutical Ingredients Market Analysis, Insights and Forecast, 2020-2032
- 9.1. Market Analysis, Insights and Forecast - by Business Mode
- 9.1.1. Captive API
- 9.1.2. Merchant API
- 9.2. Market Analysis, Insights and Forecast - by Synthesis Type
- 9.2.1. Synthetic
- 9.2.2. Biotech
- 9.3. Market Analysis, Insights and Forecast - by Drug Type
- 9.3.1. Generic
- 9.3.2. Branded
- 9.4. Market Analysis, Insights and Forecast - by Application
- 9.4.1. Cardiology
- 9.4.2. Oncology
- 9.4.3. Pulmonology
- 9.4.4. Neurology
- 9.4.5. Orthopedic
- 9.4.6. Ophthalmology
- 9.4.7. Other Applications
- 9.1. Market Analysis, Insights and Forecast - by Business Mode
- 10. Middle East & Africa Active Pharmaceutical Ingredients Market Analysis, Insights and Forecast, 2020-2032
- 10.1. Market Analysis, Insights and Forecast - by Business Mode
- 10.1.1. Captive API
- 10.1.2. Merchant API
- 10.2. Market Analysis, Insights and Forecast - by Synthesis Type
- 10.2.1. Synthetic
- 10.2.2. Biotech
- 10.3. Market Analysis, Insights and Forecast - by Drug Type
- 10.3.1. Generic
- 10.3.2. Branded
- 10.4. Market Analysis, Insights and Forecast - by Application
- 10.4.1. Cardiology
- 10.4.2. Oncology
- 10.4.3. Pulmonology
- 10.4.4. Neurology
- 10.4.5. Orthopedic
- 10.4.6. Ophthalmology
- 10.4.7. Other Applications
- 10.1. Market Analysis, Insights and Forecast - by Business Mode
- 11. Asia Pacific Active Pharmaceutical Ingredients Market Analysis, Insights and Forecast, 2020-2032
- 11.1. Market Analysis, Insights and Forecast - by Business Mode
- 11.1.1. Captive API
- 11.1.2. Merchant API
- 11.2. Market Analysis, Insights and Forecast - by Synthesis Type
- 11.2.1. Synthetic
- 11.2.2. Biotech
- 11.3. Market Analysis, Insights and Forecast - by Drug Type
- 11.3.1. Generic
- 11.3.2. Branded
- 11.4. Market Analysis, Insights and Forecast - by Application
- 11.4.1. Cardiology
- 11.4.2. Oncology
- 11.4.3. Pulmonology
- 11.4.4. Neurology
- 11.4.5. Orthopedic
- 11.4.6. Ophthalmology
- 11.4.7. Other Applications
- 11.1. Market Analysis, Insights and Forecast - by Business Mode
- 12. Competitive Analysis
- 12.1. Company Profiles
- 12.1.1 Boehringer Ingelheim GmbH
- 12.1.1.1. Company Overview
- 12.1.1.2. Products
- 12.1.1.3. Company Financials
- 12.1.1.4. SWOT Analysis
- 12.1.2 Novartis AG
- 12.1.2.1. Company Overview
- 12.1.2.2. Products
- 12.1.2.3. Company Financials
- 12.1.2.4. SWOT Analysis
- 12.1.3 Viatris Inc
- 12.1.3.1. Company Overview
- 12.1.3.2. Products
- 12.1.3.3. Company Financials
- 12.1.3.4. SWOT Analysis
- 12.1.4 Lupin Ltd
- 12.1.4.1. Company Overview
- 12.1.4.2. Products
- 12.1.4.3. Company Financials
- 12.1.4.4. SWOT Analysis
- 12.1.5 BASF SE
- 12.1.5.1. Company Overview
- 12.1.5.2. Products
- 12.1.5.3. Company Financials
- 12.1.5.4. SWOT Analysis
- 12.1.6 Sun Pharmaceutical Industries Ltd
- 12.1.6.1. Company Overview
- 12.1.6.2. Products
- 12.1.6.3. Company Financials
- 12.1.6.4. SWOT Analysis
- 12.1.7 Aurobindo Pharma
- 12.1.7.1. Company Overview
- 12.1.7.2. Products
- 12.1.7.3. Company Financials
- 12.1.7.4. SWOT Analysis
- 12.1.8 Sanofi Inc
- 12.1.8.1. Company Overview
- 12.1.8.2. Products
- 12.1.8.3. Company Financials
- 12.1.8.4. SWOT Analysis
- 12.1.9 Dr Reddy's Laboratories Ltd
- 12.1.9.1. Company Overview
- 12.1.9.2. Products
- 12.1.9.3. Company Financials
- 12.1.9.4. SWOT Analysis
- 12.1.10 GlaxoSmithKline PLC
- 12.1.10.1. Company Overview
- 12.1.10.2. Products
- 12.1.10.3. Company Financials
- 12.1.10.4. SWOT Analysis
- 12.1.11 Pfizer Inc
- 12.1.11.1. Company Overview
- 12.1.11.2. Products
- 12.1.11.3. Company Financials
- 12.1.11.4. SWOT Analysis
- 12.1.1 Boehringer Ingelheim GmbH
- 12.2. Market Entropy
- 12.2.1 Company's Key Areas Served
- 12.2.2 Recent Developments
- 12.3. Company Market Share Analysis 2025
- 12.3.1 Top 5 Companies Market Share Analysis
- 12.3.2 Top 3 Companies Market Share Analysis
- 12.4. List of Potential Customers
- 13. Research Methodology
List of Figures
- Figure 1: Global Active Pharmaceutical Ingredients Market Revenue Breakdown (Million, %) by Region 2025 & 2033
- Figure 2: Global Active Pharmaceutical Ingredients Market Volume Breakdown (k unit , %) by Region 2025 & 2033
- Figure 3: North America Active Pharmaceutical Ingredients Market Revenue (Million), by Business Mode 2025 & 2033
- Figure 4: North America Active Pharmaceutical Ingredients Market Volume (k unit ), by Business Mode 2025 & 2033
- Figure 5: North America Active Pharmaceutical Ingredients Market Revenue Share (%), by Business Mode 2025 & 2033
- Figure 6: North America Active Pharmaceutical Ingredients Market Volume Share (%), by Business Mode 2025 & 2033
- Figure 7: North America Active Pharmaceutical Ingredients Market Revenue (Million), by Synthesis Type 2025 & 2033
- Figure 8: North America Active Pharmaceutical Ingredients Market Volume (k unit ), by Synthesis Type 2025 & 2033
- Figure 9: North America Active Pharmaceutical Ingredients Market Revenue Share (%), by Synthesis Type 2025 & 2033
- Figure 10: North America Active Pharmaceutical Ingredients Market Volume Share (%), by Synthesis Type 2025 & 2033
- Figure 11: North America Active Pharmaceutical Ingredients Market Revenue (Million), by Drug Type 2025 & 2033
- Figure 12: North America Active Pharmaceutical Ingredients Market Volume (k unit ), by Drug Type 2025 & 2033
- Figure 13: North America Active Pharmaceutical Ingredients Market Revenue Share (%), by Drug Type 2025 & 2033
- Figure 14: North America Active Pharmaceutical Ingredients Market Volume Share (%), by Drug Type 2025 & 2033
- Figure 15: North America Active Pharmaceutical Ingredients Market Revenue (Million), by Application 2025 & 2033
- Figure 16: North America Active Pharmaceutical Ingredients Market Volume (k unit ), by Application 2025 & 2033
- Figure 17: North America Active Pharmaceutical Ingredients Market Revenue Share (%), by Application 2025 & 2033
- Figure 18: North America Active Pharmaceutical Ingredients Market Volume Share (%), by Application 2025 & 2033
- Figure 19: North America Active Pharmaceutical Ingredients Market Revenue (Million), by Country 2025 & 2033
- Figure 20: North America Active Pharmaceutical Ingredients Market Volume (k unit ), by Country 2025 & 2033
- Figure 21: North America Active Pharmaceutical Ingredients Market Revenue Share (%), by Country 2025 & 2033
- Figure 22: North America Active Pharmaceutical Ingredients Market Volume Share (%), by Country 2025 & 2033
- Figure 23: South America Active Pharmaceutical Ingredients Market Revenue (Million), by Business Mode 2025 & 2033
- Figure 24: South America Active Pharmaceutical Ingredients Market Volume (k unit ), by Business Mode 2025 & 2033
- Figure 25: South America Active Pharmaceutical Ingredients Market Revenue Share (%), by Business Mode 2025 & 2033
- Figure 26: South America Active Pharmaceutical Ingredients Market Volume Share (%), by Business Mode 2025 & 2033
- Figure 27: South America Active Pharmaceutical Ingredients Market Revenue (Million), by Synthesis Type 2025 & 2033
- Figure 28: South America Active Pharmaceutical Ingredients Market Volume (k unit ), by Synthesis Type 2025 & 2033
- Figure 29: South America Active Pharmaceutical Ingredients Market Revenue Share (%), by Synthesis Type 2025 & 2033
- Figure 30: South America Active Pharmaceutical Ingredients Market Volume Share (%), by Synthesis Type 2025 & 2033
- Figure 31: South America Active Pharmaceutical Ingredients Market Revenue (Million), by Drug Type 2025 & 2033
- Figure 32: South America Active Pharmaceutical Ingredients Market Volume (k unit ), by Drug Type 2025 & 2033
- Figure 33: South America Active Pharmaceutical Ingredients Market Revenue Share (%), by Drug Type 2025 & 2033
- Figure 34: South America Active Pharmaceutical Ingredients Market Volume Share (%), by Drug Type 2025 & 2033
- Figure 35: South America Active Pharmaceutical Ingredients Market Revenue (Million), by Application 2025 & 2033
- Figure 36: South America Active Pharmaceutical Ingredients Market Volume (k unit ), by Application 2025 & 2033
- Figure 37: South America Active Pharmaceutical Ingredients Market Revenue Share (%), by Application 2025 & 2033
- Figure 38: South America Active Pharmaceutical Ingredients Market Volume Share (%), by Application 2025 & 2033
- Figure 39: South America Active Pharmaceutical Ingredients Market Revenue (Million), by Country 2025 & 2033
- Figure 40: South America Active Pharmaceutical Ingredients Market Volume (k unit ), by Country 2025 & 2033
- Figure 41: South America Active Pharmaceutical Ingredients Market Revenue Share (%), by Country 2025 & 2033
- Figure 42: South America Active Pharmaceutical Ingredients Market Volume Share (%), by Country 2025 & 2033
- Figure 43: Europe Active Pharmaceutical Ingredients Market Revenue (Million), by Business Mode 2025 & 2033
- Figure 44: Europe Active Pharmaceutical Ingredients Market Volume (k unit ), by Business Mode 2025 & 2033
- Figure 45: Europe Active Pharmaceutical Ingredients Market Revenue Share (%), by Business Mode 2025 & 2033
- Figure 46: Europe Active Pharmaceutical Ingredients Market Volume Share (%), by Business Mode 2025 & 2033
- Figure 47: Europe Active Pharmaceutical Ingredients Market Revenue (Million), by Synthesis Type 2025 & 2033
- Figure 48: Europe Active Pharmaceutical Ingredients Market Volume (k unit ), by Synthesis Type 2025 & 2033
- Figure 49: Europe Active Pharmaceutical Ingredients Market Revenue Share (%), by Synthesis Type 2025 & 2033
- Figure 50: Europe Active Pharmaceutical Ingredients Market Volume Share (%), by Synthesis Type 2025 & 2033
- Figure 51: Europe Active Pharmaceutical Ingredients Market Revenue (Million), by Drug Type 2025 & 2033
- Figure 52: Europe Active Pharmaceutical Ingredients Market Volume (k unit ), by Drug Type 2025 & 2033
- Figure 53: Europe Active Pharmaceutical Ingredients Market Revenue Share (%), by Drug Type 2025 & 2033
- Figure 54: Europe Active Pharmaceutical Ingredients Market Volume Share (%), by Drug Type 2025 & 2033
- Figure 55: Europe Active Pharmaceutical Ingredients Market Revenue (Million), by Application 2025 & 2033
- Figure 56: Europe Active Pharmaceutical Ingredients Market Volume (k unit ), by Application 2025 & 2033
- Figure 57: Europe Active Pharmaceutical Ingredients Market Revenue Share (%), by Application 2025 & 2033
- Figure 58: Europe Active Pharmaceutical Ingredients Market Volume Share (%), by Application 2025 & 2033
- Figure 59: Europe Active Pharmaceutical Ingredients Market Revenue (Million), by Country 2025 & 2033
- Figure 60: Europe Active Pharmaceutical Ingredients Market Volume (k unit ), by Country 2025 & 2033
- Figure 61: Europe Active Pharmaceutical Ingredients Market Revenue Share (%), by Country 2025 & 2033
- Figure 62: Europe Active Pharmaceutical Ingredients Market Volume Share (%), by Country 2025 & 2033
- Figure 63: Middle East & Africa Active Pharmaceutical Ingredients Market Revenue (Million), by Business Mode 2025 & 2033
- Figure 64: Middle East & Africa Active Pharmaceutical Ingredients Market Volume (k unit ), by Business Mode 2025 & 2033
- Figure 65: Middle East & Africa Active Pharmaceutical Ingredients Market Revenue Share (%), by Business Mode 2025 & 2033
- Figure 66: Middle East & Africa Active Pharmaceutical Ingredients Market Volume Share (%), by Business Mode 2025 & 2033
- Figure 67: Middle East & Africa Active Pharmaceutical Ingredients Market Revenue (Million), by Synthesis Type 2025 & 2033
- Figure 68: Middle East & Africa Active Pharmaceutical Ingredients Market Volume (k unit ), by Synthesis Type 2025 & 2033
- Figure 69: Middle East & Africa Active Pharmaceutical Ingredients Market Revenue Share (%), by Synthesis Type 2025 & 2033
- Figure 70: Middle East & Africa Active Pharmaceutical Ingredients Market Volume Share (%), by Synthesis Type 2025 & 2033
- Figure 71: Middle East & Africa Active Pharmaceutical Ingredients Market Revenue (Million), by Drug Type 2025 & 2033
- Figure 72: Middle East & Africa Active Pharmaceutical Ingredients Market Volume (k unit ), by Drug Type 2025 & 2033
- Figure 73: Middle East & Africa Active Pharmaceutical Ingredients Market Revenue Share (%), by Drug Type 2025 & 2033
- Figure 74: Middle East & Africa Active Pharmaceutical Ingredients Market Volume Share (%), by Drug Type 2025 & 2033
- Figure 75: Middle East & Africa Active Pharmaceutical Ingredients Market Revenue (Million), by Application 2025 & 2033
- Figure 76: Middle East & Africa Active Pharmaceutical Ingredients Market Volume (k unit ), by Application 2025 & 2033
- Figure 77: Middle East & Africa Active Pharmaceutical Ingredients Market Revenue Share (%), by Application 2025 & 2033
- Figure 78: Middle East & Africa Active Pharmaceutical Ingredients Market Volume Share (%), by Application 2025 & 2033
- Figure 79: Middle East & Africa Active Pharmaceutical Ingredients Market Revenue (Million), by Country 2025 & 2033
- Figure 80: Middle East & Africa Active Pharmaceutical Ingredients Market Volume (k unit ), by Country 2025 & 2033
- Figure 81: Middle East & Africa Active Pharmaceutical Ingredients Market Revenue Share (%), by Country 2025 & 2033
- Figure 82: Middle East & Africa Active Pharmaceutical Ingredients Market Volume Share (%), by Country 2025 & 2033
- Figure 83: Asia Pacific Active Pharmaceutical Ingredients Market Revenue (Million), by Business Mode 2025 & 2033
- Figure 84: Asia Pacific Active Pharmaceutical Ingredients Market Volume (k unit ), by Business Mode 2025 & 2033
- Figure 85: Asia Pacific Active Pharmaceutical Ingredients Market Revenue Share (%), by Business Mode 2025 & 2033
- Figure 86: Asia Pacific Active Pharmaceutical Ingredients Market Volume Share (%), by Business Mode 2025 & 2033
- Figure 87: Asia Pacific Active Pharmaceutical Ingredients Market Revenue (Million), by Synthesis Type 2025 & 2033
- Figure 88: Asia Pacific Active Pharmaceutical Ingredients Market Volume (k unit ), by Synthesis Type 2025 & 2033
- Figure 89: Asia Pacific Active Pharmaceutical Ingredients Market Revenue Share (%), by Synthesis Type 2025 & 2033
- Figure 90: Asia Pacific Active Pharmaceutical Ingredients Market Volume Share (%), by Synthesis Type 2025 & 2033
- Figure 91: Asia Pacific Active Pharmaceutical Ingredients Market Revenue (Million), by Drug Type 2025 & 2033
- Figure 92: Asia Pacific Active Pharmaceutical Ingredients Market Volume (k unit ), by Drug Type 2025 & 2033
- Figure 93: Asia Pacific Active Pharmaceutical Ingredients Market Revenue Share (%), by Drug Type 2025 & 2033
- Figure 94: Asia Pacific Active Pharmaceutical Ingredients Market Volume Share (%), by Drug Type 2025 & 2033
- Figure 95: Asia Pacific Active Pharmaceutical Ingredients Market Revenue (Million), by Application 2025 & 2033
- Figure 96: Asia Pacific Active Pharmaceutical Ingredients Market Volume (k unit ), by Application 2025 & 2033
- Figure 97: Asia Pacific Active Pharmaceutical Ingredients Market Revenue Share (%), by Application 2025 & 2033
- Figure 98: Asia Pacific Active Pharmaceutical Ingredients Market Volume Share (%), by Application 2025 & 2033
- Figure 99: Asia Pacific Active Pharmaceutical Ingredients Market Revenue (Million), by Country 2025 & 2033
- Figure 100: Asia Pacific Active Pharmaceutical Ingredients Market Volume (k unit ), by Country 2025 & 2033
- Figure 101: Asia Pacific Active Pharmaceutical Ingredients Market Revenue Share (%), by Country 2025 & 2033
- Figure 102: Asia Pacific Active Pharmaceutical Ingredients Market Volume Share (%), by Country 2025 & 2033
List of Tables
- Table 1: Global Active Pharmaceutical Ingredients Market Revenue Million Forecast, by Business Mode 2020 & 2033
- Table 2: Global Active Pharmaceutical Ingredients Market Volume k unit Forecast, by Business Mode 2020 & 2033
- Table 3: Global Active Pharmaceutical Ingredients Market Revenue Million Forecast, by Synthesis Type 2020 & 2033
- Table 4: Global Active Pharmaceutical Ingredients Market Volume k unit Forecast, by Synthesis Type 2020 & 2033
- Table 5: Global Active Pharmaceutical Ingredients Market Revenue Million Forecast, by Drug Type 2020 & 2033
- Table 6: Global Active Pharmaceutical Ingredients Market Volume k unit Forecast, by Drug Type 2020 & 2033
- Table 7: Global Active Pharmaceutical Ingredients Market Revenue Million Forecast, by Application 2020 & 2033
- Table 8: Global Active Pharmaceutical Ingredients Market Volume k unit Forecast, by Application 2020 & 2033
- Table 9: Global Active Pharmaceutical Ingredients Market Revenue Million Forecast, by Region 2020 & 2033
- Table 10: Global Active Pharmaceutical Ingredients Market Volume k unit Forecast, by Region 2020 & 2033
- Table 11: Global Active Pharmaceutical Ingredients Market Revenue Million Forecast, by Business Mode 2020 & 2033
- Table 12: Global Active Pharmaceutical Ingredients Market Volume k unit Forecast, by Business Mode 2020 & 2033
- Table 13: Global Active Pharmaceutical Ingredients Market Revenue Million Forecast, by Synthesis Type 2020 & 2033
- Table 14: Global Active Pharmaceutical Ingredients Market Volume k unit Forecast, by Synthesis Type 2020 & 2033
- Table 15: Global Active Pharmaceutical Ingredients Market Revenue Million Forecast, by Drug Type 2020 & 2033
- Table 16: Global Active Pharmaceutical Ingredients Market Volume k unit Forecast, by Drug Type 2020 & 2033
- Table 17: Global Active Pharmaceutical Ingredients Market Revenue Million Forecast, by Application 2020 & 2033
- Table 18: Global Active Pharmaceutical Ingredients Market Volume k unit Forecast, by Application 2020 & 2033
- Table 19: Global Active Pharmaceutical Ingredients Market Revenue Million Forecast, by Country 2020 & 2033
- Table 20: Global Active Pharmaceutical Ingredients Market Volume k unit Forecast, by Country 2020 & 2033
- Table 21: United States Active Pharmaceutical Ingredients Market Revenue (Million) Forecast, by Application 2020 & 2033
- Table 22: United States Active Pharmaceutical Ingredients Market Volume (k unit ) Forecast, by Application 2020 & 2033
- Table 23: Canada Active Pharmaceutical Ingredients Market Revenue (Million) Forecast, by Application 2020 & 2033
- Table 24: Canada Active Pharmaceutical Ingredients Market Volume (k unit ) Forecast, by Application 2020 & 2033
- Table 25: Mexico Active Pharmaceutical Ingredients Market Revenue (Million) Forecast, by Application 2020 & 2033
- Table 26: Mexico Active Pharmaceutical Ingredients Market Volume (k unit ) Forecast, by Application 2020 & 2033
- Table 27: Global Active Pharmaceutical Ingredients Market Revenue Million Forecast, by Business Mode 2020 & 2033
- Table 28: Global Active Pharmaceutical Ingredients Market Volume k unit Forecast, by Business Mode 2020 & 2033
- Table 29: Global Active Pharmaceutical Ingredients Market Revenue Million Forecast, by Synthesis Type 2020 & 2033
- Table 30: Global Active Pharmaceutical Ingredients Market Volume k unit Forecast, by Synthesis Type 2020 & 2033
- Table 31: Global Active Pharmaceutical Ingredients Market Revenue Million Forecast, by Drug Type 2020 & 2033
- Table 32: Global Active Pharmaceutical Ingredients Market Volume k unit Forecast, by Drug Type 2020 & 2033
- Table 33: Global Active Pharmaceutical Ingredients Market Revenue Million Forecast, by Application 2020 & 2033
- Table 34: Global Active Pharmaceutical Ingredients Market Volume k unit Forecast, by Application 2020 & 2033
- Table 35: Global Active Pharmaceutical Ingredients Market Revenue Million Forecast, by Country 2020 & 2033
- Table 36: Global Active Pharmaceutical Ingredients Market Volume k unit Forecast, by Country 2020 & 2033
- Table 37: Brazil Active Pharmaceutical Ingredients Market Revenue (Million) Forecast, by Application 2020 & 2033
- Table 38: Brazil Active Pharmaceutical Ingredients Market Volume (k unit ) Forecast, by Application 2020 & 2033
- Table 39: Argentina Active Pharmaceutical Ingredients Market Revenue (Million) Forecast, by Application 2020 & 2033
- Table 40: Argentina Active Pharmaceutical Ingredients Market Volume (k unit ) Forecast, by Application 2020 & 2033
- Table 41: Rest of South America Active Pharmaceutical Ingredients Market Revenue (Million) Forecast, by Application 2020 & 2033
- Table 42: Rest of South America Active Pharmaceutical Ingredients Market Volume (k unit ) Forecast, by Application 2020 & 2033
- Table 43: Global Active Pharmaceutical Ingredients Market Revenue Million Forecast, by Business Mode 2020 & 2033
- Table 44: Global Active Pharmaceutical Ingredients Market Volume k unit Forecast, by Business Mode 2020 & 2033
- Table 45: Global Active Pharmaceutical Ingredients Market Revenue Million Forecast, by Synthesis Type 2020 & 2033
- Table 46: Global Active Pharmaceutical Ingredients Market Volume k unit Forecast, by Synthesis Type 2020 & 2033
- Table 47: Global Active Pharmaceutical Ingredients Market Revenue Million Forecast, by Drug Type 2020 & 2033
- Table 48: Global Active Pharmaceutical Ingredients Market Volume k unit Forecast, by Drug Type 2020 & 2033
- Table 49: Global Active Pharmaceutical Ingredients Market Revenue Million Forecast, by Application 2020 & 2033
- Table 50: Global Active Pharmaceutical Ingredients Market Volume k unit Forecast, by Application 2020 & 2033
- Table 51: Global Active Pharmaceutical Ingredients Market Revenue Million Forecast, by Country 2020 & 2033
- Table 52: Global Active Pharmaceutical Ingredients Market Volume k unit Forecast, by Country 2020 & 2033
- Table 53: United Kingdom Active Pharmaceutical Ingredients Market Revenue (Million) Forecast, by Application 2020 & 2033
- Table 54: United Kingdom Active Pharmaceutical Ingredients Market Volume (k unit ) Forecast, by Application 2020 & 2033
- Table 55: Germany Active Pharmaceutical Ingredients Market Revenue (Million) Forecast, by Application 2020 & 2033
- Table 56: Germany Active Pharmaceutical Ingredients Market Volume (k unit ) Forecast, by Application 2020 & 2033
- Table 57: France Active Pharmaceutical Ingredients Market Revenue (Million) Forecast, by Application 2020 & 2033
- Table 58: France Active Pharmaceutical Ingredients Market Volume (k unit ) Forecast, by Application 2020 & 2033
- Table 59: Italy Active Pharmaceutical Ingredients Market Revenue (Million) Forecast, by Application 2020 & 2033
- Table 60: Italy Active Pharmaceutical Ingredients Market Volume (k unit ) Forecast, by Application 2020 & 2033
- Table 61: Spain Active Pharmaceutical Ingredients Market Revenue (Million) Forecast, by Application 2020 & 2033
- Table 62: Spain Active Pharmaceutical Ingredients Market Volume (k unit ) Forecast, by Application 2020 & 2033
- Table 63: Russia Active Pharmaceutical Ingredients Market Revenue (Million) Forecast, by Application 2020 & 2033
- Table 64: Russia Active Pharmaceutical Ingredients Market Volume (k unit ) Forecast, by Application 2020 & 2033
- Table 65: Benelux Active Pharmaceutical Ingredients Market Revenue (Million) Forecast, by Application 2020 & 2033
- Table 66: Benelux Active Pharmaceutical Ingredients Market Volume (k unit ) Forecast, by Application 2020 & 2033
- Table 67: Nordics Active Pharmaceutical Ingredients Market Revenue (Million) Forecast, by Application 2020 & 2033
- Table 68: Nordics Active Pharmaceutical Ingredients Market Volume (k unit ) Forecast, by Application 2020 & 2033
- Table 69: Rest of Europe Active Pharmaceutical Ingredients Market Revenue (Million) Forecast, by Application 2020 & 2033
- Table 70: Rest of Europe Active Pharmaceutical Ingredients Market Volume (k unit ) Forecast, by Application 2020 & 2033
- Table 71: Global Active Pharmaceutical Ingredients Market Revenue Million Forecast, by Business Mode 2020 & 2033
- Table 72: Global Active Pharmaceutical Ingredients Market Volume k unit Forecast, by Business Mode 2020 & 2033
- Table 73: Global Active Pharmaceutical Ingredients Market Revenue Million Forecast, by Synthesis Type 2020 & 2033
- Table 74: Global Active Pharmaceutical Ingredients Market Volume k unit Forecast, by Synthesis Type 2020 & 2033
- Table 75: Global Active Pharmaceutical Ingredients Market Revenue Million Forecast, by Drug Type 2020 & 2033
- Table 76: Global Active Pharmaceutical Ingredients Market Volume k unit Forecast, by Drug Type 2020 & 2033
- Table 77: Global Active Pharmaceutical Ingredients Market Revenue Million Forecast, by Application 2020 & 2033
- Table 78: Global Active Pharmaceutical Ingredients Market Volume k unit Forecast, by Application 2020 & 2033
- Table 79: Global Active Pharmaceutical Ingredients Market Revenue Million Forecast, by Country 2020 & 2033
- Table 80: Global Active Pharmaceutical Ingredients Market Volume k unit Forecast, by Country 2020 & 2033
- Table 81: Turkey Active Pharmaceutical Ingredients Market Revenue (Million) Forecast, by Application 2020 & 2033
- Table 82: Turkey Active Pharmaceutical Ingredients Market Volume (k unit ) Forecast, by Application 2020 & 2033
- Table 83: Israel Active Pharmaceutical Ingredients Market Revenue (Million) Forecast, by Application 2020 & 2033
- Table 84: Israel Active Pharmaceutical Ingredients Market Volume (k unit ) Forecast, by Application 2020 & 2033
- Table 85: GCC Active Pharmaceutical Ingredients Market Revenue (Million) Forecast, by Application 2020 & 2033
- Table 86: GCC Active Pharmaceutical Ingredients Market Volume (k unit ) Forecast, by Application 2020 & 2033
- Table 87: North Africa Active Pharmaceutical Ingredients Market Revenue (Million) Forecast, by Application 2020 & 2033
- Table 88: North Africa Active Pharmaceutical Ingredients Market Volume (k unit ) Forecast, by Application 2020 & 2033
- Table 89: South Africa Active Pharmaceutical Ingredients Market Revenue (Million) Forecast, by Application 2020 & 2033
- Table 90: South Africa Active Pharmaceutical Ingredients Market Volume (k unit ) Forecast, by Application 2020 & 2033
- Table 91: Rest of Middle East & Africa Active Pharmaceutical Ingredients Market Revenue (Million) Forecast, by Application 2020 & 2033
- Table 92: Rest of Middle East & Africa Active Pharmaceutical Ingredients Market Volume (k unit ) Forecast, by Application 2020 & 2033
- Table 93: Global Active Pharmaceutical Ingredients Market Revenue Million Forecast, by Business Mode 2020 & 2033
- Table 94: Global Active Pharmaceutical Ingredients Market Volume k unit Forecast, by Business Mode 2020 & 2033
- Table 95: Global Active Pharmaceutical Ingredients Market Revenue Million Forecast, by Synthesis Type 2020 & 2033
- Table 96: Global Active Pharmaceutical Ingredients Market Volume k unit Forecast, by Synthesis Type 2020 & 2033
- Table 97: Global Active Pharmaceutical Ingredients Market Revenue Million Forecast, by Drug Type 2020 & 2033
- Table 98: Global Active Pharmaceutical Ingredients Market Volume k unit Forecast, by Drug Type 2020 & 2033
- Table 99: Global Active Pharmaceutical Ingredients Market Revenue Million Forecast, by Application 2020 & 2033
- Table 100: Global Active Pharmaceutical Ingredients Market Volume k unit Forecast, by Application 2020 & 2033
- Table 101: Global Active Pharmaceutical Ingredients Market Revenue Million Forecast, by Country 2020 & 2033
- Table 102: Global Active Pharmaceutical Ingredients Market Volume k unit Forecast, by Country 2020 & 2033
- Table 103: China Active Pharmaceutical Ingredients Market Revenue (Million) Forecast, by Application 2020 & 2033
- Table 104: China Active Pharmaceutical Ingredients Market Volume (k unit ) Forecast, by Application 2020 & 2033
- Table 105: India Active Pharmaceutical Ingredients Market Revenue (Million) Forecast, by Application 2020 & 2033
- Table 106: India Active Pharmaceutical Ingredients Market Volume (k unit ) Forecast, by Application 2020 & 2033
- Table 107: Japan Active Pharmaceutical Ingredients Market Revenue (Million) Forecast, by Application 2020 & 2033
- Table 108: Japan Active Pharmaceutical Ingredients Market Volume (k unit ) Forecast, by Application 2020 & 2033
- Table 109: South Korea Active Pharmaceutical Ingredients Market Revenue (Million) Forecast, by Application 2020 & 2033
- Table 110: South Korea Active Pharmaceutical Ingredients Market Volume (k unit ) Forecast, by Application 2020 & 2033
- Table 111: ASEAN Active Pharmaceutical Ingredients Market Revenue (Million) Forecast, by Application 2020 & 2033
- Table 112: ASEAN Active Pharmaceutical Ingredients Market Volume (k unit ) Forecast, by Application 2020 & 2033
- Table 113: Oceania Active Pharmaceutical Ingredients Market Revenue (Million) Forecast, by Application 2020 & 2033
- Table 114: Oceania Active Pharmaceutical Ingredients Market Volume (k unit ) Forecast, by Application 2020 & 2033
- Table 115: Rest of Asia Pacific Active Pharmaceutical Ingredients Market Revenue (Million) Forecast, by Application 2020 & 2033
- Table 116: Rest of Asia Pacific Active Pharmaceutical Ingredients Market Volume (k unit ) Forecast, by Application 2020 & 2033
Frequently Asked Questions
1. What is the projected Compound Annual Growth Rate (CAGR) of the Active Pharmaceutical Ingredients Market?
The projected CAGR is approximately 8.31%.
2. Which companies are prominent players in the Active Pharmaceutical Ingredients Market?
Key companies in the market include Boehringer Ingelheim GmbH, Novartis AG, Viatris Inc, Lupin Ltd, BASF SE, Sun Pharmaceutical Industries Ltd, Aurobindo Pharma, Sanofi Inc, Dr Reddy's Laboratories Ltd, GlaxoSmithKline PLC, Pfizer Inc.
3. What are the main segments of the Active Pharmaceutical Ingredients Market?
The market segments include Business Mode, Synthesis Type, Drug Type, Application.
4. Can you provide details about the market size?
The market size is estimated to be USD 13.64 Million as of 2022.
5. What are some drivers contributing to market growth?
Increasing Prevalence of Infectious. Genetic. Cardiovascular. and Other Chronic Disorders; Rising Research & Development Activities of Generic Drugs; Increasing Adoption of Biologicals and Biosimilars.
6. What are the notable trends driving market growth?
Oncology Segment Expects to Register a High CAGR.
7. Are there any restraints impacting market growth?
Drug Price Control Policies; Stringent Regulations and Drug Price Policies in the Country.
8. Can you provide examples of recent developments in the market?
July 2022: Piramal Pharma Limited's Pharma Solutions business, a leading Contract Development and Manufacturing Organization (CDMO), launched a new active pharmaceutical ingredient (API) plant at the company's site in Aurora, Ontario.
9. What pricing options are available for accessing the report?
Pricing options include single-user, multi-user, and enterprise licenses priced at USD 3800, USD 4500, and USD 5800 respectively.
10. Is the market size provided in terms of value or volume?
The market size is provided in terms of value, measured in Million and volume, measured in k unit .
11. Are there any specific market keywords associated with the report?
Yes, the market keyword associated with the report is "Active Pharmaceutical Ingredients Market," which aids in identifying and referencing the specific market segment covered.
12. How do I determine which pricing option suits my needs best?
The pricing options vary based on user requirements and access needs. Individual users may opt for single-user licenses, while businesses requiring broader access may choose multi-user or enterprise licenses for cost-effective access to the report.
13. Are there any additional resources or data provided in the Active Pharmaceutical Ingredients Market report?
While the report offers comprehensive insights, it's advisable to review the specific contents or supplementary materials provided to ascertain if additional resources or data are available.
14. How can I stay updated on further developments or reports in the Active Pharmaceutical Ingredients Market?
To stay informed about further developments, trends, and reports in the Active Pharmaceutical Ingredients Market, consider subscribing to industry newsletters, following relevant companies and organizations, or regularly checking reputable industry news sources and publications.
Methodology
Step 1 - Identification of Relevant Samples Size from Population Database


Step 2 - Approaches for Defining Global Market Size (Value, Volume* & Price*)

Note*: In applicable scenarios
Step 3 - Data Sources
Primary Research
- Web Analytics
- Survey Reports
- Research Institute
- Latest Research Reports
- Opinion Leaders
Secondary Research
- Annual Reports
- White Paper
- Latest Press Release
- Industry Association
- Paid Database
- Investor Presentations

Step 4 - Data Triangulation
Involves using different sources of information in order to increase the validity of a study
These sources are likely to be stakeholders in a program - participants, other researchers, program staff, other community members, and so on.
Then we put all data in single framework & apply various statistical tools to find out the dynamic on the market.
During the analysis stage, feedback from the stakeholder groups would be compared to determine areas of agreement as well as areas of divergence