

Key Insights
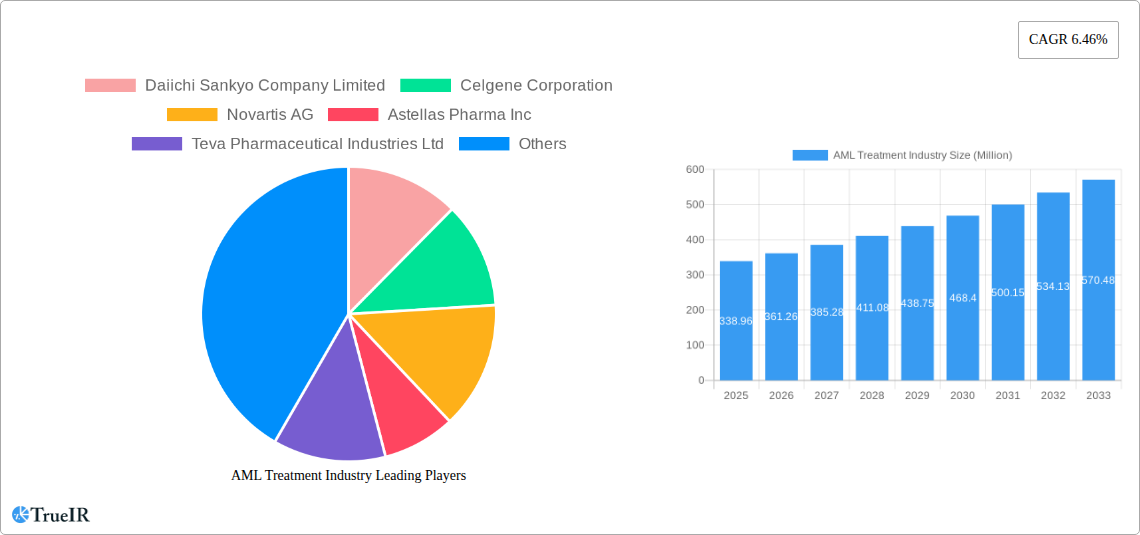
The Acute Myeloid Leukemia (AML) treatment market, valued at $338.96 million in 2025, exhibits robust growth potential, projected to expand significantly between 2025 and 2033. A Compound Annual Growth Rate (CAGR) of 6.46% indicates a steadily increasing demand for effective AML therapies. This growth is fueled by several factors. The rising prevalence of AML, particularly among older populations, is a primary driver. Advancements in targeted therapies, such as novel antibody-drug conjugates and improved chemotherapy regimens, are significantly enhancing treatment outcomes and extending patient survival. Furthermore, the increasing adoption of stem cell transplantation, while costly, represents a critical advancement in treating high-risk AML. However, the market faces challenges. The high cost of innovative therapies, particularly targeted therapies and stem cell transplants, limits accessibility for many patients. Furthermore, the inherent complexities of AML, including its heterogeneity and potential for relapse, necessitate continuous research and development of new treatment strategies. The competitive landscape is characterized by major pharmaceutical companies like Daiichi Sankyo, Celgene, Novartis, and Pfizer, among others, actively engaged in research and development, contributing to ongoing innovation in this vital sector. Regional variations exist, with North America and Europe currently holding substantial market shares, while Asia Pacific is anticipated to experience significant growth, driven by increasing healthcare spending and expanding awareness of AML.
The segmentation of the AML treatment market reveals a diversified therapeutic landscape. Chemotherapy remains a cornerstone of treatment, but targeted therapies are gaining prominence due to their potential for improved efficacy and reduced side effects. Stem cell transplantation is becoming increasingly vital for high-risk cases, but access remains limited due to cost and availability. The competitive landscape is marked by intense innovation, with companies continuously striving to bring forth novel therapies with superior efficacy and safety profiles. This continuous drive for innovation is likely to further accelerate the market's growth trajectory in the coming years. Regulatory approvals and reimbursement policies will also play crucial roles in shaping market access and overall growth potential.
AML Treatment Industry Market Report: 2019-2033
This comprehensive report provides a detailed analysis of the AML treatment industry, covering market size, growth trends, competitive landscape, and future outlook from 2019 to 2033. The study period spans from 2019–2024 (Historical Period), with 2025 as the Base Year and Estimated Year, and forecasts extending to 2033 (Forecast Period). The report leverages extensive primary and secondary research to deliver actionable insights for stakeholders across the AML treatment value chain. Market values are expressed in Millions.
AML Treatment Industry Market Structure & Competitive Landscape
The AML treatment market exhibits a moderately concentrated structure, with several multinational pharmaceutical companies holding significant market share. The Herfindahl-Hirschman Index (HHI) for 2024 is estimated at xx, indicating a moderately concentrated market. Innovation is a key driver, fueled by substantial R&D investments by leading players. Stringent regulatory approvals and evolving treatment guidelines significantly impact market dynamics. Product substitutes, particularly in the realm of targeted therapies, are continually emerging, increasing competition. The end-user segment primarily comprises hospitals, specialized oncology clinics, and research institutions. Mergers and acquisitions (M&A) activity has been relatively high in recent years, with approximately xx M&A deals valued at xx Million in the period 2019-2024, reflecting consolidation and expansion strategies.
- Market Concentration: Moderately concentrated (HHI xx in 2024).
- Innovation Drivers: Significant R&D investments by leading players, focusing on novel therapies and targeted approaches.
- Regulatory Impacts: Stringent approval processes and evolving treatment guidelines influence market access.
- Product Substitutes: Emergence of new targeted therapies and alternative treatment approaches increases competition.
- End-User Segmentation: Primarily hospitals, specialized oncology clinics, and research institutions.
- M&A Trends: xx M&A deals totaling xx Million from 2019-2024, driven by consolidation and expansion strategies.
AML Treatment Industry Market Trends & Opportunities
The global AML treatment market is projected to exhibit robust growth, with a Compound Annual Growth Rate (CAGR) of xx% during the forecast period (2025-2033). Market size is estimated at xx Million in 2025 and is projected to reach xx Million by 2033. This growth is driven by several factors, including rising AML incidence rates, increasing geriatric population, advancements in targeted therapies, and growing awareness among patients and healthcare professionals. Technological advancements, such as the development of CAR T-cell therapy and next-generation sequencing, are creating significant opportunities. Consumer preferences are increasingly shifting towards personalized medicine and less toxic treatment options. Competitive dynamics are characterized by ongoing innovation, strategic partnerships, and increasing market entry by smaller biotech companies. Market penetration rates for novel therapies vary widely depending on the specific treatment modality and regional context.

Dominant Markets & Segments in AML Treatment Industry
The North American market currently holds the largest share of the global AML treatment market, followed by Europe and Asia-Pacific. Within therapeutic segments, chemotherapy remains the dominant treatment modality, accounting for the largest market share. However, targeted therapy is exhibiting significant growth, driven by advancements in understanding AML biology and development of precision oncology approaches. Stem cell transplant, while a critical treatment option for specific patient subgroups, represents a smaller but significant market segment. "Other therapies" encompass supportive care and emerging treatment modalities.
- Key Growth Drivers (North America): Robust healthcare infrastructure, high healthcare expenditure, and early adoption of novel therapies.
- Key Growth Drivers (Europe): Well-established healthcare systems, increasing focus on personalized medicine initiatives, and supportive regulatory frameworks.
- Key Growth Drivers (Asia-Pacific): Growing awareness, rising healthcare expenditure, and increasing prevalence of AML.
The dominance of chemotherapy is primarily attributed to its established efficacy and wide accessibility. Targeted therapy's growth stems from its potential to achieve superior outcomes with fewer side effects, while stem cell transplant remains a crucial intervention for specific patient populations. The "Other therapies" segment holds potential for future expansion with the emergence of novel treatment approaches.
AML Treatment Industry Product Analysis
Technological advancements are revolutionizing AML treatment. Targeted therapies, CAR T-cell therapy, and novel drug conjugates represent significant breakthroughs, offering improved efficacy, reduced toxicity, and enhanced patient outcomes. These products cater to the growing demand for personalized and effective treatment approaches, aligning with evolving market needs and patient preferences. Competitive advantages are primarily driven by innovative technology, strong intellectual property portfolios, and efficient manufacturing capabilities.
Key Drivers, Barriers & Challenges in AML Treatment Industry
Key Drivers:
- Rising AML incidence: Aging population and increased exposure to risk factors.
- Technological advancements: Development of targeted therapies, CAR T-cell therapy, and other innovative treatments.
- Increased healthcare expenditure: Growing investment in oncology research and treatment.
Challenges:
- High treatment costs: Limiting access for many patients, especially in low- and middle-income countries.
- Treatment toxicity: Side effects of chemotherapy and other AML treatments can be severe.
- Regulatory hurdles: Stringent approval processes can delay market entry of new therapies. An estimated xx Million in revenue was lost in 2024 due to regulatory delays.
- Competition: Numerous players vying for market share through innovation and improved therapies.
Growth Drivers in the AML Treatment Industry Market
The AML treatment market is propelled by rising AML prevalence, particularly in aging populations; ongoing technological advances leading to more effective and targeted therapies; and increasing investments in R&D within the pharmaceutical and biotechnology sectors. Favorable regulatory environments facilitating the approval and market entry of innovative therapies also contribute significantly.
Challenges Impacting AML Treatment Industry Growth
Significant challenges include the high cost of innovative therapies, limiting accessibility; the severe side effects associated with many AML treatments; and navigating complex and lengthy regulatory approval processes. Furthermore, intense competition among established pharmaceutical companies and emerging biotech firms impacts profitability and market penetration for individual players.
Key Players Shaping the AML Treatment Industry Market
- Daiichi Sankyo Company Limited
- Celgene Corporation (now part of Bristol Myers Squibb)
- Novartis AG
- Astellas Pharma Inc
- Teva Pharmaceutical Industries Ltd
- AbbVie Inc
- Sun Pharmaceutical Industries Ltd
- Fresenius SE & Co KGaA
- Viatris (Mylan NV)
- Pfizer Inc
Significant AML Treatment Industry Milestones
- May 2024: Nippon Shinyaku Co., Ltd. introduced Vyxeos Combination, an I.V. injection targeting high-risk AML patients in Japan. This launch broadened treatment options for a challenging patient population.
- March 2024: Novartis India secured a distribution partner for Asciminib, expanding access to a novel CML therapy in India. This strategic move demonstrates a focus on emerging markets.
Future Outlook for AML Treatment Industry Market
The AML treatment market is poised for sustained growth, driven by continued innovation in targeted therapies, immunotherapies, and supportive care. Strategic partnerships, acquisitions, and market expansions into emerging economies will play a critical role in shaping the future landscape. The development of more personalized and effective treatments holds significant market potential.
AML Treatment Industry Segmentation
-
1. Therapy
-
1.1. Chemotherapy
- 1.1.1. Anthracycline Drugs
- 1.1.2. Alkylating Agents
- 1.1.3. Anti-metabolites
- 1.1.4. Other Chemotherapies
- 1.2. Targeted Therapy
- 1.3. Stem Cell Transplant
- 1.4. Other Therapies
-
1.1. Chemotherapy
-
2. Geography
- 2.1. China
- 2.2. Japan
- 2.3. India
- 2.4. Australia
- 2.5. South Korea
- 2.6. Rest of Asia-Pacific
AML Treatment Industry Segmentation By Geography
- 1. China
- 2. Japan
- 3. India
- 4. Australia
- 5. South Korea
- 6. Rest of Asia Pacific

AML Treatment Industry REPORT HIGHLIGHTS
| Aspects | Details |
|---|---|
| Study Period | 2019-2033 |
| Base Year | 2024 |
| Estimated Year | 2025 |
| Forecast Period | 2025-2033 |
| Historical Period | 2019-2024 |
| Growth Rate | CAGR of 6.46% from 2019-2033 |
| Segmentation |
|
Table of Contents
- 1. Introduction
- 1.1. Research Scope
- 1.2. Market Segmentation
- 1.3. Research Methodology
- 1.4. Definitions and Assumptions
- 2. Executive Summary
- 2.1. Introduction
- 3. Market Dynamics
- 3.1. Introduction
- 3.2. Market Drivers
- 3.2.1. High Incidence and Prevalence of Acute Myeloid Leukemia; Advancement in Pharmacology and Molecular Biology to Promote Drug Development
- 3.3. Market Restrains
- 3.3.1. Complications Related to Chemotherapy
- 3.4. Market Trends
- 3.4.1. The Chemotherapy Segment is Anticipated to Witness a Growth Over the Forecast Period
- 4. Market Factor Analysis
- 4.1. Porters Five Forces
- 4.2. Supply/Value Chain
- 4.3. PESTEL analysis
- 4.4. Market Entropy
- 4.5. Patent/Trademark Analysis
- 5. Global AML Treatment Industry Analysis, Insights and Forecast, 2019-2031
- 5.1. Market Analysis, Insights and Forecast - by Therapy
- 5.1.1. Chemotherapy
- 5.1.1.1. Anthracycline Drugs
- 5.1.1.2. Alkylating Agents
- 5.1.1.3. Anti-metabolites
- 5.1.1.4. Other Chemotherapies
- 5.1.2. Targeted Therapy
- 5.1.3. Stem Cell Transplant
- 5.1.4. Other Therapies
- 5.1.1. Chemotherapy
- 5.2. Market Analysis, Insights and Forecast - by Geography
- 5.2.1. China
- 5.2.2. Japan
- 5.2.3. India
- 5.2.4. Australia
- 5.2.5. South Korea
- 5.2.6. Rest of Asia-Pacific
- 5.3. Market Analysis, Insights and Forecast - by Region
- 5.3.1. China
- 5.3.2. Japan
- 5.3.3. India
- 5.3.4. Australia
- 5.3.5. South Korea
- 5.3.6. Rest of Asia Pacific
- 5.1. Market Analysis, Insights and Forecast - by Therapy
- 6. China AML Treatment Industry Analysis, Insights and Forecast, 2019-2031
- 6.1. Market Analysis, Insights and Forecast - by Therapy
- 6.1.1. Chemotherapy
- 6.1.1.1. Anthracycline Drugs
- 6.1.1.2. Alkylating Agents
- 6.1.1.3. Anti-metabolites
- 6.1.1.4. Other Chemotherapies
- 6.1.2. Targeted Therapy
- 6.1.3. Stem Cell Transplant
- 6.1.4. Other Therapies
- 6.1.1. Chemotherapy
- 6.2. Market Analysis, Insights and Forecast - by Geography
- 6.2.1. China
- 6.2.2. Japan
- 6.2.3. India
- 6.2.4. Australia
- 6.2.5. South Korea
- 6.2.6. Rest of Asia-Pacific
- 6.1. Market Analysis, Insights and Forecast - by Therapy
- 7. Japan AML Treatment Industry Analysis, Insights and Forecast, 2019-2031
- 7.1. Market Analysis, Insights and Forecast - by Therapy
- 7.1.1. Chemotherapy
- 7.1.1.1. Anthracycline Drugs
- 7.1.1.2. Alkylating Agents
- 7.1.1.3. Anti-metabolites
- 7.1.1.4. Other Chemotherapies
- 7.1.2. Targeted Therapy
- 7.1.3. Stem Cell Transplant
- 7.1.4. Other Therapies
- 7.1.1. Chemotherapy
- 7.2. Market Analysis, Insights and Forecast - by Geography
- 7.2.1. China
- 7.2.2. Japan
- 7.2.3. India
- 7.2.4. Australia
- 7.2.5. South Korea
- 7.2.6. Rest of Asia-Pacific
- 7.1. Market Analysis, Insights and Forecast - by Therapy
- 8. India AML Treatment Industry Analysis, Insights and Forecast, 2019-2031
- 8.1. Market Analysis, Insights and Forecast - by Therapy
- 8.1.1. Chemotherapy
- 8.1.1.1. Anthracycline Drugs
- 8.1.1.2. Alkylating Agents
- 8.1.1.3. Anti-metabolites
- 8.1.1.4. Other Chemotherapies
- 8.1.2. Targeted Therapy
- 8.1.3. Stem Cell Transplant
- 8.1.4. Other Therapies
- 8.1.1. Chemotherapy
- 8.2. Market Analysis, Insights and Forecast - by Geography
- 8.2.1. China
- 8.2.2. Japan
- 8.2.3. India
- 8.2.4. Australia
- 8.2.5. South Korea
- 8.2.6. Rest of Asia-Pacific
- 8.1. Market Analysis, Insights and Forecast - by Therapy
- 9. Australia AML Treatment Industry Analysis, Insights and Forecast, 2019-2031
- 9.1. Market Analysis, Insights and Forecast - by Therapy
- 9.1.1. Chemotherapy
- 9.1.1.1. Anthracycline Drugs
- 9.1.1.2. Alkylating Agents
- 9.1.1.3. Anti-metabolites
- 9.1.1.4. Other Chemotherapies
- 9.1.2. Targeted Therapy
- 9.1.3. Stem Cell Transplant
- 9.1.4. Other Therapies
- 9.1.1. Chemotherapy
- 9.2. Market Analysis, Insights and Forecast - by Geography
- 9.2.1. China
- 9.2.2. Japan
- 9.2.3. India
- 9.2.4. Australia
- 9.2.5. South Korea
- 9.2.6. Rest of Asia-Pacific
- 9.1. Market Analysis, Insights and Forecast - by Therapy
- 10. South Korea AML Treatment Industry Analysis, Insights and Forecast, 2019-2031
- 10.1. Market Analysis, Insights and Forecast - by Therapy
- 10.1.1. Chemotherapy
- 10.1.1.1. Anthracycline Drugs
- 10.1.1.2. Alkylating Agents
- 10.1.1.3. Anti-metabolites
- 10.1.1.4. Other Chemotherapies
- 10.1.2. Targeted Therapy
- 10.1.3. Stem Cell Transplant
- 10.1.4. Other Therapies
- 10.1.1. Chemotherapy
- 10.2. Market Analysis, Insights and Forecast - by Geography
- 10.2.1. China
- 10.2.2. Japan
- 10.2.3. India
- 10.2.4. Australia
- 10.2.5. South Korea
- 10.2.6. Rest of Asia-Pacific
- 10.1. Market Analysis, Insights and Forecast - by Therapy
- 11. Rest of Asia Pacific AML Treatment Industry Analysis, Insights and Forecast, 2019-2031
- 11.1. Market Analysis, Insights and Forecast - by Therapy
- 11.1.1. Chemotherapy
- 11.1.1.1. Anthracycline Drugs
- 11.1.1.2. Alkylating Agents
- 11.1.1.3. Anti-metabolites
- 11.1.1.4. Other Chemotherapies
- 11.1.2. Targeted Therapy
- 11.1.3. Stem Cell Transplant
- 11.1.4. Other Therapies
- 11.1.1. Chemotherapy
- 11.2. Market Analysis, Insights and Forecast - by Geography
- 11.2.1. China
- 11.2.2. Japan
- 11.2.3. India
- 11.2.4. Australia
- 11.2.5. South Korea
- 11.2.6. Rest of Asia-Pacific
- 11.1. Market Analysis, Insights and Forecast - by Therapy
- 12. North America AML Treatment Industry Analysis, Insights and Forecast, 2019-2031
- 12.1. Market Analysis, Insights and Forecast - By Country/Sub-region
- 12.1.1. undefined
- 13. Europe AML Treatment Industry Analysis, Insights and Forecast, 2019-2031
- 13.1. Market Analysis, Insights and Forecast - By Country/Sub-region
- 13.1.1. undefined
- 14. Asia Pacific AML Treatment Industry Analysis, Insights and Forecast, 2019-2031
- 14.1. Market Analysis, Insights and Forecast - By Country/Sub-region
- 14.1.1. undefined
- 15. South America AML Treatment Industry Analysis, Insights and Forecast, 2019-2031
- 15.1. Market Analysis, Insights and Forecast - By Country/Sub-region
- 15.1.1. undefined
- 16. North America AML Treatment Industry Analysis, Insights and Forecast, 2019-2031
- 16.1. Market Analysis, Insights and Forecast - By Country/Sub-region
- 16.1.1. undefined
- 17. MEA AML Treatment Industry Analysis, Insights and Forecast, 2019-2031
- 17.1. Market Analysis, Insights and Forecast - By Country/Sub-region
- 17.1.1. undefined
- 18. Competitive Analysis
- 18.1. Global Market Share Analysis 2024
- 18.2. Company Profiles
- 18.2.1 Daiichi Sankyo Company Limited
- 18.2.1.1. Overview
- 18.2.1.2. Products
- 18.2.1.3. SWOT Analysis
- 18.2.1.4. Recent Developments
- 18.2.1.5. Financials (Based on Availability)
- 18.2.2 Celgene Corporation
- 18.2.2.1. Overview
- 18.2.2.2. Products
- 18.2.2.3. SWOT Analysis
- 18.2.2.4. Recent Developments
- 18.2.2.5. Financials (Based on Availability)
- 18.2.3 Novartis AG
- 18.2.3.1. Overview
- 18.2.3.2. Products
- 18.2.3.3. SWOT Analysis
- 18.2.3.4. Recent Developments
- 18.2.3.5. Financials (Based on Availability)
- 18.2.4 Astellas Pharma Inc
- 18.2.4.1. Overview
- 18.2.4.2. Products
- 18.2.4.3. SWOT Analysis
- 18.2.4.4. Recent Developments
- 18.2.4.5. Financials (Based on Availability)
- 18.2.5 Teva Pharmaceutical Industries Ltd
- 18.2.5.1. Overview
- 18.2.5.2. Products
- 18.2.5.3. SWOT Analysis
- 18.2.5.4. Recent Developments
- 18.2.5.5. Financials (Based on Availability)
- 18.2.6 AbbVie Inc
- 18.2.6.1. Overview
- 18.2.6.2. Products
- 18.2.6.3. SWOT Analysis
- 18.2.6.4. Recent Developments
- 18.2.6.5. Financials (Based on Availability)
- 18.2.7 Sun Pharmaceutical Industries Ltd
- 18.2.7.1. Overview
- 18.2.7.2. Products
- 18.2.7.3. SWOT Analysis
- 18.2.7.4. Recent Developments
- 18.2.7.5. Financials (Based on Availability)
- 18.2.8 Fresenius SE & Co KGaA
- 18.2.8.1. Overview
- 18.2.8.2. Products
- 18.2.8.3. SWOT Analysis
- 18.2.8.4. Recent Developments
- 18.2.8.5. Financials (Based on Availability)
- 18.2.9 Viatris (Mylan NV)
- 18.2.9.1. Overview
- 18.2.9.2. Products
- 18.2.9.3. SWOT Analysis
- 18.2.9.4. Recent Developments
- 18.2.9.5. Financials (Based on Availability)
- 18.2.10 Pfizer Inc
- 18.2.10.1. Overview
- 18.2.10.2. Products
- 18.2.10.3. SWOT Analysis
- 18.2.10.4. Recent Developments
- 18.2.10.5. Financials (Based on Availability)
- 18.2.1 Daiichi Sankyo Company Limited
List of Figures
- Figure 1: Global AML Treatment Industry Revenue Breakdown (Million, %) by Region 2024 & 2032
- Figure 2: Global AML Treatment Industry Volume Breakdown (K Unit, %) by Region 2024 & 2032
- Figure 3: North America AML Treatment Industry Revenue (Million), by Country 2024 & 2032
- Figure 4: North America AML Treatment Industry Volume (K Unit), by Country 2024 & 2032
- Figure 5: North America AML Treatment Industry Revenue Share (%), by Country 2024 & 2032
- Figure 6: North America AML Treatment Industry Volume Share (%), by Country 2024 & 2032
- Figure 7: Europe AML Treatment Industry Revenue (Million), by Country 2024 & 2032
- Figure 8: Europe AML Treatment Industry Volume (K Unit), by Country 2024 & 2032
- Figure 9: Europe AML Treatment Industry Revenue Share (%), by Country 2024 & 2032
- Figure 10: Europe AML Treatment Industry Volume Share (%), by Country 2024 & 2032
- Figure 11: Asia Pacific AML Treatment Industry Revenue (Million), by Country 2024 & 2032
- Figure 12: Asia Pacific AML Treatment Industry Volume (K Unit), by Country 2024 & 2032
- Figure 13: Asia Pacific AML Treatment Industry Revenue Share (%), by Country 2024 & 2032
- Figure 14: Asia Pacific AML Treatment Industry Volume Share (%), by Country 2024 & 2032
- Figure 15: South America AML Treatment Industry Revenue (Million), by Country 2024 & 2032
- Figure 16: South America AML Treatment Industry Volume (K Unit), by Country 2024 & 2032
- Figure 17: South America AML Treatment Industry Revenue Share (%), by Country 2024 & 2032
- Figure 18: South America AML Treatment Industry Volume Share (%), by Country 2024 & 2032
- Figure 19: North America AML Treatment Industry Revenue (Million), by Country 2024 & 2032
- Figure 20: North America AML Treatment Industry Volume (K Unit), by Country 2024 & 2032
- Figure 21: North America AML Treatment Industry Revenue Share (%), by Country 2024 & 2032
- Figure 22: North America AML Treatment Industry Volume Share (%), by Country 2024 & 2032
- Figure 23: MEA AML Treatment Industry Revenue (Million), by Country 2024 & 2032
- Figure 24: MEA AML Treatment Industry Volume (K Unit), by Country 2024 & 2032
- Figure 25: MEA AML Treatment Industry Revenue Share (%), by Country 2024 & 2032
- Figure 26: MEA AML Treatment Industry Volume Share (%), by Country 2024 & 2032
- Figure 27: China AML Treatment Industry Revenue (Million), by Therapy 2024 & 2032
- Figure 28: China AML Treatment Industry Volume (K Unit), by Therapy 2024 & 2032
- Figure 29: China AML Treatment Industry Revenue Share (%), by Therapy 2024 & 2032
- Figure 30: China AML Treatment Industry Volume Share (%), by Therapy 2024 & 2032
- Figure 31: China AML Treatment Industry Revenue (Million), by Geography 2024 & 2032
- Figure 32: China AML Treatment Industry Volume (K Unit), by Geography 2024 & 2032
- Figure 33: China AML Treatment Industry Revenue Share (%), by Geography 2024 & 2032
- Figure 34: China AML Treatment Industry Volume Share (%), by Geography 2024 & 2032
- Figure 35: China AML Treatment Industry Revenue (Million), by Country 2024 & 2032
- Figure 36: China AML Treatment Industry Volume (K Unit), by Country 2024 & 2032
- Figure 37: China AML Treatment Industry Revenue Share (%), by Country 2024 & 2032
- Figure 38: China AML Treatment Industry Volume Share (%), by Country 2024 & 2032
- Figure 39: Japan AML Treatment Industry Revenue (Million), by Therapy 2024 & 2032
- Figure 40: Japan AML Treatment Industry Volume (K Unit), by Therapy 2024 & 2032
- Figure 41: Japan AML Treatment Industry Revenue Share (%), by Therapy 2024 & 2032
- Figure 42: Japan AML Treatment Industry Volume Share (%), by Therapy 2024 & 2032
- Figure 43: Japan AML Treatment Industry Revenue (Million), by Geography 2024 & 2032
- Figure 44: Japan AML Treatment Industry Volume (K Unit), by Geography 2024 & 2032
- Figure 45: Japan AML Treatment Industry Revenue Share (%), by Geography 2024 & 2032
- Figure 46: Japan AML Treatment Industry Volume Share (%), by Geography 2024 & 2032
- Figure 47: Japan AML Treatment Industry Revenue (Million), by Country 2024 & 2032
- Figure 48: Japan AML Treatment Industry Volume (K Unit), by Country 2024 & 2032
- Figure 49: Japan AML Treatment Industry Revenue Share (%), by Country 2024 & 2032
- Figure 50: Japan AML Treatment Industry Volume Share (%), by Country 2024 & 2032
- Figure 51: India AML Treatment Industry Revenue (Million), by Therapy 2024 & 2032
- Figure 52: India AML Treatment Industry Volume (K Unit), by Therapy 2024 & 2032
- Figure 53: India AML Treatment Industry Revenue Share (%), by Therapy 2024 & 2032
- Figure 54: India AML Treatment Industry Volume Share (%), by Therapy 2024 & 2032
- Figure 55: India AML Treatment Industry Revenue (Million), by Geography 2024 & 2032
- Figure 56: India AML Treatment Industry Volume (K Unit), by Geography 2024 & 2032
- Figure 57: India AML Treatment Industry Revenue Share (%), by Geography 2024 & 2032
- Figure 58: India AML Treatment Industry Volume Share (%), by Geography 2024 & 2032
- Figure 59: India AML Treatment Industry Revenue (Million), by Country 2024 & 2032
- Figure 60: India AML Treatment Industry Volume (K Unit), by Country 2024 & 2032
- Figure 61: India AML Treatment Industry Revenue Share (%), by Country 2024 & 2032
- Figure 62: India AML Treatment Industry Volume Share (%), by Country 2024 & 2032
- Figure 63: Australia AML Treatment Industry Revenue (Million), by Therapy 2024 & 2032
- Figure 64: Australia AML Treatment Industry Volume (K Unit), by Therapy 2024 & 2032
- Figure 65: Australia AML Treatment Industry Revenue Share (%), by Therapy 2024 & 2032
- Figure 66: Australia AML Treatment Industry Volume Share (%), by Therapy 2024 & 2032
- Figure 67: Australia AML Treatment Industry Revenue (Million), by Geography 2024 & 2032
- Figure 68: Australia AML Treatment Industry Volume (K Unit), by Geography 2024 & 2032
- Figure 69: Australia AML Treatment Industry Revenue Share (%), by Geography 2024 & 2032
- Figure 70: Australia AML Treatment Industry Volume Share (%), by Geography 2024 & 2032
- Figure 71: Australia AML Treatment Industry Revenue (Million), by Country 2024 & 2032
- Figure 72: Australia AML Treatment Industry Volume (K Unit), by Country 2024 & 2032
- Figure 73: Australia AML Treatment Industry Revenue Share (%), by Country 2024 & 2032
- Figure 74: Australia AML Treatment Industry Volume Share (%), by Country 2024 & 2032
- Figure 75: South Korea AML Treatment Industry Revenue (Million), by Therapy 2024 & 2032
- Figure 76: South Korea AML Treatment Industry Volume (K Unit), by Therapy 2024 & 2032
- Figure 77: South Korea AML Treatment Industry Revenue Share (%), by Therapy 2024 & 2032
- Figure 78: South Korea AML Treatment Industry Volume Share (%), by Therapy 2024 & 2032
- Figure 79: South Korea AML Treatment Industry Revenue (Million), by Geography 2024 & 2032
- Figure 80: South Korea AML Treatment Industry Volume (K Unit), by Geography 2024 & 2032
- Figure 81: South Korea AML Treatment Industry Revenue Share (%), by Geography 2024 & 2032
- Figure 82: South Korea AML Treatment Industry Volume Share (%), by Geography 2024 & 2032
- Figure 83: South Korea AML Treatment Industry Revenue (Million), by Country 2024 & 2032
- Figure 84: South Korea AML Treatment Industry Volume (K Unit), by Country 2024 & 2032
- Figure 85: South Korea AML Treatment Industry Revenue Share (%), by Country 2024 & 2032
- Figure 86: South Korea AML Treatment Industry Volume Share (%), by Country 2024 & 2032
- Figure 87: Rest of Asia Pacific AML Treatment Industry Revenue (Million), by Therapy 2024 & 2032
- Figure 88: Rest of Asia Pacific AML Treatment Industry Volume (K Unit), by Therapy 2024 & 2032
- Figure 89: Rest of Asia Pacific AML Treatment Industry Revenue Share (%), by Therapy 2024 & 2032
- Figure 90: Rest of Asia Pacific AML Treatment Industry Volume Share (%), by Therapy 2024 & 2032
- Figure 91: Rest of Asia Pacific AML Treatment Industry Revenue (Million), by Geography 2024 & 2032
- Figure 92: Rest of Asia Pacific AML Treatment Industry Volume (K Unit), by Geography 2024 & 2032
- Figure 93: Rest of Asia Pacific AML Treatment Industry Revenue Share (%), by Geography 2024 & 2032
- Figure 94: Rest of Asia Pacific AML Treatment Industry Volume Share (%), by Geography 2024 & 2032
- Figure 95: Rest of Asia Pacific AML Treatment Industry Revenue (Million), by Country 2024 & 2032
- Figure 96: Rest of Asia Pacific AML Treatment Industry Volume (K Unit), by Country 2024 & 2032
- Figure 97: Rest of Asia Pacific AML Treatment Industry Revenue Share (%), by Country 2024 & 2032
- Figure 98: Rest of Asia Pacific AML Treatment Industry Volume Share (%), by Country 2024 & 2032
List of Tables
- Table 1: Global AML Treatment Industry Revenue Million Forecast, by Region 2019 & 2032
- Table 2: Global AML Treatment Industry Volume K Unit Forecast, by Region 2019 & 2032
- Table 3: Global AML Treatment Industry Revenue Million Forecast, by Therapy 2019 & 2032
- Table 4: Global AML Treatment Industry Volume K Unit Forecast, by Therapy 2019 & 2032
- Table 5: Global AML Treatment Industry Revenue Million Forecast, by Geography 2019 & 2032
- Table 6: Global AML Treatment Industry Volume K Unit Forecast, by Geography 2019 & 2032
- Table 7: Global AML Treatment Industry Revenue Million Forecast, by Region 2019 & 2032
- Table 8: Global AML Treatment Industry Volume K Unit Forecast, by Region 2019 & 2032
- Table 9: Global AML Treatment Industry Revenue Million Forecast, by Country 2019 & 2032
- Table 10: Global AML Treatment Industry Volume K Unit Forecast, by Country 2019 & 2032
- Table 11: Global AML Treatment Industry Revenue Million Forecast, by Country 2019 & 2032
- Table 12: Global AML Treatment Industry Volume K Unit Forecast, by Country 2019 & 2032
- Table 13: Global AML Treatment Industry Revenue Million Forecast, by Country 2019 & 2032
- Table 14: Global AML Treatment Industry Volume K Unit Forecast, by Country 2019 & 2032
- Table 15: Global AML Treatment Industry Revenue Million Forecast, by Country 2019 & 2032
- Table 16: Global AML Treatment Industry Volume K Unit Forecast, by Country 2019 & 2032
- Table 17: Global AML Treatment Industry Revenue Million Forecast, by Country 2019 & 2032
- Table 18: Global AML Treatment Industry Volume K Unit Forecast, by Country 2019 & 2032
- Table 19: Global AML Treatment Industry Revenue Million Forecast, by Country 2019 & 2032
- Table 20: Global AML Treatment Industry Volume K Unit Forecast, by Country 2019 & 2032
- Table 21: Global AML Treatment Industry Revenue Million Forecast, by Therapy 2019 & 2032
- Table 22: Global AML Treatment Industry Volume K Unit Forecast, by Therapy 2019 & 2032
- Table 23: Global AML Treatment Industry Revenue Million Forecast, by Geography 2019 & 2032
- Table 24: Global AML Treatment Industry Volume K Unit Forecast, by Geography 2019 & 2032
- Table 25: Global AML Treatment Industry Revenue Million Forecast, by Country 2019 & 2032
- Table 26: Global AML Treatment Industry Volume K Unit Forecast, by Country 2019 & 2032
- Table 27: Global AML Treatment Industry Revenue Million Forecast, by Therapy 2019 & 2032
- Table 28: Global AML Treatment Industry Volume K Unit Forecast, by Therapy 2019 & 2032
- Table 29: Global AML Treatment Industry Revenue Million Forecast, by Geography 2019 & 2032
- Table 30: Global AML Treatment Industry Volume K Unit Forecast, by Geography 2019 & 2032
- Table 31: Global AML Treatment Industry Revenue Million Forecast, by Country 2019 & 2032
- Table 32: Global AML Treatment Industry Volume K Unit Forecast, by Country 2019 & 2032
- Table 33: Global AML Treatment Industry Revenue Million Forecast, by Therapy 2019 & 2032
- Table 34: Global AML Treatment Industry Volume K Unit Forecast, by Therapy 2019 & 2032
- Table 35: Global AML Treatment Industry Revenue Million Forecast, by Geography 2019 & 2032
- Table 36: Global AML Treatment Industry Volume K Unit Forecast, by Geography 2019 & 2032
- Table 37: Global AML Treatment Industry Revenue Million Forecast, by Country 2019 & 2032
- Table 38: Global AML Treatment Industry Volume K Unit Forecast, by Country 2019 & 2032
- Table 39: Global AML Treatment Industry Revenue Million Forecast, by Therapy 2019 & 2032
- Table 40: Global AML Treatment Industry Volume K Unit Forecast, by Therapy 2019 & 2032
- Table 41: Global AML Treatment Industry Revenue Million Forecast, by Geography 2019 & 2032
- Table 42: Global AML Treatment Industry Volume K Unit Forecast, by Geography 2019 & 2032
- Table 43: Global AML Treatment Industry Revenue Million Forecast, by Country 2019 & 2032
- Table 44: Global AML Treatment Industry Volume K Unit Forecast, by Country 2019 & 2032
- Table 45: Global AML Treatment Industry Revenue Million Forecast, by Therapy 2019 & 2032
- Table 46: Global AML Treatment Industry Volume K Unit Forecast, by Therapy 2019 & 2032
- Table 47: Global AML Treatment Industry Revenue Million Forecast, by Geography 2019 & 2032
- Table 48: Global AML Treatment Industry Volume K Unit Forecast, by Geography 2019 & 2032
- Table 49: Global AML Treatment Industry Revenue Million Forecast, by Country 2019 & 2032
- Table 50: Global AML Treatment Industry Volume K Unit Forecast, by Country 2019 & 2032
- Table 51: Global AML Treatment Industry Revenue Million Forecast, by Therapy 2019 & 2032
- Table 52: Global AML Treatment Industry Volume K Unit Forecast, by Therapy 2019 & 2032
- Table 53: Global AML Treatment Industry Revenue Million Forecast, by Geography 2019 & 2032
- Table 54: Global AML Treatment Industry Volume K Unit Forecast, by Geography 2019 & 2032
- Table 55: Global AML Treatment Industry Revenue Million Forecast, by Country 2019 & 2032
- Table 56: Global AML Treatment Industry Volume K Unit Forecast, by Country 2019 & 2032
Frequently Asked Questions
1. What is the projected Compound Annual Growth Rate (CAGR) of the AML Treatment Industry?
The projected CAGR is approximately 6.46%.
2. Which companies are prominent players in the AML Treatment Industry?
Key companies in the market include Daiichi Sankyo Company Limited, Celgene Corporation, Novartis AG, Astellas Pharma Inc, Teva Pharmaceutical Industries Ltd, AbbVie Inc, Sun Pharmaceutical Industries Ltd, Fresenius SE & Co KGaA, Viatris (Mylan NV), Pfizer Inc.
3. What are the main segments of the AML Treatment Industry?
The market segments include Therapy, Geography.
4. Can you provide details about the market size?
The market size is estimated to be USD 338.96 Million as of 2022.
5. What are some drivers contributing to market growth?
High Incidence and Prevalence of Acute Myeloid Leukemia; Advancement in Pharmacology and Molecular Biology to Promote Drug Development.
6. What are the notable trends driving market growth?
The Chemotherapy Segment is Anticipated to Witness a Growth Over the Forecast Period.
7. Are there any restraints impacting market growth?
Complications Related to Chemotherapy.
8. Can you provide examples of recent developments in the market?
May 2024 : Nippon Shinyaku Co., Ltd. introduced Vyxeos Combination, an I.V. injection (comprising Daunorubicin hydrochloride and cytarabine in a liposomal formulation), specifically targeting high-risk acute myeloid leukemia (AML) patients in Japan.
9. What pricing options are available for accessing the report?
Pricing options include single-user, multi-user, and enterprise licenses priced at USD 4750, USD 5250, and USD 8750 respectively.
10. Is the market size provided in terms of value or volume?
The market size is provided in terms of value, measured in Million and volume, measured in K Unit.
11. Are there any specific market keywords associated with the report?
Yes, the market keyword associated with the report is "AML Treatment Industry," which aids in identifying and referencing the specific market segment covered.
12. How do I determine which pricing option suits my needs best?
The pricing options vary based on user requirements and access needs. Individual users may opt for single-user licenses, while businesses requiring broader access may choose multi-user or enterprise licenses for cost-effective access to the report.
13. Are there any additional resources or data provided in the AML Treatment Industry report?
While the report offers comprehensive insights, it's advisable to review the specific contents or supplementary materials provided to ascertain if additional resources or data are available.
14. How can I stay updated on further developments or reports in the AML Treatment Industry?
To stay informed about further developments, trends, and reports in the AML Treatment Industry, consider subscribing to industry newsletters, following relevant companies and organizations, or regularly checking reputable industry news sources and publications.
Methodology
Step 1 - Identification of Relevant Samples Size from Population Database


Step 2 - Approaches for Defining Global Market Size (Value, Volume* & Price*)

Note*: In applicable scenarios
Step 3 - Data Sources
Primary Research
- Web Analytics
- Survey Reports
- Research Institute
- Latest Research Reports
- Opinion Leaders
Secondary Research
- Annual Reports
- White Paper
- Latest Press Release
- Industry Association
- Paid Database
- Investor Presentations

Step 4 - Data Triangulation
Involves using different sources of information in order to increase the validity of a study
These sources are likely to be stakeholders in a program - participants, other researchers, program staff, other community members, and so on.
Then we put all data in single framework & apply various statistical tools to find out the dynamic on the market.
During the analysis stage, feedback from the stakeholder groups would be compared to determine areas of agreement as well as areas of divergence
