

Key Insights
The global blood pressure (BP) monitoring device market is experiencing robust growth, projected to reach a substantial size driven by several key factors. The market's Compound Annual Growth Rate (CAGR) of 10.32% from 2019 to 2024 indicates a significant upward trajectory, fueled by increasing prevalence of hypertension globally, rising geriatric population, and growing awareness about cardiovascular health. Technological advancements, such as the development of more accurate, user-friendly, and connected digital BP monitors, are further stimulating market expansion. The home setting segment is experiencing particularly strong growth due to increased preference for self-monitoring and remote patient monitoring initiatives. While the market is fragmented, with various players like Omron, Philips, and others competing, opportunities exist for companies offering innovative features like smartphone integration, AI-powered analysis, and improved data management capabilities. The market is segmented by product type (sphygmomanometers, automated/digital monitors), and end-user (hospitals, ambulatory surgical centers, home settings), offering a diverse landscape for businesses. North America and Europe currently dominate the market, but significant growth potential exists in Asia-Pacific and other emerging regions.
The market's future trajectory is influenced by several factors. Increased adoption of telehealth and remote patient monitoring programs is expected to drive demand for connected BP monitoring devices. Regulatory changes impacting healthcare technology and reimbursement policies also play a crucial role in shaping market dynamics. Continued advancements in sensor technology, miniaturization, and improved data analytics will further refine product offerings. The competitive landscape will remain dynamic, with ongoing innovation and strategic partnerships influencing market share. Companies are focusing on strategic alliances, product diversification, and expansion into new geographies to maintain a competitive edge in this growing market. Challenges like high costs associated with certain advanced devices and the need for improved patient education about accurate BP measurement need to be addressed. However, the overall market outlook remains positive, indicating a continued upward trend throughout the forecast period.
Dynamic Report: BP Monitoring Device Industry - Market Analysis & Forecast (2019-2033)
This comprehensive report provides a detailed analysis of the global BP Monitoring Device industry, covering market size, growth drivers, competitive landscape, and future outlook. With a study period spanning 2019-2033, a base year of 2025, and a forecast period of 2025-2033, this report is an essential resource for industry stakeholders seeking actionable insights. The report leverages extensive data analysis to offer a 360-degree view of the market, providing valuable information for strategic decision-making. The market value is projected to reach xx Million by 2033.
BP Monitoring Device Industry Market Structure & Competitive Landscape
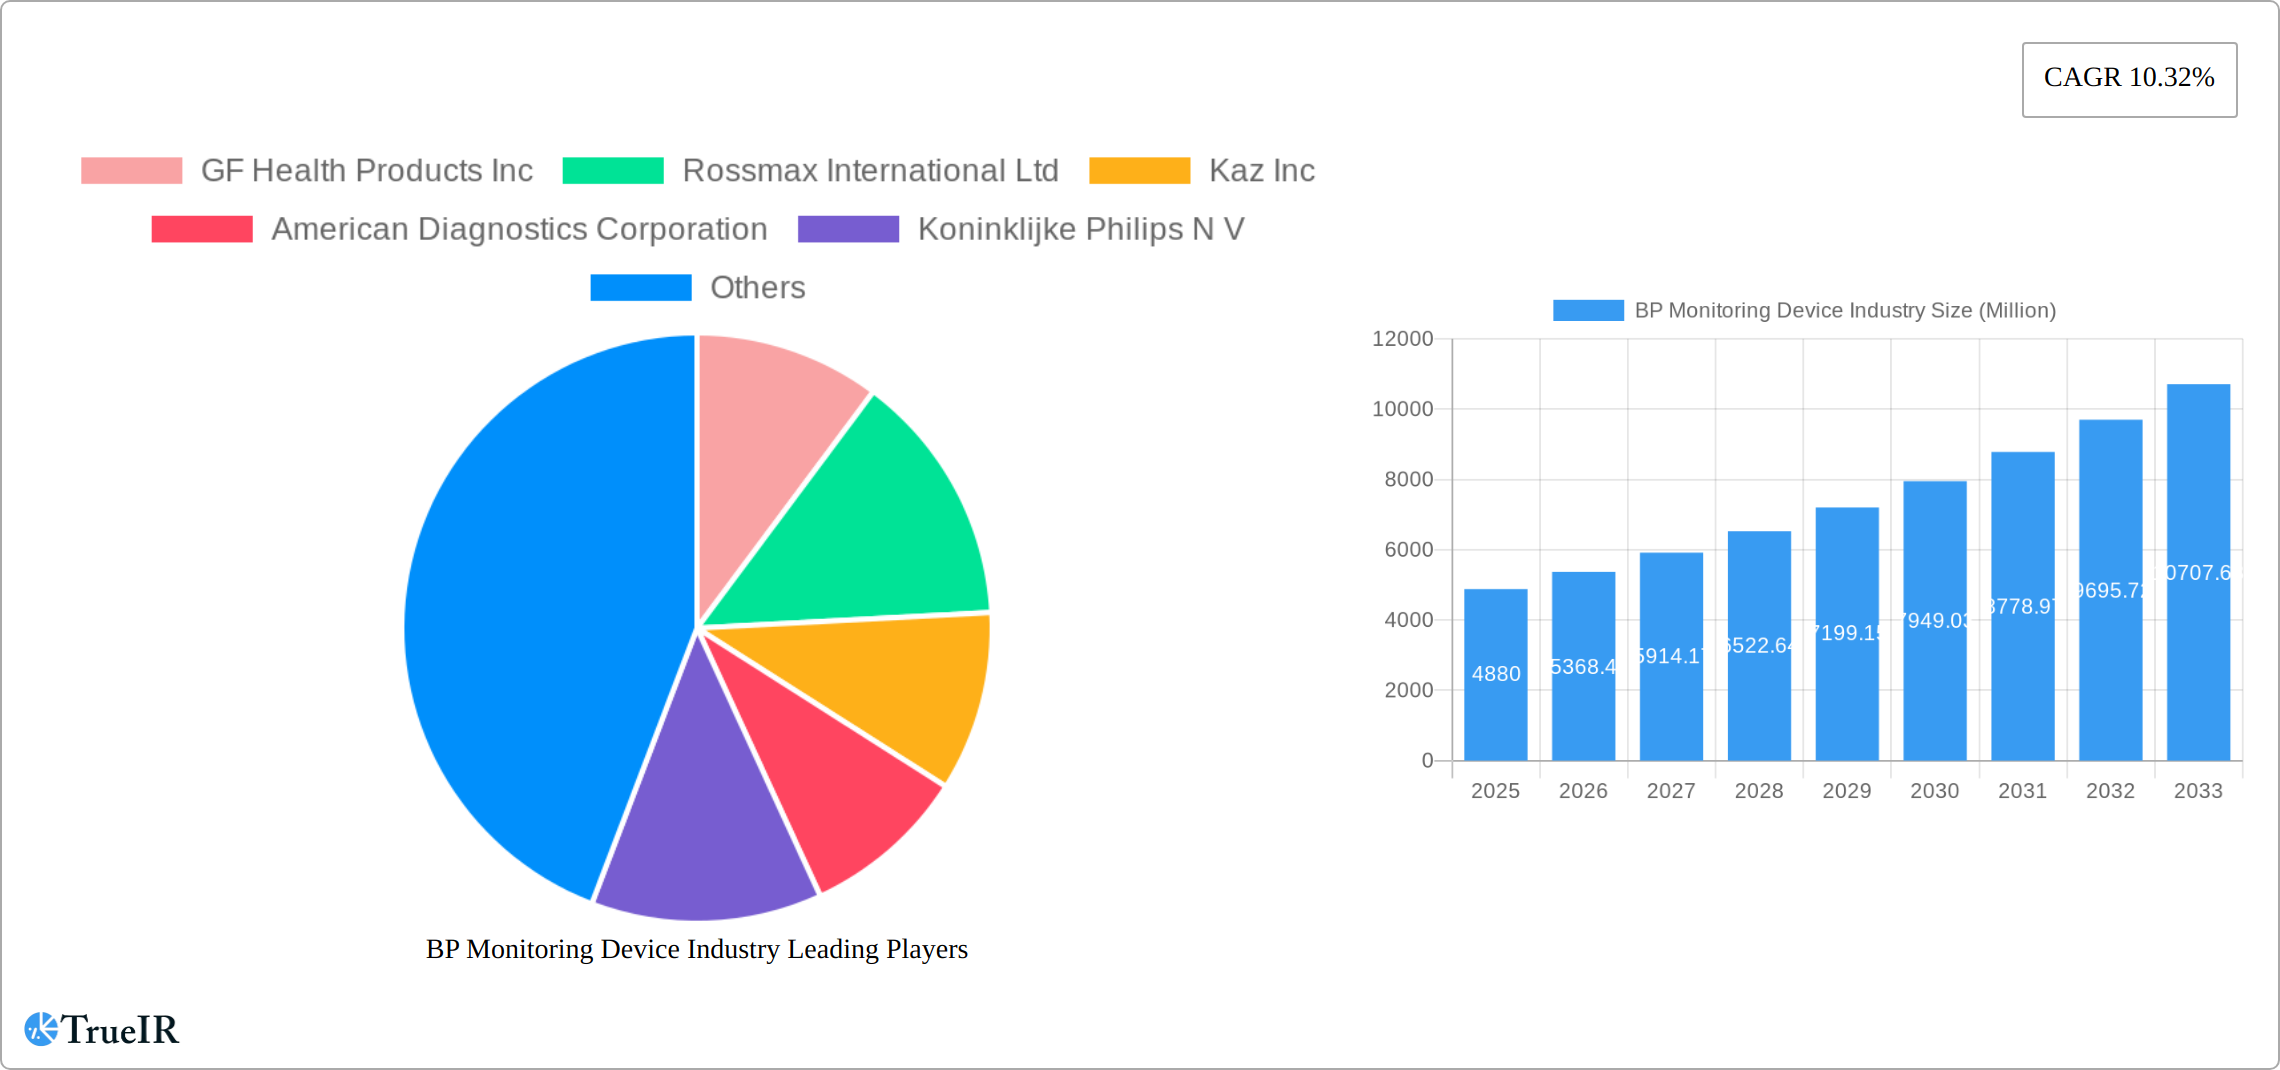
The global BP Monitoring Device market is moderately concentrated, with several key players holding significant market share. The industry witnesses consistent innovation driven by technological advancements, increasing prevalence of hypertension, and a rising demand for convenient and accurate home-based monitoring solutions. Regulatory frameworks, varying across regions, significantly impact market dynamics and product approvals. Substitute products, such as smartphone apps with BP monitoring capabilities, are emerging but haven't yet significantly disrupted the market. The end-user segment is diverse, encompassing hospitals and clinics, ambulatory surgical centers, and the rapidly growing home setting segment. The industry has seen a moderate level of M&A activity in recent years, with xx Million in deals recorded in the historical period (2019-2024), indicating a trend towards consolidation and expansion. Concentration ratios, such as the Herfindahl-Hirschman Index (HHI), will be calculated and analyzed to provide a deeper understanding of the market structure. This will include a detailed examination of the competitive strategies employed by key players such as GF Health Products Inc, Rossmax International Ltd, Kaz Inc, American Diagnostics Corporation, Koninklijke Philips N V, Withings, A&D Medical Inc, Microlife AG, General Electric Company (GE Healthcare), and Omron Healthcare Inc, among others. The report further investigates the impact of these activities on market competition, product diversification and overall market growth.
BP Monitoring Device Industry Market Trends & Opportunities
The global BP Monitoring Device market exhibits a robust growth trajectory, with a projected Compound Annual Growth Rate (CAGR) of xx% during the forecast period (2025-2033). This growth is fueled by several key factors, including the rising prevalence of hypertension globally, increasing healthcare expenditure, and growing awareness regarding the importance of regular blood pressure monitoring. Technological advancements, such as the development of wireless and connected devices, are transforming the market, enabling remote patient monitoring and enhanced data management capabilities. Consumer preferences are shifting towards user-friendly, accurate, and portable devices, driving demand for automated and digital blood pressure monitors. The market penetration rate for automated BP monitors is steadily increasing, particularly in developed regions. Competitive dynamics are shaped by product innovation, pricing strategies, and strategic partnerships. The report will delve deep into these trends, analyzing the growth of each segment (e.g., home setting, hospital setting) and providing insights into the market share of key players. Furthermore, it will analyze potential opportunities for new entrants and expansion strategies for existing players.

Dominant Markets & Segments in BP Monitoring Device Industry
The North American region currently holds the largest market share for BP monitoring devices, followed by Europe. Within the product segment, automated/digital blood pressure monitors represent the largest and fastest-growing segment due to their ease of use, accuracy, and data storage capabilities. The home setting is the most dominant end-user segment.
Key Growth Drivers:
- Rising Prevalence of Hypertension: The global increase in hypertension cases is a primary driver.
- Technological Advancements: Innovative features like wireless connectivity and data analysis are boosting market growth.
- Increasing Healthcare Expenditure: Increased healthcare spending globally fuels demand for advanced medical devices.
- Government Initiatives: Public health programs focusing on hypertension management create favorable market conditions.
- Growing Preference for Home-based Monitoring: Convenience and cost-effectiveness drive demand for home use devices.
Detailed Analysis of Market Dominance: This section provides a granular analysis of regional and segmental market dominance, factoring in socioeconomic factors, healthcare infrastructure development, and government regulations. The influence of healthcare policies and reimbursement schemes on market dynamics will be thoroughly explored. Detailed market share breakdowns for each segment and region will be included.
BP Monitoring Device Industry Product Analysis
Technological advancements in BP monitoring devices are focused on improving accuracy, portability, and user experience. Automated digital monitors dominate the market, offering features like irregular heartbeat detection and average readings. The integration of smartphone connectivity and cloud-based data storage enables remote patient monitoring and better management of hypertension. This improved data management and connectivity enhances patient care and provides valuable insights to healthcare professionals. The market is also witnessing the introduction of wrist-based and wearable BP monitors. These innovations cater to diverse patient needs and preferences, shaping the competitive landscape.
Key Drivers, Barriers & Challenges in BP Monitoring Device Industry
Key Drivers:
- Technological advancements (e.g., wearable sensors, AI-powered diagnostics).
- Rising prevalence of cardiovascular diseases and hypertension.
- Growing demand for home-based healthcare solutions.
- Favorable regulatory environments in several regions.
Challenges and Restraints:
- Stringent regulatory approvals and compliance requirements can hinder market entry.
- Supply chain disruptions, particularly related to component sourcing, can impact production and pricing.
- Intense competition among established players and emerging companies pressures profit margins. The xx Million in M&A activity over the past years suggests consolidation and fierce rivalry.
Growth Drivers in the BP Monitoring Device Industry Market
The key drivers for growth in the BP monitoring device market include the increasing prevalence of hypertension, technological advancements leading to more accurate and user-friendly devices, and a growing preference for home-based healthcare solutions. Government initiatives promoting preventive healthcare and early disease detection also contribute significantly. Furthermore, rising disposable incomes and improved healthcare infrastructure in developing countries are expanding the market.
Challenges Impacting BP Monitoring Device Industry Growth
Challenges facing the industry include the high cost of advanced devices, stringent regulatory requirements for device approval and market entry, and intense competition among established players. Supply chain disruptions caused by geopolitical factors or pandemics pose risks to manufacturers, potentially affecting the availability and cost of devices.
Key Players Shaping the BP Monitoring Device Industry Market
- GF Health Products Inc
- Rossmax International Ltd
- Kaz Inc
- American Diagnostics Corporation
- Koninklijke Philips N V
- Withings
- A&D Medical Inc
- Microlife AG
- General Electric Company (GE Healthcare)
- Omron Healthcare Inc
Significant BP Monitoring Device Industry Milestones
- May 2021: Biobeat launched a new wearable, continuous ambulatory blood pressure monitoring (ABPM) chest-monitoring device, expanding the market for continuous monitoring.
- January 2020: SunTech Medical Inc. announced a collaboration to develop new blood pressure measurement solutions, potentially improving patient safety and market offerings.
Future Outlook for BP Monitoring Device Industry Market
The BP Monitoring Device industry is poised for continued growth, driven by technological innovation, increasing prevalence of hypertension, and rising demand for home-based healthcare solutions. Opportunities exist for companies to develop and market innovative devices with enhanced accuracy, connectivity, and user-friendliness. The integration of AI and machine learning offers significant potential for improving diagnostics and personalized healthcare. The market will see increased adoption of remote patient monitoring systems, impacting healthcare delivery and patient outcomes. This report offers valuable insights to guide strategic decision-making and capitalize on emerging opportunities.
BP Monitoring Device Industry Segmentation
-
1. Product
- 1.1. Sphygmomanometer/Aneroid BP Monitor
-
1.2. Automated/Digital Blood Pressure Monitor
- 1.2.1. Portable (Wrist, Upper Arm, Finger)
- 1.2.2. Non-Portable (Upper Arm)
- 1.3. Instrument Accessories
-
2. End User
- 2.1. Hospitals and Clinics
- 2.2. Ambulatory Surgical Centers
- 2.3. Home Setting
BP Monitoring Device Industry Segmentation By Geography
-
1. North America
- 1.1. United States
- 1.2. Canada
- 1.3. Mexico
-
2. Europe
- 2.1. Germany
- 2.2. United Kingdom
- 2.3. France
- 2.4. Italy
- 2.5. Spain
- 2.6. Rest of Europe
-
3. Asia Pacific
- 3.1. China
- 3.2. Japan
- 3.3. India
- 3.4. Australia
- 3.5. South Korea
- 3.6. Rest of Asia Pacific
-
4. Middle East and Africa
- 4.1. GCC
- 4.2. South Africa
- 4.3. Rest of Middle East and Africa
-
5. South America
- 5.1. Brazil
- 5.2. Argentina
- 5.3. Rest of South America

BP Monitoring Device Industry REPORT HIGHLIGHTS
| Aspects | Details |
|---|---|
| Study Period | 2019-2033 |
| Base Year | 2024 |
| Estimated Year | 2025 |
| Forecast Period | 2025-2033 |
| Historical Period | 2019-2024 |
| Growth Rate | CAGR of 10.32% from 2019-2033 |
| Segmentation |
|
Table of Contents
- 1. Introduction
- 1.1. Research Scope
- 1.2. Market Segmentation
- 1.3. Research Methodology
- 1.4. Definitions and Assumptions
- 2. Executive Summary
- 2.1. Introduction
- 3. Market Dynamics
- 3.1. Introduction
- 3.2. Market Drivers
- 3.2.1. Surging Burden of Cardiovascular Disorders; Technological Advancements
- 3.3. Market Restrains
- 3.3.1. Excessive Cost for Technological Developments
- 3.4. Market Trends
- 3.4.1. Automated/Digital Blood Pressure Monitor is Expected to Witness a Growth Over the Forecast Period
- 4. Market Factor Analysis
- 4.1. Porters Five Forces
- 4.2. Supply/Value Chain
- 4.3. PESTEL analysis
- 4.4. Market Entropy
- 4.5. Patent/Trademark Analysis
- 5. Global BP Monitoring Device Industry Analysis, Insights and Forecast, 2019-2031
- 5.1. Market Analysis, Insights and Forecast - by Product
- 5.1.1. Sphygmomanometer/Aneroid BP Monitor
- 5.1.2. Automated/Digital Blood Pressure Monitor
- 5.1.2.1. Portable (Wrist, Upper Arm, Finger)
- 5.1.2.2. Non-Portable (Upper Arm)
- 5.1.3. Instrument Accessories
- 5.2. Market Analysis, Insights and Forecast - by End User
- 5.2.1. Hospitals and Clinics
- 5.2.2. Ambulatory Surgical Centers
- 5.2.3. Home Setting
- 5.3. Market Analysis, Insights and Forecast - by Region
- 5.3.1. North America
- 5.3.2. Europe
- 5.3.3. Asia Pacific
- 5.3.4. Middle East and Africa
- 5.3.5. South America
- 5.1. Market Analysis, Insights and Forecast - by Product
- 6. North America BP Monitoring Device Industry Analysis, Insights and Forecast, 2019-2031
- 6.1. Market Analysis, Insights and Forecast - by Product
- 6.1.1. Sphygmomanometer/Aneroid BP Monitor
- 6.1.2. Automated/Digital Blood Pressure Monitor
- 6.1.2.1. Portable (Wrist, Upper Arm, Finger)
- 6.1.2.2. Non-Portable (Upper Arm)
- 6.1.3. Instrument Accessories
- 6.2. Market Analysis, Insights and Forecast - by End User
- 6.2.1. Hospitals and Clinics
- 6.2.2. Ambulatory Surgical Centers
- 6.2.3. Home Setting
- 6.1. Market Analysis, Insights and Forecast - by Product
- 7. Europe BP Monitoring Device Industry Analysis, Insights and Forecast, 2019-2031
- 7.1. Market Analysis, Insights and Forecast - by Product
- 7.1.1. Sphygmomanometer/Aneroid BP Monitor
- 7.1.2. Automated/Digital Blood Pressure Monitor
- 7.1.2.1. Portable (Wrist, Upper Arm, Finger)
- 7.1.2.2. Non-Portable (Upper Arm)
- 7.1.3. Instrument Accessories
- 7.2. Market Analysis, Insights and Forecast - by End User
- 7.2.1. Hospitals and Clinics
- 7.2.2. Ambulatory Surgical Centers
- 7.2.3. Home Setting
- 7.1. Market Analysis, Insights and Forecast - by Product
- 8. Asia Pacific BP Monitoring Device Industry Analysis, Insights and Forecast, 2019-2031
- 8.1. Market Analysis, Insights and Forecast - by Product
- 8.1.1. Sphygmomanometer/Aneroid BP Monitor
- 8.1.2. Automated/Digital Blood Pressure Monitor
- 8.1.2.1. Portable (Wrist, Upper Arm, Finger)
- 8.1.2.2. Non-Portable (Upper Arm)
- 8.1.3. Instrument Accessories
- 8.2. Market Analysis, Insights and Forecast - by End User
- 8.2.1. Hospitals and Clinics
- 8.2.2. Ambulatory Surgical Centers
- 8.2.3. Home Setting
- 8.1. Market Analysis, Insights and Forecast - by Product
- 9. Middle East and Africa BP Monitoring Device Industry Analysis, Insights and Forecast, 2019-2031
- 9.1. Market Analysis, Insights and Forecast - by Product
- 9.1.1. Sphygmomanometer/Aneroid BP Monitor
- 9.1.2. Automated/Digital Blood Pressure Monitor
- 9.1.2.1. Portable (Wrist, Upper Arm, Finger)
- 9.1.2.2. Non-Portable (Upper Arm)
- 9.1.3. Instrument Accessories
- 9.2. Market Analysis, Insights and Forecast - by End User
- 9.2.1. Hospitals and Clinics
- 9.2.2. Ambulatory Surgical Centers
- 9.2.3. Home Setting
- 9.1. Market Analysis, Insights and Forecast - by Product
- 10. South America BP Monitoring Device Industry Analysis, Insights and Forecast, 2019-2031
- 10.1. Market Analysis, Insights and Forecast - by Product
- 10.1.1. Sphygmomanometer/Aneroid BP Monitor
- 10.1.2. Automated/Digital Blood Pressure Monitor
- 10.1.2.1. Portable (Wrist, Upper Arm, Finger)
- 10.1.2.2. Non-Portable (Upper Arm)
- 10.1.3. Instrument Accessories
- 10.2. Market Analysis, Insights and Forecast - by End User
- 10.2.1. Hospitals and Clinics
- 10.2.2. Ambulatory Surgical Centers
- 10.2.3. Home Setting
- 10.1. Market Analysis, Insights and Forecast - by Product
- 11. North America BP Monitoring Device Industry Analysis, Insights and Forecast, 2019-2031
- 11.1. Market Analysis, Insights and Forecast - By Country/Sub-region
- 11.1.1 United States
- 11.1.2 Canada
- 11.1.3 Mexico
- 12. South America BP Monitoring Device Industry Analysis, Insights and Forecast, 2019-2031
- 12.1. Market Analysis, Insights and Forecast - By Country/Sub-region
- 12.1.1 Brazil
- 12.1.2 Mexico
- 12.1.3 Rest of South America
- 13. Europe BP Monitoring Device Industry Analysis, Insights and Forecast, 2019-2031
- 13.1. Market Analysis, Insights and Forecast - By Country/Sub-region
- 13.1.1 United Kingdom
- 13.1.2 Germany
- 13.1.3 France
- 13.1.4 Italy
- 13.1.5 Spain
- 13.1.6 Russia
- 13.1.7 Rest of Europe
- 14. Asia Pacific BP Monitoring Device Industry Analysis, Insights and Forecast, 2019-2031
- 14.1. Market Analysis, Insights and Forecast - By Country/Sub-region
- 14.1.1 China
- 14.1.2 Japan
- 14.1.3 India
- 14.1.4 South Korea
- 14.1.5 Taiwan
- 14.1.6 Australia
- 14.1.7 Rest of Asia-Pacific
- 15. MEA BP Monitoring Device Industry Analysis, Insights and Forecast, 2019-2031
- 15.1. Market Analysis, Insights and Forecast - By Country/Sub-region
- 15.1.1 Middle East
- 15.1.2 Africa
- 16. Competitive Analysis
- 16.1. Global Market Share Analysis 2024
- 16.2. Company Profiles
- 16.2.1 GF Health Products Inc
- 16.2.1.1. Overview
- 16.2.1.2. Products
- 16.2.1.3. SWOT Analysis
- 16.2.1.4. Recent Developments
- 16.2.1.5. Financials (Based on Availability)
- 16.2.2 Rossmax International Ltd
- 16.2.2.1. Overview
- 16.2.2.2. Products
- 16.2.2.3. SWOT Analysis
- 16.2.2.4. Recent Developments
- 16.2.2.5. Financials (Based on Availability)
- 16.2.3 Kaz Inc
- 16.2.3.1. Overview
- 16.2.3.2. Products
- 16.2.3.3. SWOT Analysis
- 16.2.3.4. Recent Developments
- 16.2.3.5. Financials (Based on Availability)
- 16.2.4 American Diagnostics Corporation
- 16.2.4.1. Overview
- 16.2.4.2. Products
- 16.2.4.3. SWOT Analysis
- 16.2.4.4. Recent Developments
- 16.2.4.5. Financials (Based on Availability)
- 16.2.5 Koninklijke Philips N V
- 16.2.5.1. Overview
- 16.2.5.2. Products
- 16.2.5.3. SWOT Analysis
- 16.2.5.4. Recent Developments
- 16.2.5.5. Financials (Based on Availability)
- 16.2.6 Withings*List Not Exhaustive
- 16.2.6.1. Overview
- 16.2.6.2. Products
- 16.2.6.3. SWOT Analysis
- 16.2.6.4. Recent Developments
- 16.2.6.5. Financials (Based on Availability)
- 16.2.7 A&D Medical Inc
- 16.2.7.1. Overview
- 16.2.7.2. Products
- 16.2.7.3. SWOT Analysis
- 16.2.7.4. Recent Developments
- 16.2.7.5. Financials (Based on Availability)
- 16.2.8 Microlife AG
- 16.2.8.1. Overview
- 16.2.8.2. Products
- 16.2.8.3. SWOT Analysis
- 16.2.8.4. Recent Developments
- 16.2.8.5. Financials (Based on Availability)
- 16.2.9 General Electric Company (GE Healthcare)
- 16.2.9.1. Overview
- 16.2.9.2. Products
- 16.2.9.3. SWOT Analysis
- 16.2.9.4. Recent Developments
- 16.2.9.5. Financials (Based on Availability)
- 16.2.10 Omron Healthcare Inc
- 16.2.10.1. Overview
- 16.2.10.2. Products
- 16.2.10.3. SWOT Analysis
- 16.2.10.4. Recent Developments
- 16.2.10.5. Financials (Based on Availability)
- 16.2.1 GF Health Products Inc
List of Figures
- Figure 1: Global BP Monitoring Device Industry Revenue Breakdown (Million, %) by Region 2024 & 2032
- Figure 2: Global BP Monitoring Device Industry Volume Breakdown (K Units, %) by Region 2024 & 2032
- Figure 3: North America BP Monitoring Device Industry Revenue (Million), by Country 2024 & 2032
- Figure 4: North America BP Monitoring Device Industry Volume (K Units), by Country 2024 & 2032
- Figure 5: North America BP Monitoring Device Industry Revenue Share (%), by Country 2024 & 2032
- Figure 6: North America BP Monitoring Device Industry Volume Share (%), by Country 2024 & 2032
- Figure 7: South America BP Monitoring Device Industry Revenue (Million), by Country 2024 & 2032
- Figure 8: South America BP Monitoring Device Industry Volume (K Units), by Country 2024 & 2032
- Figure 9: South America BP Monitoring Device Industry Revenue Share (%), by Country 2024 & 2032
- Figure 10: South America BP Monitoring Device Industry Volume Share (%), by Country 2024 & 2032
- Figure 11: Europe BP Monitoring Device Industry Revenue (Million), by Country 2024 & 2032
- Figure 12: Europe BP Monitoring Device Industry Volume (K Units), by Country 2024 & 2032
- Figure 13: Europe BP Monitoring Device Industry Revenue Share (%), by Country 2024 & 2032
- Figure 14: Europe BP Monitoring Device Industry Volume Share (%), by Country 2024 & 2032
- Figure 15: Asia Pacific BP Monitoring Device Industry Revenue (Million), by Country 2024 & 2032
- Figure 16: Asia Pacific BP Monitoring Device Industry Volume (K Units), by Country 2024 & 2032
- Figure 17: Asia Pacific BP Monitoring Device Industry Revenue Share (%), by Country 2024 & 2032
- Figure 18: Asia Pacific BP Monitoring Device Industry Volume Share (%), by Country 2024 & 2032
- Figure 19: MEA BP Monitoring Device Industry Revenue (Million), by Country 2024 & 2032
- Figure 20: MEA BP Monitoring Device Industry Volume (K Units), by Country 2024 & 2032
- Figure 21: MEA BP Monitoring Device Industry Revenue Share (%), by Country 2024 & 2032
- Figure 22: MEA BP Monitoring Device Industry Volume Share (%), by Country 2024 & 2032
- Figure 23: North America BP Monitoring Device Industry Revenue (Million), by Product 2024 & 2032
- Figure 24: North America BP Monitoring Device Industry Volume (K Units), by Product 2024 & 2032
- Figure 25: North America BP Monitoring Device Industry Revenue Share (%), by Product 2024 & 2032
- Figure 26: North America BP Monitoring Device Industry Volume Share (%), by Product 2024 & 2032
- Figure 27: North America BP Monitoring Device Industry Revenue (Million), by End User 2024 & 2032
- Figure 28: North America BP Monitoring Device Industry Volume (K Units), by End User 2024 & 2032
- Figure 29: North America BP Monitoring Device Industry Revenue Share (%), by End User 2024 & 2032
- Figure 30: North America BP Monitoring Device Industry Volume Share (%), by End User 2024 & 2032
- Figure 31: North America BP Monitoring Device Industry Revenue (Million), by Country 2024 & 2032
- Figure 32: North America BP Monitoring Device Industry Volume (K Units), by Country 2024 & 2032
- Figure 33: North America BP Monitoring Device Industry Revenue Share (%), by Country 2024 & 2032
- Figure 34: North America BP Monitoring Device Industry Volume Share (%), by Country 2024 & 2032
- Figure 35: Europe BP Monitoring Device Industry Revenue (Million), by Product 2024 & 2032
- Figure 36: Europe BP Monitoring Device Industry Volume (K Units), by Product 2024 & 2032
- Figure 37: Europe BP Monitoring Device Industry Revenue Share (%), by Product 2024 & 2032
- Figure 38: Europe BP Monitoring Device Industry Volume Share (%), by Product 2024 & 2032
- Figure 39: Europe BP Monitoring Device Industry Revenue (Million), by End User 2024 & 2032
- Figure 40: Europe BP Monitoring Device Industry Volume (K Units), by End User 2024 & 2032
- Figure 41: Europe BP Monitoring Device Industry Revenue Share (%), by End User 2024 & 2032
- Figure 42: Europe BP Monitoring Device Industry Volume Share (%), by End User 2024 & 2032
- Figure 43: Europe BP Monitoring Device Industry Revenue (Million), by Country 2024 & 2032
- Figure 44: Europe BP Monitoring Device Industry Volume (K Units), by Country 2024 & 2032
- Figure 45: Europe BP Monitoring Device Industry Revenue Share (%), by Country 2024 & 2032
- Figure 46: Europe BP Monitoring Device Industry Volume Share (%), by Country 2024 & 2032
- Figure 47: Asia Pacific BP Monitoring Device Industry Revenue (Million), by Product 2024 & 2032
- Figure 48: Asia Pacific BP Monitoring Device Industry Volume (K Units), by Product 2024 & 2032
- Figure 49: Asia Pacific BP Monitoring Device Industry Revenue Share (%), by Product 2024 & 2032
- Figure 50: Asia Pacific BP Monitoring Device Industry Volume Share (%), by Product 2024 & 2032
- Figure 51: Asia Pacific BP Monitoring Device Industry Revenue (Million), by End User 2024 & 2032
- Figure 52: Asia Pacific BP Monitoring Device Industry Volume (K Units), by End User 2024 & 2032
- Figure 53: Asia Pacific BP Monitoring Device Industry Revenue Share (%), by End User 2024 & 2032
- Figure 54: Asia Pacific BP Monitoring Device Industry Volume Share (%), by End User 2024 & 2032
- Figure 55: Asia Pacific BP Monitoring Device Industry Revenue (Million), by Country 2024 & 2032
- Figure 56: Asia Pacific BP Monitoring Device Industry Volume (K Units), by Country 2024 & 2032
- Figure 57: Asia Pacific BP Monitoring Device Industry Revenue Share (%), by Country 2024 & 2032
- Figure 58: Asia Pacific BP Monitoring Device Industry Volume Share (%), by Country 2024 & 2032
- Figure 59: Middle East and Africa BP Monitoring Device Industry Revenue (Million), by Product 2024 & 2032
- Figure 60: Middle East and Africa BP Monitoring Device Industry Volume (K Units), by Product 2024 & 2032
- Figure 61: Middle East and Africa BP Monitoring Device Industry Revenue Share (%), by Product 2024 & 2032
- Figure 62: Middle East and Africa BP Monitoring Device Industry Volume Share (%), by Product 2024 & 2032
- Figure 63: Middle East and Africa BP Monitoring Device Industry Revenue (Million), by End User 2024 & 2032
- Figure 64: Middle East and Africa BP Monitoring Device Industry Volume (K Units), by End User 2024 & 2032
- Figure 65: Middle East and Africa BP Monitoring Device Industry Revenue Share (%), by End User 2024 & 2032
- Figure 66: Middle East and Africa BP Monitoring Device Industry Volume Share (%), by End User 2024 & 2032
- Figure 67: Middle East and Africa BP Monitoring Device Industry Revenue (Million), by Country 2024 & 2032
- Figure 68: Middle East and Africa BP Monitoring Device Industry Volume (K Units), by Country 2024 & 2032
- Figure 69: Middle East and Africa BP Monitoring Device Industry Revenue Share (%), by Country 2024 & 2032
- Figure 70: Middle East and Africa BP Monitoring Device Industry Volume Share (%), by Country 2024 & 2032
- Figure 71: South America BP Monitoring Device Industry Revenue (Million), by Product 2024 & 2032
- Figure 72: South America BP Monitoring Device Industry Volume (K Units), by Product 2024 & 2032
- Figure 73: South America BP Monitoring Device Industry Revenue Share (%), by Product 2024 & 2032
- Figure 74: South America BP Monitoring Device Industry Volume Share (%), by Product 2024 & 2032
- Figure 75: South America BP Monitoring Device Industry Revenue (Million), by End User 2024 & 2032
- Figure 76: South America BP Monitoring Device Industry Volume (K Units), by End User 2024 & 2032
- Figure 77: South America BP Monitoring Device Industry Revenue Share (%), by End User 2024 & 2032
- Figure 78: South America BP Monitoring Device Industry Volume Share (%), by End User 2024 & 2032
- Figure 79: South America BP Monitoring Device Industry Revenue (Million), by Country 2024 & 2032
- Figure 80: South America BP Monitoring Device Industry Volume (K Units), by Country 2024 & 2032
- Figure 81: South America BP Monitoring Device Industry Revenue Share (%), by Country 2024 & 2032
- Figure 82: South America BP Monitoring Device Industry Volume Share (%), by Country 2024 & 2032
List of Tables
- Table 1: Global BP Monitoring Device Industry Revenue Million Forecast, by Region 2019 & 2032
- Table 2: Global BP Monitoring Device Industry Volume K Units Forecast, by Region 2019 & 2032
- Table 3: Global BP Monitoring Device Industry Revenue Million Forecast, by Product 2019 & 2032
- Table 4: Global BP Monitoring Device Industry Volume K Units Forecast, by Product 2019 & 2032
- Table 5: Global BP Monitoring Device Industry Revenue Million Forecast, by End User 2019 & 2032
- Table 6: Global BP Monitoring Device Industry Volume K Units Forecast, by End User 2019 & 2032
- Table 7: Global BP Monitoring Device Industry Revenue Million Forecast, by Region 2019 & 2032
- Table 8: Global BP Monitoring Device Industry Volume K Units Forecast, by Region 2019 & 2032
- Table 9: Global BP Monitoring Device Industry Revenue Million Forecast, by Country 2019 & 2032
- Table 10: Global BP Monitoring Device Industry Volume K Units Forecast, by Country 2019 & 2032
- Table 11: United States BP Monitoring Device Industry Revenue (Million) Forecast, by Application 2019 & 2032
- Table 12: United States BP Monitoring Device Industry Volume (K Units) Forecast, by Application 2019 & 2032
- Table 13: Canada BP Monitoring Device Industry Revenue (Million) Forecast, by Application 2019 & 2032
- Table 14: Canada BP Monitoring Device Industry Volume (K Units) Forecast, by Application 2019 & 2032
- Table 15: Mexico BP Monitoring Device Industry Revenue (Million) Forecast, by Application 2019 & 2032
- Table 16: Mexico BP Monitoring Device Industry Volume (K Units) Forecast, by Application 2019 & 2032
- Table 17: Global BP Monitoring Device Industry Revenue Million Forecast, by Country 2019 & 2032
- Table 18: Global BP Monitoring Device Industry Volume K Units Forecast, by Country 2019 & 2032
- Table 19: Brazil BP Monitoring Device Industry Revenue (Million) Forecast, by Application 2019 & 2032
- Table 20: Brazil BP Monitoring Device Industry Volume (K Units) Forecast, by Application 2019 & 2032
- Table 21: Mexico BP Monitoring Device Industry Revenue (Million) Forecast, by Application 2019 & 2032
- Table 22: Mexico BP Monitoring Device Industry Volume (K Units) Forecast, by Application 2019 & 2032
- Table 23: Rest of South America BP Monitoring Device Industry Revenue (Million) Forecast, by Application 2019 & 2032
- Table 24: Rest of South America BP Monitoring Device Industry Volume (K Units) Forecast, by Application 2019 & 2032
- Table 25: Global BP Monitoring Device Industry Revenue Million Forecast, by Country 2019 & 2032
- Table 26: Global BP Monitoring Device Industry Volume K Units Forecast, by Country 2019 & 2032
- Table 27: United Kingdom BP Monitoring Device Industry Revenue (Million) Forecast, by Application 2019 & 2032
- Table 28: United Kingdom BP Monitoring Device Industry Volume (K Units) Forecast, by Application 2019 & 2032
- Table 29: Germany BP Monitoring Device Industry Revenue (Million) Forecast, by Application 2019 & 2032
- Table 30: Germany BP Monitoring Device Industry Volume (K Units) Forecast, by Application 2019 & 2032
- Table 31: France BP Monitoring Device Industry Revenue (Million) Forecast, by Application 2019 & 2032
- Table 32: France BP Monitoring Device Industry Volume (K Units) Forecast, by Application 2019 & 2032
- Table 33: Italy BP Monitoring Device Industry Revenue (Million) Forecast, by Application 2019 & 2032
- Table 34: Italy BP Monitoring Device Industry Volume (K Units) Forecast, by Application 2019 & 2032
- Table 35: Spain BP Monitoring Device Industry Revenue (Million) Forecast, by Application 2019 & 2032
- Table 36: Spain BP Monitoring Device Industry Volume (K Units) Forecast, by Application 2019 & 2032
- Table 37: Russia BP Monitoring Device Industry Revenue (Million) Forecast, by Application 2019 & 2032
- Table 38: Russia BP Monitoring Device Industry Volume (K Units) Forecast, by Application 2019 & 2032
- Table 39: Rest of Europe BP Monitoring Device Industry Revenue (Million) Forecast, by Application 2019 & 2032
- Table 40: Rest of Europe BP Monitoring Device Industry Volume (K Units) Forecast, by Application 2019 & 2032
- Table 41: Global BP Monitoring Device Industry Revenue Million Forecast, by Country 2019 & 2032
- Table 42: Global BP Monitoring Device Industry Volume K Units Forecast, by Country 2019 & 2032
- Table 43: China BP Monitoring Device Industry Revenue (Million) Forecast, by Application 2019 & 2032
- Table 44: China BP Monitoring Device Industry Volume (K Units) Forecast, by Application 2019 & 2032
- Table 45: Japan BP Monitoring Device Industry Revenue (Million) Forecast, by Application 2019 & 2032
- Table 46: Japan BP Monitoring Device Industry Volume (K Units) Forecast, by Application 2019 & 2032
- Table 47: India BP Monitoring Device Industry Revenue (Million) Forecast, by Application 2019 & 2032
- Table 48: India BP Monitoring Device Industry Volume (K Units) Forecast, by Application 2019 & 2032
- Table 49: South Korea BP Monitoring Device Industry Revenue (Million) Forecast, by Application 2019 & 2032
- Table 50: South Korea BP Monitoring Device Industry Volume (K Units) Forecast, by Application 2019 & 2032
- Table 51: Taiwan BP Monitoring Device Industry Revenue (Million) Forecast, by Application 2019 & 2032
- Table 52: Taiwan BP Monitoring Device Industry Volume (K Units) Forecast, by Application 2019 & 2032
- Table 53: Australia BP Monitoring Device Industry Revenue (Million) Forecast, by Application 2019 & 2032
- Table 54: Australia BP Monitoring Device Industry Volume (K Units) Forecast, by Application 2019 & 2032
- Table 55: Rest of Asia-Pacific BP Monitoring Device Industry Revenue (Million) Forecast, by Application 2019 & 2032
- Table 56: Rest of Asia-Pacific BP Monitoring Device Industry Volume (K Units) Forecast, by Application 2019 & 2032
- Table 57: Global BP Monitoring Device Industry Revenue Million Forecast, by Country 2019 & 2032
- Table 58: Global BP Monitoring Device Industry Volume K Units Forecast, by Country 2019 & 2032
- Table 59: Middle East BP Monitoring Device Industry Revenue (Million) Forecast, by Application 2019 & 2032
- Table 60: Middle East BP Monitoring Device Industry Volume (K Units) Forecast, by Application 2019 & 2032
- Table 61: Africa BP Monitoring Device Industry Revenue (Million) Forecast, by Application 2019 & 2032
- Table 62: Africa BP Monitoring Device Industry Volume (K Units) Forecast, by Application 2019 & 2032
- Table 63: Global BP Monitoring Device Industry Revenue Million Forecast, by Product 2019 & 2032
- Table 64: Global BP Monitoring Device Industry Volume K Units Forecast, by Product 2019 & 2032
- Table 65: Global BP Monitoring Device Industry Revenue Million Forecast, by End User 2019 & 2032
- Table 66: Global BP Monitoring Device Industry Volume K Units Forecast, by End User 2019 & 2032
- Table 67: Global BP Monitoring Device Industry Revenue Million Forecast, by Country 2019 & 2032
- Table 68: Global BP Monitoring Device Industry Volume K Units Forecast, by Country 2019 & 2032
- Table 69: United States BP Monitoring Device Industry Revenue (Million) Forecast, by Application 2019 & 2032
- Table 70: United States BP Monitoring Device Industry Volume (K Units) Forecast, by Application 2019 & 2032
- Table 71: Canada BP Monitoring Device Industry Revenue (Million) Forecast, by Application 2019 & 2032
- Table 72: Canada BP Monitoring Device Industry Volume (K Units) Forecast, by Application 2019 & 2032
- Table 73: Mexico BP Monitoring Device Industry Revenue (Million) Forecast, by Application 2019 & 2032
- Table 74: Mexico BP Monitoring Device Industry Volume (K Units) Forecast, by Application 2019 & 2032
- Table 75: Global BP Monitoring Device Industry Revenue Million Forecast, by Product 2019 & 2032
- Table 76: Global BP Monitoring Device Industry Volume K Units Forecast, by Product 2019 & 2032
- Table 77: Global BP Monitoring Device Industry Revenue Million Forecast, by End User 2019 & 2032
- Table 78: Global BP Monitoring Device Industry Volume K Units Forecast, by End User 2019 & 2032
- Table 79: Global BP Monitoring Device Industry Revenue Million Forecast, by Country 2019 & 2032
- Table 80: Global BP Monitoring Device Industry Volume K Units Forecast, by Country 2019 & 2032
- Table 81: Germany BP Monitoring Device Industry Revenue (Million) Forecast, by Application 2019 & 2032
- Table 82: Germany BP Monitoring Device Industry Volume (K Units) Forecast, by Application 2019 & 2032
- Table 83: United Kingdom BP Monitoring Device Industry Revenue (Million) Forecast, by Application 2019 & 2032
- Table 84: United Kingdom BP Monitoring Device Industry Volume (K Units) Forecast, by Application 2019 & 2032
- Table 85: France BP Monitoring Device Industry Revenue (Million) Forecast, by Application 2019 & 2032
- Table 86: France BP Monitoring Device Industry Volume (K Units) Forecast, by Application 2019 & 2032
- Table 87: Italy BP Monitoring Device Industry Revenue (Million) Forecast, by Application 2019 & 2032
- Table 88: Italy BP Monitoring Device Industry Volume (K Units) Forecast, by Application 2019 & 2032
- Table 89: Spain BP Monitoring Device Industry Revenue (Million) Forecast, by Application 2019 & 2032
- Table 90: Spain BP Monitoring Device Industry Volume (K Units) Forecast, by Application 2019 & 2032
- Table 91: Rest of Europe BP Monitoring Device Industry Revenue (Million) Forecast, by Application 2019 & 2032
- Table 92: Rest of Europe BP Monitoring Device Industry Volume (K Units) Forecast, by Application 2019 & 2032
- Table 93: Global BP Monitoring Device Industry Revenue Million Forecast, by Product 2019 & 2032
- Table 94: Global BP Monitoring Device Industry Volume K Units Forecast, by Product 2019 & 2032
- Table 95: Global BP Monitoring Device Industry Revenue Million Forecast, by End User 2019 & 2032
- Table 96: Global BP Monitoring Device Industry Volume K Units Forecast, by End User 2019 & 2032
- Table 97: Global BP Monitoring Device Industry Revenue Million Forecast, by Country 2019 & 2032
- Table 98: Global BP Monitoring Device Industry Volume K Units Forecast, by Country 2019 & 2032
- Table 99: China BP Monitoring Device Industry Revenue (Million) Forecast, by Application 2019 & 2032
- Table 100: China BP Monitoring Device Industry Volume (K Units) Forecast, by Application 2019 & 2032
- Table 101: Japan BP Monitoring Device Industry Revenue (Million) Forecast, by Application 2019 & 2032
- Table 102: Japan BP Monitoring Device Industry Volume (K Units) Forecast, by Application 2019 & 2032
- Table 103: India BP Monitoring Device Industry Revenue (Million) Forecast, by Application 2019 & 2032
- Table 104: India BP Monitoring Device Industry Volume (K Units) Forecast, by Application 2019 & 2032
- Table 105: Australia BP Monitoring Device Industry Revenue (Million) Forecast, by Application 2019 & 2032
- Table 106: Australia BP Monitoring Device Industry Volume (K Units) Forecast, by Application 2019 & 2032
- Table 107: South Korea BP Monitoring Device Industry Revenue (Million) Forecast, by Application 2019 & 2032
- Table 108: South Korea BP Monitoring Device Industry Volume (K Units) Forecast, by Application 2019 & 2032
- Table 109: Rest of Asia Pacific BP Monitoring Device Industry Revenue (Million) Forecast, by Application 2019 & 2032
- Table 110: Rest of Asia Pacific BP Monitoring Device Industry Volume (K Units) Forecast, by Application 2019 & 2032
- Table 111: Global BP Monitoring Device Industry Revenue Million Forecast, by Product 2019 & 2032
- Table 112: Global BP Monitoring Device Industry Volume K Units Forecast, by Product 2019 & 2032
- Table 113: Global BP Monitoring Device Industry Revenue Million Forecast, by End User 2019 & 2032
- Table 114: Global BP Monitoring Device Industry Volume K Units Forecast, by End User 2019 & 2032
- Table 115: Global BP Monitoring Device Industry Revenue Million Forecast, by Country 2019 & 2032
- Table 116: Global BP Monitoring Device Industry Volume K Units Forecast, by Country 2019 & 2032
- Table 117: GCC BP Monitoring Device Industry Revenue (Million) Forecast, by Application 2019 & 2032
- Table 118: GCC BP Monitoring Device Industry Volume (K Units) Forecast, by Application 2019 & 2032
- Table 119: South Africa BP Monitoring Device Industry Revenue (Million) Forecast, by Application 2019 & 2032
- Table 120: South Africa BP Monitoring Device Industry Volume (K Units) Forecast, by Application 2019 & 2032
- Table 121: Rest of Middle East and Africa BP Monitoring Device Industry Revenue (Million) Forecast, by Application 2019 & 2032
- Table 122: Rest of Middle East and Africa BP Monitoring Device Industry Volume (K Units) Forecast, by Application 2019 & 2032
- Table 123: Global BP Monitoring Device Industry Revenue Million Forecast, by Product 2019 & 2032
- Table 124: Global BP Monitoring Device Industry Volume K Units Forecast, by Product 2019 & 2032
- Table 125: Global BP Monitoring Device Industry Revenue Million Forecast, by End User 2019 & 2032
- Table 126: Global BP Monitoring Device Industry Volume K Units Forecast, by End User 2019 & 2032
- Table 127: Global BP Monitoring Device Industry Revenue Million Forecast, by Country 2019 & 2032
- Table 128: Global BP Monitoring Device Industry Volume K Units Forecast, by Country 2019 & 2032
- Table 129: Brazil BP Monitoring Device Industry Revenue (Million) Forecast, by Application 2019 & 2032
- Table 130: Brazil BP Monitoring Device Industry Volume (K Units) Forecast, by Application 2019 & 2032
- Table 131: Argentina BP Monitoring Device Industry Revenue (Million) Forecast, by Application 2019 & 2032
- Table 132: Argentina BP Monitoring Device Industry Volume (K Units) Forecast, by Application 2019 & 2032
- Table 133: Rest of South America BP Monitoring Device Industry Revenue (Million) Forecast, by Application 2019 & 2032
- Table 134: Rest of South America BP Monitoring Device Industry Volume (K Units) Forecast, by Application 2019 & 2032
Frequently Asked Questions
1. What is the projected Compound Annual Growth Rate (CAGR) of the BP Monitoring Device Industry?
The projected CAGR is approximately 10.32%.
2. Which companies are prominent players in the BP Monitoring Device Industry?
Key companies in the market include GF Health Products Inc, Rossmax International Ltd, Kaz Inc, American Diagnostics Corporation, Koninklijke Philips N V, Withings*List Not Exhaustive, A&D Medical Inc, Microlife AG, General Electric Company (GE Healthcare), Omron Healthcare Inc.
3. What are the main segments of the BP Monitoring Device Industry?
The market segments include Product, End User.
4. Can you provide details about the market size?
The market size is estimated to be USD 4.88 Million as of 2022.
5. What are some drivers contributing to market growth?
Surging Burden of Cardiovascular Disorders; Technological Advancements.
6. What are the notable trends driving market growth?
Automated/Digital Blood Pressure Monitor is Expected to Witness a Growth Over the Forecast Period.
7. Are there any restraints impacting market growth?
Excessive Cost for Technological Developments.
8. Can you provide examples of recent developments in the market?
In May 2021, Biobeat announced the launch of its new wearable and continuous ambulatory blood pressure monitoring (ABPM) chest-monitoring device.
9. What pricing options are available for accessing the report?
Pricing options include single-user, multi-user, and enterprise licenses priced at USD 4750, USD 5250, and USD 8750 respectively.
10. Is the market size provided in terms of value or volume?
The market size is provided in terms of value, measured in Million and volume, measured in K Units.
11. Are there any specific market keywords associated with the report?
Yes, the market keyword associated with the report is "BP Monitoring Device Industry," which aids in identifying and referencing the specific market segment covered.
12. How do I determine which pricing option suits my needs best?
The pricing options vary based on user requirements and access needs. Individual users may opt for single-user licenses, while businesses requiring broader access may choose multi-user or enterprise licenses for cost-effective access to the report.
13. Are there any additional resources or data provided in the BP Monitoring Device Industry report?
While the report offers comprehensive insights, it's advisable to review the specific contents or supplementary materials provided to ascertain if additional resources or data are available.
14. How can I stay updated on further developments or reports in the BP Monitoring Device Industry?
To stay informed about further developments, trends, and reports in the BP Monitoring Device Industry, consider subscribing to industry newsletters, following relevant companies and organizations, or regularly checking reputable industry news sources and publications.
Methodology
Step 1 - Identification of Relevant Samples Size from Population Database


Step 2 - Approaches for Defining Global Market Size (Value, Volume* & Price*)

Note*: In applicable scenarios
Step 3 - Data Sources
Primary Research
- Web Analytics
- Survey Reports
- Research Institute
- Latest Research Reports
- Opinion Leaders
Secondary Research
- Annual Reports
- White Paper
- Latest Press Release
- Industry Association
- Paid Database
- Investor Presentations

Step 4 - Data Triangulation
Involves using different sources of information in order to increase the validity of a study
These sources are likely to be stakeholders in a program - participants, other researchers, program staff, other community members, and so on.
Then we put all data in single framework & apply various statistical tools to find out the dynamic on the market.
During the analysis stage, feedback from the stakeholder groups would be compared to determine areas of agreement as well as areas of divergence
