

Key Insights
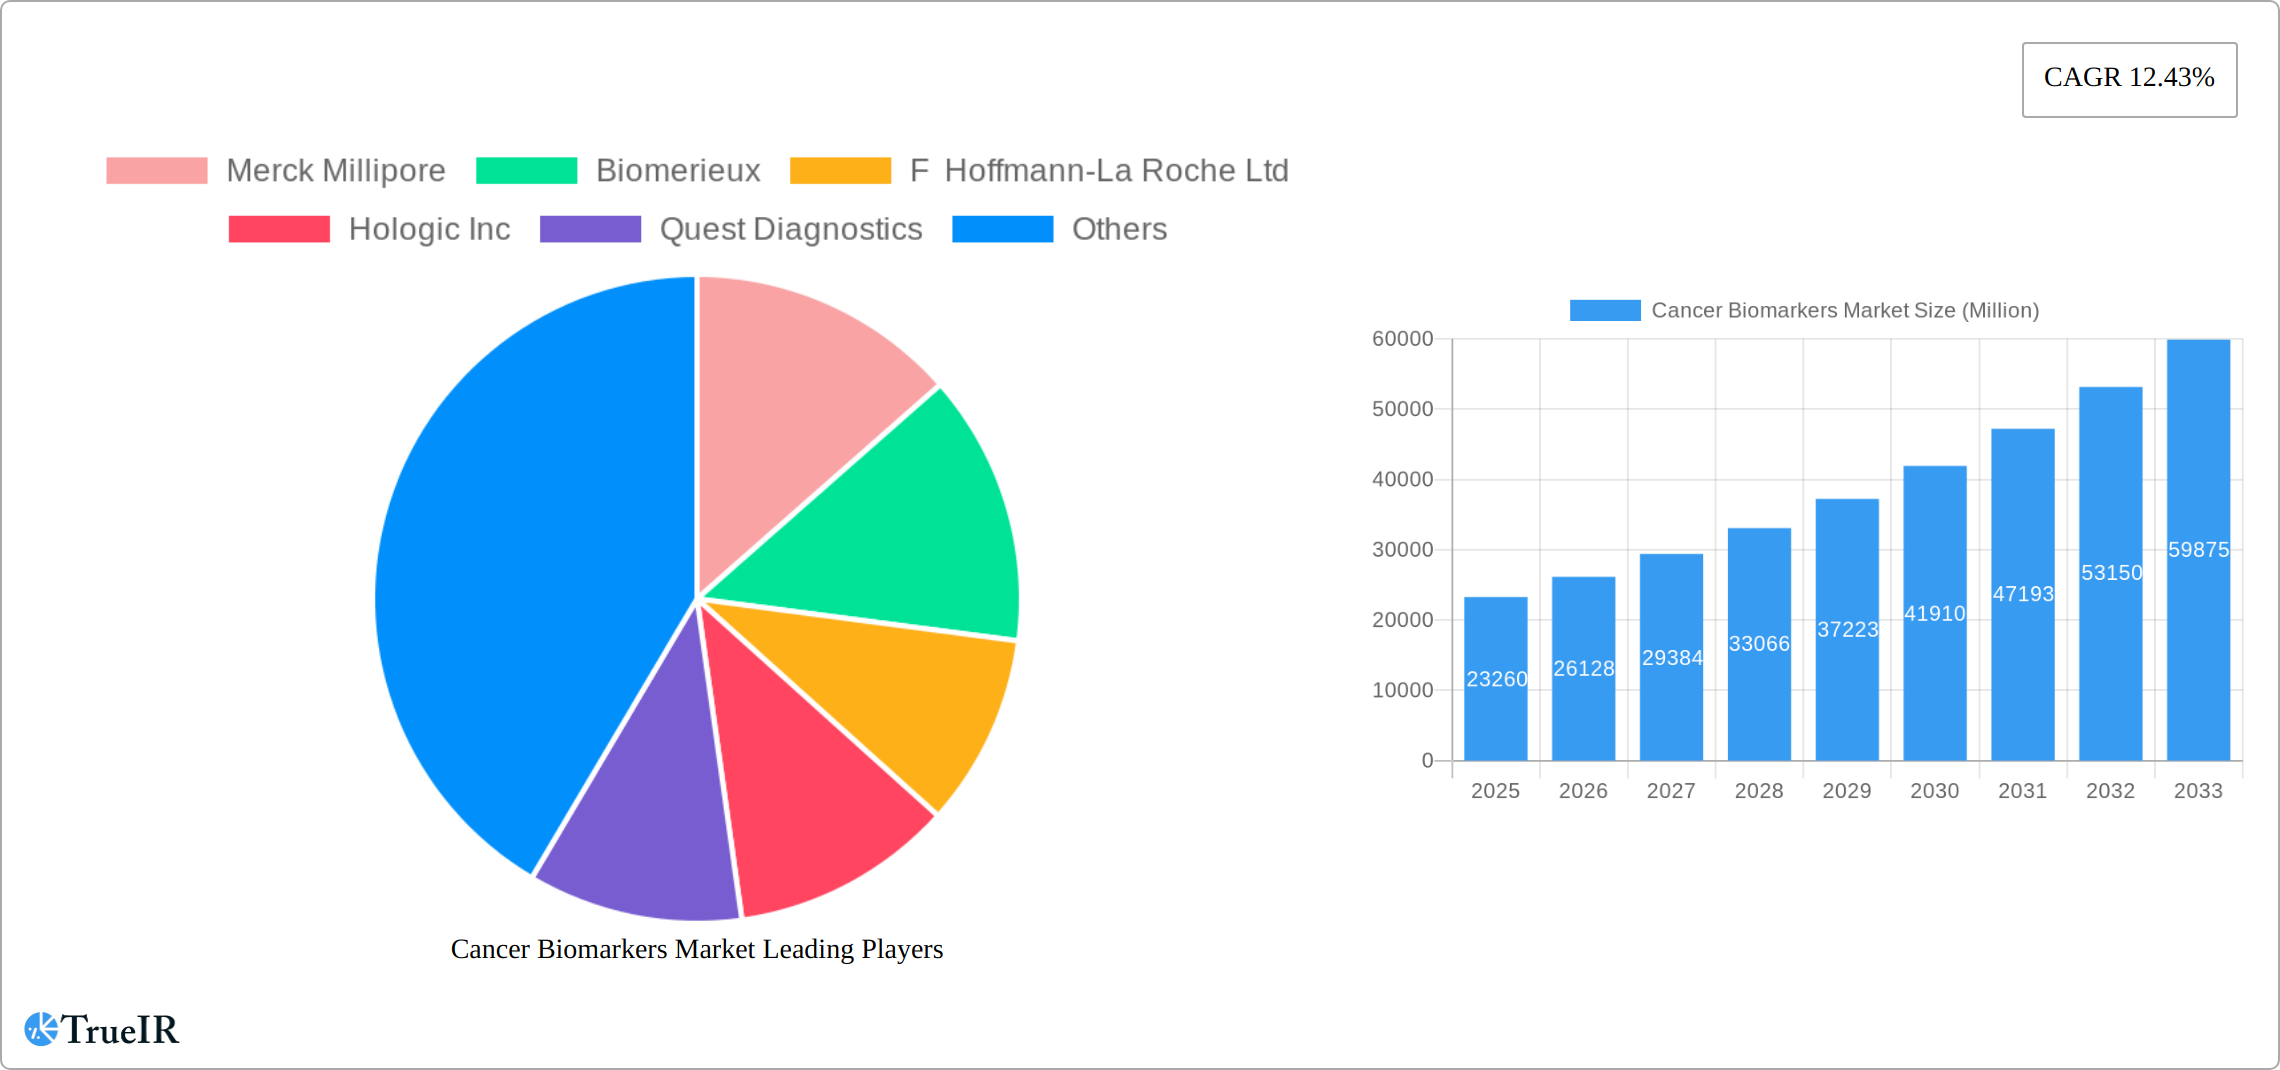
The global cancer biomarkers market, valued at $23.26 billion in 2025, is projected to experience robust growth, driven by a confluence of factors. The increasing prevalence of various cancers, coupled with advancements in diagnostic technologies and the rising demand for personalized medicine, are key market drivers. Specifically, the growing adoption of OMICS technologies (genomics, proteomics, metabolomics) for early cancer detection and improved treatment strategies is significantly boosting market expansion. Furthermore, the development of novel protein and genetic biomarkers offers greater accuracy in diagnosis and prognosis, fueling market growth. While the market is segmented by disease type (prostate, breast, lung, colorectal, cervical, and others), biomarker type (protein, genetic, and others), and profiling technology (OMICS, imaging, immunoassays, and others), the OMICS technology segment is expected to dominate owing to its comprehensive data generation capabilities. Geographical distribution shows a significant market presence in North America and Europe, attributable to established healthcare infrastructure and high healthcare expenditure. However, the Asia-Pacific region is anticipated to witness rapid growth in the coming years due to rising cancer incidence and increasing awareness about advanced diagnostic tools.
Despite the positive outlook, certain restraints exist. High costs associated with biomarker development and testing, coupled with regulatory hurdles in gaining approvals for new biomarkers, could pose challenges. However, ongoing research and development efforts, along with increasing collaborations between research institutions, pharmaceutical companies, and diagnostic companies, are anticipated to mitigate these limitations. The market's future growth trajectory is strongly linked to continued technological advancements, the expansion of targeted therapies, and increased investments in cancer research. Competition is intense, with major players like Merck Millipore, Biomerieux, Roche, Hologic, and others vying for market share through innovation and strategic partnerships. The market's projected Compound Annual Growth Rate (CAGR) of 12.43% from 2025 to 2033 indicates a promising future for cancer biomarker development and utilization.
Cancer Biomarkers Market: A Comprehensive Report (2019-2033)
This dynamic report provides a comprehensive analysis of the Cancer Biomarkers Market, offering invaluable insights for investors, researchers, and industry professionals. Leveraging extensive market research and data analysis covering the period 2019-2033 (Base Year: 2025, Forecast Period: 2025-2033), this report unveils the market's structure, competitive landscape, key trends, and future outlook. The market is projected to reach xx Million by 2033, exhibiting a CAGR of xx% during the forecast period. This report is essential for understanding the opportunities and challenges within this rapidly evolving sector.
Cancer Biomarkers Market Market Structure & Competitive Landscape
The Cancer Biomarkers Market is characterized by a moderately concentrated landscape, with several key players commanding significant market share. The Herfindahl-Hirschman Index (HHI) for 2024 is estimated at xx, indicating a moderately competitive environment. Innovation is a primary driver, with companies continuously investing in R&D to develop novel biomarkers and diagnostic technologies. Regulatory approvals and reimbursement policies significantly influence market dynamics, necessitating compliance with stringent guidelines. Product substitutes, such as traditional diagnostic methods, exist but are often less precise or efficient than biomarker-based approaches. The market is segmented by end-users, primarily hospitals, research institutions, and diagnostic laboratories. M&A activity in this sector is prevalent, with xx major acquisitions observed between 2019 and 2024, valued at approximately xx Million. This consolidation reflects the desire to enhance market presence, expand product portfolios, and acquire innovative technologies.
- High R&D Expenditure: Leading players invest heavily in research and development to create advanced biomarker tests.
- Stringent Regulatory Approvals: Regulatory bodies like the FDA exert considerable influence on market growth.
- Technological Advancements: Continuous improvements in omics technologies, imaging, and immunoassays fuel innovation.
- Strategic Acquisitions and Mergers: M&A activity consolidates market share and drives technological innovation.
- End-User Segmentation: Hospitals, research institutions, and diagnostic labs are major consumers.
Cancer Biomarkers Market Market Trends & Opportunities
The Cancer Biomarkers Market is experiencing robust growth, driven by several factors. The increasing prevalence of cancer globally, coupled with rising awareness and early diagnosis initiatives, fuels demand for effective biomarkers. Technological advancements, particularly in genomics, proteomics, and imaging, are enabling the development of more sensitive and specific tests. Consumer preferences increasingly lean towards personalized medicine, with a growing desire for tailored therapies guided by biomarker profiling. Competitive dynamics remain intense, with established players and emerging companies vying for market share through product innovation, strategic partnerships, and acquisitions. The market's CAGR is estimated at xx% from 2025 to 2033. Market penetration rates vary significantly across different cancer types and regions, with higher rates observed in developed economies owing to better healthcare infrastructure and access to advanced diagnostics. The significant unmet needs in early cancer detection and personalized treatment represent major opportunities for market expansion. The increasing availability of liquid biopsies and minimally invasive diagnostic techniques further contribute to market growth.

Dominant Markets & Segments in Cancer Biomarkers Market
The Cancer Biomarkers Market is geographically diverse, with significant regional variations in market size and growth rates. North America currently holds the largest market share due to strong regulatory frameworks, advanced healthcare infrastructure, and high adoption rates of new technologies. Within the disease segments, prostate, breast, lung, and colorectal cancers collectively account for a large proportion of the market, due to their high prevalence and extensive research efforts.
- By Disease: Prostate Cancer, Breast Cancer, and Lung Cancer are the dominant segments.
- By Type: Protein biomarkers constitute a major segment due to their relative ease of detection and well-established clinical use.
- By Profiling Technology: OMICS technologies (genomics, proteomics) are experiencing rapid growth due to their high information content.
Key Growth Drivers:
- Increased Cancer Prevalence: The rising incidence of cancer globally fuels demand for early detection and personalized treatment.
- Technological Advancements: Improvements in biomarker identification and detection methods drive market expansion.
- Government Funding and Initiatives: Significant investment in cancer research and diagnostic technologies from governmental and non-governmental organizations.
- Favorable Reimbursement Policies: Coverage of biomarker tests by healthcare insurers facilitates broader adoption.
Cancer Biomarkers Market Product Analysis
Technological advancements are central to the evolution of cancer biomarker products. Innovations in next-generation sequencing (NGS), mass spectrometry, and microfluidic technologies are driving the development of highly sensitive and specific assays for detecting a wide range of biomarkers. These improvements are enhancing the accuracy of cancer diagnostics, allowing for earlier detection and facilitating personalized treatment strategies. The competitive advantage lies in developing robust, cost-effective, and user-friendly tests with superior analytical performance. The growing emphasis on liquid biopsies (blood-based testing) represents a significant shift in the market, offering a less invasive and more convenient alternative to traditional tissue biopsies.
Key Drivers, Barriers & Challenges in Cancer Biomarkers Market
Key Drivers: The increasing prevalence of cancer, technological advancements (NGS, mass spectrometry), rising demand for personalized medicine, and government funding for cancer research are major drivers.
Challenges: High development costs, stringent regulatory hurdles, reimbursement complexities, and competition from existing diagnostic methods present significant challenges. Supply chain disruptions also pose a risk. The estimated cost of bringing a new biomarker test to market can exceed xx Million.
Growth Drivers in the Cancer Biomarkers Market Market
Technological advancements in areas such as genomics, proteomics, and imaging are significantly driving market growth. Increased government funding and supportive regulatory frameworks in several countries further facilitate market expansion. The growing demand for personalized medicine, coupled with the rising prevalence of cancer, creates a favorable environment for the adoption of cancer biomarkers.
Challenges Impacting Cancer Biomarkers Market Growth
Stringent regulatory requirements and high development costs pose significant barriers to entry. The need for extensive clinical validation studies and complex reimbursement processes adds to the challenges. Competition from established players and the emergence of novel technologies necessitates continuous innovation to maintain market competitiveness. Supply chain disruptions, particularly affecting reagents and consumables, also impact the market.
Key Players Shaping the Cancer Biomarkers Market Market
- Merck Millipore
- Biomerieux
- F Hoffmann-La Roche Ltd
- Hologic Inc
- Quest Diagnostics
- Qiagen
- Thermo Fisher Scientific
- Illumina Inc
- Abbott Laboratories Inc
- Agilent Technologies
Significant Cancer Biomarkers Market Industry Milestones
- February 2022: OncoDNA launched the OncoDEEP Solid Tumor Biomarker Test Kit, offering a comprehensive NGS solution for tumor sample analysis. This significantly enhances the speed and accuracy of cancer diagnostics.
- June 2022: Nonagen Bioscience received CE marking for its Oncuria immunoassay for bladder cancer, marking a significant advancement in early bladder cancer detection through a novel multiplex urine test.
Future Outlook for Cancer Biomarkers Market Market
The Cancer Biomarkers Market is poised for continued robust growth, driven by technological innovation, increased investment in cancer research, and the growing need for personalized medicine. Strategic partnerships and acquisitions will likely shape the competitive landscape, while the development of novel biomarkers and improved diagnostic technologies will further expand market opportunities. The integration of artificial intelligence (AI) and machine learning (ML) in biomarker analysis is expected to enhance the precision and efficiency of cancer diagnostics, driving further market expansion in the coming years.
Cancer Biomarkers Market Segmentation
-
1. Disease
- 1.1. Prostate Cancer
- 1.2. Breast Cancer
- 1.3. Lung Cancer
- 1.4. Colorectal Cancer
- 1.5. Cervical Cancer
- 1.6. Other Diseases
-
2. Type
- 2.1. Protein Biomarkers
- 2.2. Genetic Biomarkers
- 2.3. Other Types
-
3. Profiling Technology
- 3.1. OMICS Technology
- 3.2. Imaging Technology
- 3.3. Immunoassays
- 3.4. Others
Cancer Biomarkers Market Segmentation By Geography
-
1. North America
- 1.1. United States
- 1.2. Canada
- 1.3. Mexico
-
2. Europe
- 2.1. Germany
- 2.2. United Kingdom
- 2.3. France
- 2.4. Italy
- 2.5. Spain
- 2.6. Rest of Europe
-
3. Asia Pacific
- 3.1. China
- 3.2. Japan
- 3.3. India
- 3.4. Australia
- 3.5. South Korea
- 3.6. Rest of Asia Pacific
-
4. Middle East and Africa
- 4.1. GCC
- 4.2. South Africa
- 4.3. Rest of Middle East and Africa
-
5. South America
- 5.1. Brazil
- 5.2. Argentina
- 5.3. Rest of South America

Cancer Biomarkers Market REPORT HIGHLIGHTS
| Aspects | Details |
|---|---|
| Study Period | 2019-2033 |
| Base Year | 2024 |
| Estimated Year | 2025 |
| Forecast Period | 2025-2033 |
| Historical Period | 2019-2024 |
| Growth Rate | CAGR of 12.43% from 2019-2033 |
| Segmentation |
|
Table of Contents
- 1. Introduction
- 1.1. Research Scope
- 1.2. Market Segmentation
- 1.3. Research Methodology
- 1.4. Definitions and Assumptions
- 2. Executive Summary
- 2.1. Introduction
- 3. Market Dynamics
- 3.1. Introduction
- 3.2. Market Drivers
- 3.2.1. Surge in Prevalence of Cancer Across the Globe; Paradigm Shift in Healthcare from Disease Diagnosis to Risk Assessment or Early Diagnosis; Increasing Focus on Innovative Drug Development
- 3.3. Market Restrains
- 3.3.1. High Cost of Cancer Diagnosis with Biomarkers; Reimbursement Issues with Biomarker Testing
- 3.4. Market Trends
- 3.4.1. Lung Cancer Segment is Expected to Hold a Significant Market Share in the Cancer Biomarkers Market
- 4. Market Factor Analysis
- 4.1. Porters Five Forces
- 4.2. Supply/Value Chain
- 4.3. PESTEL analysis
- 4.4. Market Entropy
- 4.5. Patent/Trademark Analysis
- 5. Global Cancer Biomarkers Market Analysis, Insights and Forecast, 2019-2031
- 5.1. Market Analysis, Insights and Forecast - by Disease
- 5.1.1. Prostate Cancer
- 5.1.2. Breast Cancer
- 5.1.3. Lung Cancer
- 5.1.4. Colorectal Cancer
- 5.1.5. Cervical Cancer
- 5.1.6. Other Diseases
- 5.2. Market Analysis, Insights and Forecast - by Type
- 5.2.1. Protein Biomarkers
- 5.2.2. Genetic Biomarkers
- 5.2.3. Other Types
- 5.3. Market Analysis, Insights and Forecast - by Profiling Technology
- 5.3.1. OMICS Technology
- 5.3.2. Imaging Technology
- 5.3.3. Immunoassays
- 5.3.4. Others
- 5.4. Market Analysis, Insights and Forecast - by Region
- 5.4.1. North America
- 5.4.2. Europe
- 5.4.3. Asia Pacific
- 5.4.4. Middle East and Africa
- 5.4.5. South America
- 5.1. Market Analysis, Insights and Forecast - by Disease
- 6. North America Cancer Biomarkers Market Analysis, Insights and Forecast, 2019-2031
- 6.1. Market Analysis, Insights and Forecast - by Disease
- 6.1.1. Prostate Cancer
- 6.1.2. Breast Cancer
- 6.1.3. Lung Cancer
- 6.1.4. Colorectal Cancer
- 6.1.5. Cervical Cancer
- 6.1.6. Other Diseases
- 6.2. Market Analysis, Insights and Forecast - by Type
- 6.2.1. Protein Biomarkers
- 6.2.2. Genetic Biomarkers
- 6.2.3. Other Types
- 6.3. Market Analysis, Insights and Forecast - by Profiling Technology
- 6.3.1. OMICS Technology
- 6.3.2. Imaging Technology
- 6.3.3. Immunoassays
- 6.3.4. Others
- 6.1. Market Analysis, Insights and Forecast - by Disease
- 7. Europe Cancer Biomarkers Market Analysis, Insights and Forecast, 2019-2031
- 7.1. Market Analysis, Insights and Forecast - by Disease
- 7.1.1. Prostate Cancer
- 7.1.2. Breast Cancer
- 7.1.3. Lung Cancer
- 7.1.4. Colorectal Cancer
- 7.1.5. Cervical Cancer
- 7.1.6. Other Diseases
- 7.2. Market Analysis, Insights and Forecast - by Type
- 7.2.1. Protein Biomarkers
- 7.2.2. Genetic Biomarkers
- 7.2.3. Other Types
- 7.3. Market Analysis, Insights and Forecast - by Profiling Technology
- 7.3.1. OMICS Technology
- 7.3.2. Imaging Technology
- 7.3.3. Immunoassays
- 7.3.4. Others
- 7.1. Market Analysis, Insights and Forecast - by Disease
- 8. Asia Pacific Cancer Biomarkers Market Analysis, Insights and Forecast, 2019-2031
- 8.1. Market Analysis, Insights and Forecast - by Disease
- 8.1.1. Prostate Cancer
- 8.1.2. Breast Cancer
- 8.1.3. Lung Cancer
- 8.1.4. Colorectal Cancer
- 8.1.5. Cervical Cancer
- 8.1.6. Other Diseases
- 8.2. Market Analysis, Insights and Forecast - by Type
- 8.2.1. Protein Biomarkers
- 8.2.2. Genetic Biomarkers
- 8.2.3. Other Types
- 8.3. Market Analysis, Insights and Forecast - by Profiling Technology
- 8.3.1. OMICS Technology
- 8.3.2. Imaging Technology
- 8.3.3. Immunoassays
- 8.3.4. Others
- 8.1. Market Analysis, Insights and Forecast - by Disease
- 9. Middle East and Africa Cancer Biomarkers Market Analysis, Insights and Forecast, 2019-2031
- 9.1. Market Analysis, Insights and Forecast - by Disease
- 9.1.1. Prostate Cancer
- 9.1.2. Breast Cancer
- 9.1.3. Lung Cancer
- 9.1.4. Colorectal Cancer
- 9.1.5. Cervical Cancer
- 9.1.6. Other Diseases
- 9.2. Market Analysis, Insights and Forecast - by Type
- 9.2.1. Protein Biomarkers
- 9.2.2. Genetic Biomarkers
- 9.2.3. Other Types
- 9.3. Market Analysis, Insights and Forecast - by Profiling Technology
- 9.3.1. OMICS Technology
- 9.3.2. Imaging Technology
- 9.3.3. Immunoassays
- 9.3.4. Others
- 9.1. Market Analysis, Insights and Forecast - by Disease
- 10. South America Cancer Biomarkers Market Analysis, Insights and Forecast, 2019-2031
- 10.1. Market Analysis, Insights and Forecast - by Disease
- 10.1.1. Prostate Cancer
- 10.1.2. Breast Cancer
- 10.1.3. Lung Cancer
- 10.1.4. Colorectal Cancer
- 10.1.5. Cervical Cancer
- 10.1.6. Other Diseases
- 10.2. Market Analysis, Insights and Forecast - by Type
- 10.2.1. Protein Biomarkers
- 10.2.2. Genetic Biomarkers
- 10.2.3. Other Types
- 10.3. Market Analysis, Insights and Forecast - by Profiling Technology
- 10.3.1. OMICS Technology
- 10.3.2. Imaging Technology
- 10.3.3. Immunoassays
- 10.3.4. Others
- 10.1. Market Analysis, Insights and Forecast - by Disease
- 11. North America Cancer Biomarkers Market Analysis, Insights and Forecast, 2019-2031
- 11.1. Market Analysis, Insights and Forecast - By Country/Sub-region
- 11.1.1 United States
- 11.1.2 Canada
- 11.1.3 Mexico
- 12. Europe Cancer Biomarkers Market Analysis, Insights and Forecast, 2019-2031
- 12.1. Market Analysis, Insights and Forecast - By Country/Sub-region
- 12.1.1 Germany
- 12.1.2 United Kingdom
- 12.1.3 France
- 12.1.4 Italy
- 12.1.5 Spain
- 12.1.6 Rest of Europe
- 13. Asia Pacific Cancer Biomarkers Market Analysis, Insights and Forecast, 2019-2031
- 13.1. Market Analysis, Insights and Forecast - By Country/Sub-region
- 13.1.1 China
- 13.1.2 Japan
- 13.1.3 India
- 13.1.4 Australia
- 13.1.5 South Korea
- 13.1.6 Rest of Asia Pacific
- 14. Middle East and Africa Cancer Biomarkers Market Analysis, Insights and Forecast, 2019-2031
- 14.1. Market Analysis, Insights and Forecast - By Country/Sub-region
- 14.1.1 GCC
- 14.1.2 South Africa
- 14.1.3 Rest of Middle East and Africa
- 15. South America Cancer Biomarkers Market Analysis, Insights and Forecast, 2019-2031
- 15.1. Market Analysis, Insights and Forecast - By Country/Sub-region
- 15.1.1 Brazil
- 15.1.2 Argentina
- 15.1.3 Rest of South America
- 16. Competitive Analysis
- 16.1. Global Market Share Analysis 2024
- 16.2. Company Profiles
- 16.2.1 Merck Millipore
- 16.2.1.1. Overview
- 16.2.1.2. Products
- 16.2.1.3. SWOT Analysis
- 16.2.1.4. Recent Developments
- 16.2.1.5. Financials (Based on Availability)
- 16.2.2 Biomerieux
- 16.2.2.1. Overview
- 16.2.2.2. Products
- 16.2.2.3. SWOT Analysis
- 16.2.2.4. Recent Developments
- 16.2.2.5. Financials (Based on Availability)
- 16.2.3 F Hoffmann-La Roche Ltd
- 16.2.3.1. Overview
- 16.2.3.2. Products
- 16.2.3.3. SWOT Analysis
- 16.2.3.4. Recent Developments
- 16.2.3.5. Financials (Based on Availability)
- 16.2.4 Hologic Inc
- 16.2.4.1. Overview
- 16.2.4.2. Products
- 16.2.4.3. SWOT Analysis
- 16.2.4.4. Recent Developments
- 16.2.4.5. Financials (Based on Availability)
- 16.2.5 Quest Diagnostics
- 16.2.5.1. Overview
- 16.2.5.2. Products
- 16.2.5.3. SWOT Analysis
- 16.2.5.4. Recent Developments
- 16.2.5.5. Financials (Based on Availability)
- 16.2.6 Qiagen
- 16.2.6.1. Overview
- 16.2.6.2. Products
- 16.2.6.3. SWOT Analysis
- 16.2.6.4. Recent Developments
- 16.2.6.5. Financials (Based on Availability)
- 16.2.7 Thermo Fisher Scientific
- 16.2.7.1. Overview
- 16.2.7.2. Products
- 16.2.7.3. SWOT Analysis
- 16.2.7.4. Recent Developments
- 16.2.7.5. Financials (Based on Availability)
- 16.2.8 Illumina Inc
- 16.2.8.1. Overview
- 16.2.8.2. Products
- 16.2.8.3. SWOT Analysis
- 16.2.8.4. Recent Developments
- 16.2.8.5. Financials (Based on Availability)
- 16.2.9 Abbott Laboratories Inc
- 16.2.9.1. Overview
- 16.2.9.2. Products
- 16.2.9.3. SWOT Analysis
- 16.2.9.4. Recent Developments
- 16.2.9.5. Financials (Based on Availability)
- 16.2.10 Agilent Technologies
- 16.2.10.1. Overview
- 16.2.10.2. Products
- 16.2.10.3. SWOT Analysis
- 16.2.10.4. Recent Developments
- 16.2.10.5. Financials (Based on Availability)
- 16.2.1 Merck Millipore
List of Figures
- Figure 1: Global Cancer Biomarkers Market Revenue Breakdown (Million, %) by Region 2024 & 2032
- Figure 2: Global Cancer Biomarkers Market Volume Breakdown (K Unit, %) by Region 2024 & 2032
- Figure 3: North America Cancer Biomarkers Market Revenue (Million), by Country 2024 & 2032
- Figure 4: North America Cancer Biomarkers Market Volume (K Unit), by Country 2024 & 2032
- Figure 5: North America Cancer Biomarkers Market Revenue Share (%), by Country 2024 & 2032
- Figure 6: North America Cancer Biomarkers Market Volume Share (%), by Country 2024 & 2032
- Figure 7: Europe Cancer Biomarkers Market Revenue (Million), by Country 2024 & 2032
- Figure 8: Europe Cancer Biomarkers Market Volume (K Unit), by Country 2024 & 2032
- Figure 9: Europe Cancer Biomarkers Market Revenue Share (%), by Country 2024 & 2032
- Figure 10: Europe Cancer Biomarkers Market Volume Share (%), by Country 2024 & 2032
- Figure 11: Asia Pacific Cancer Biomarkers Market Revenue (Million), by Country 2024 & 2032
- Figure 12: Asia Pacific Cancer Biomarkers Market Volume (K Unit), by Country 2024 & 2032
- Figure 13: Asia Pacific Cancer Biomarkers Market Revenue Share (%), by Country 2024 & 2032
- Figure 14: Asia Pacific Cancer Biomarkers Market Volume Share (%), by Country 2024 & 2032
- Figure 15: Middle East and Africa Cancer Biomarkers Market Revenue (Million), by Country 2024 & 2032
- Figure 16: Middle East and Africa Cancer Biomarkers Market Volume (K Unit), by Country 2024 & 2032
- Figure 17: Middle East and Africa Cancer Biomarkers Market Revenue Share (%), by Country 2024 & 2032
- Figure 18: Middle East and Africa Cancer Biomarkers Market Volume Share (%), by Country 2024 & 2032
- Figure 19: South America Cancer Biomarkers Market Revenue (Million), by Country 2024 & 2032
- Figure 20: South America Cancer Biomarkers Market Volume (K Unit), by Country 2024 & 2032
- Figure 21: South America Cancer Biomarkers Market Revenue Share (%), by Country 2024 & 2032
- Figure 22: South America Cancer Biomarkers Market Volume Share (%), by Country 2024 & 2032
- Figure 23: North America Cancer Biomarkers Market Revenue (Million), by Disease 2024 & 2032
- Figure 24: North America Cancer Biomarkers Market Volume (K Unit), by Disease 2024 & 2032
- Figure 25: North America Cancer Biomarkers Market Revenue Share (%), by Disease 2024 & 2032
- Figure 26: North America Cancer Biomarkers Market Volume Share (%), by Disease 2024 & 2032
- Figure 27: North America Cancer Biomarkers Market Revenue (Million), by Type 2024 & 2032
- Figure 28: North America Cancer Biomarkers Market Volume (K Unit), by Type 2024 & 2032
- Figure 29: North America Cancer Biomarkers Market Revenue Share (%), by Type 2024 & 2032
- Figure 30: North America Cancer Biomarkers Market Volume Share (%), by Type 2024 & 2032
- Figure 31: North America Cancer Biomarkers Market Revenue (Million), by Profiling Technology 2024 & 2032
- Figure 32: North America Cancer Biomarkers Market Volume (K Unit), by Profiling Technology 2024 & 2032
- Figure 33: North America Cancer Biomarkers Market Revenue Share (%), by Profiling Technology 2024 & 2032
- Figure 34: North America Cancer Biomarkers Market Volume Share (%), by Profiling Technology 2024 & 2032
- Figure 35: North America Cancer Biomarkers Market Revenue (Million), by Country 2024 & 2032
- Figure 36: North America Cancer Biomarkers Market Volume (K Unit), by Country 2024 & 2032
- Figure 37: North America Cancer Biomarkers Market Revenue Share (%), by Country 2024 & 2032
- Figure 38: North America Cancer Biomarkers Market Volume Share (%), by Country 2024 & 2032
- Figure 39: Europe Cancer Biomarkers Market Revenue (Million), by Disease 2024 & 2032
- Figure 40: Europe Cancer Biomarkers Market Volume (K Unit), by Disease 2024 & 2032
- Figure 41: Europe Cancer Biomarkers Market Revenue Share (%), by Disease 2024 & 2032
- Figure 42: Europe Cancer Biomarkers Market Volume Share (%), by Disease 2024 & 2032
- Figure 43: Europe Cancer Biomarkers Market Revenue (Million), by Type 2024 & 2032
- Figure 44: Europe Cancer Biomarkers Market Volume (K Unit), by Type 2024 & 2032
- Figure 45: Europe Cancer Biomarkers Market Revenue Share (%), by Type 2024 & 2032
- Figure 46: Europe Cancer Biomarkers Market Volume Share (%), by Type 2024 & 2032
- Figure 47: Europe Cancer Biomarkers Market Revenue (Million), by Profiling Technology 2024 & 2032
- Figure 48: Europe Cancer Biomarkers Market Volume (K Unit), by Profiling Technology 2024 & 2032
- Figure 49: Europe Cancer Biomarkers Market Revenue Share (%), by Profiling Technology 2024 & 2032
- Figure 50: Europe Cancer Biomarkers Market Volume Share (%), by Profiling Technology 2024 & 2032
- Figure 51: Europe Cancer Biomarkers Market Revenue (Million), by Country 2024 & 2032
- Figure 52: Europe Cancer Biomarkers Market Volume (K Unit), by Country 2024 & 2032
- Figure 53: Europe Cancer Biomarkers Market Revenue Share (%), by Country 2024 & 2032
- Figure 54: Europe Cancer Biomarkers Market Volume Share (%), by Country 2024 & 2032
- Figure 55: Asia Pacific Cancer Biomarkers Market Revenue (Million), by Disease 2024 & 2032
- Figure 56: Asia Pacific Cancer Biomarkers Market Volume (K Unit), by Disease 2024 & 2032
- Figure 57: Asia Pacific Cancer Biomarkers Market Revenue Share (%), by Disease 2024 & 2032
- Figure 58: Asia Pacific Cancer Biomarkers Market Volume Share (%), by Disease 2024 & 2032
- Figure 59: Asia Pacific Cancer Biomarkers Market Revenue (Million), by Type 2024 & 2032
- Figure 60: Asia Pacific Cancer Biomarkers Market Volume (K Unit), by Type 2024 & 2032
- Figure 61: Asia Pacific Cancer Biomarkers Market Revenue Share (%), by Type 2024 & 2032
- Figure 62: Asia Pacific Cancer Biomarkers Market Volume Share (%), by Type 2024 & 2032
- Figure 63: Asia Pacific Cancer Biomarkers Market Revenue (Million), by Profiling Technology 2024 & 2032
- Figure 64: Asia Pacific Cancer Biomarkers Market Volume (K Unit), by Profiling Technology 2024 & 2032
- Figure 65: Asia Pacific Cancer Biomarkers Market Revenue Share (%), by Profiling Technology 2024 & 2032
- Figure 66: Asia Pacific Cancer Biomarkers Market Volume Share (%), by Profiling Technology 2024 & 2032
- Figure 67: Asia Pacific Cancer Biomarkers Market Revenue (Million), by Country 2024 & 2032
- Figure 68: Asia Pacific Cancer Biomarkers Market Volume (K Unit), by Country 2024 & 2032
- Figure 69: Asia Pacific Cancer Biomarkers Market Revenue Share (%), by Country 2024 & 2032
- Figure 70: Asia Pacific Cancer Biomarkers Market Volume Share (%), by Country 2024 & 2032
- Figure 71: Middle East and Africa Cancer Biomarkers Market Revenue (Million), by Disease 2024 & 2032
- Figure 72: Middle East and Africa Cancer Biomarkers Market Volume (K Unit), by Disease 2024 & 2032
- Figure 73: Middle East and Africa Cancer Biomarkers Market Revenue Share (%), by Disease 2024 & 2032
- Figure 74: Middle East and Africa Cancer Biomarkers Market Volume Share (%), by Disease 2024 & 2032
- Figure 75: Middle East and Africa Cancer Biomarkers Market Revenue (Million), by Type 2024 & 2032
- Figure 76: Middle East and Africa Cancer Biomarkers Market Volume (K Unit), by Type 2024 & 2032
- Figure 77: Middle East and Africa Cancer Biomarkers Market Revenue Share (%), by Type 2024 & 2032
- Figure 78: Middle East and Africa Cancer Biomarkers Market Volume Share (%), by Type 2024 & 2032
- Figure 79: Middle East and Africa Cancer Biomarkers Market Revenue (Million), by Profiling Technology 2024 & 2032
- Figure 80: Middle East and Africa Cancer Biomarkers Market Volume (K Unit), by Profiling Technology 2024 & 2032
- Figure 81: Middle East and Africa Cancer Biomarkers Market Revenue Share (%), by Profiling Technology 2024 & 2032
- Figure 82: Middle East and Africa Cancer Biomarkers Market Volume Share (%), by Profiling Technology 2024 & 2032
- Figure 83: Middle East and Africa Cancer Biomarkers Market Revenue (Million), by Country 2024 & 2032
- Figure 84: Middle East and Africa Cancer Biomarkers Market Volume (K Unit), by Country 2024 & 2032
- Figure 85: Middle East and Africa Cancer Biomarkers Market Revenue Share (%), by Country 2024 & 2032
- Figure 86: Middle East and Africa Cancer Biomarkers Market Volume Share (%), by Country 2024 & 2032
- Figure 87: South America Cancer Biomarkers Market Revenue (Million), by Disease 2024 & 2032
- Figure 88: South America Cancer Biomarkers Market Volume (K Unit), by Disease 2024 & 2032
- Figure 89: South America Cancer Biomarkers Market Revenue Share (%), by Disease 2024 & 2032
- Figure 90: South America Cancer Biomarkers Market Volume Share (%), by Disease 2024 & 2032
- Figure 91: South America Cancer Biomarkers Market Revenue (Million), by Type 2024 & 2032
- Figure 92: South America Cancer Biomarkers Market Volume (K Unit), by Type 2024 & 2032
- Figure 93: South America Cancer Biomarkers Market Revenue Share (%), by Type 2024 & 2032
- Figure 94: South America Cancer Biomarkers Market Volume Share (%), by Type 2024 & 2032
- Figure 95: South America Cancer Biomarkers Market Revenue (Million), by Profiling Technology 2024 & 2032
- Figure 96: South America Cancer Biomarkers Market Volume (K Unit), by Profiling Technology 2024 & 2032
- Figure 97: South America Cancer Biomarkers Market Revenue Share (%), by Profiling Technology 2024 & 2032
- Figure 98: South America Cancer Biomarkers Market Volume Share (%), by Profiling Technology 2024 & 2032
- Figure 99: South America Cancer Biomarkers Market Revenue (Million), by Country 2024 & 2032
- Figure 100: South America Cancer Biomarkers Market Volume (K Unit), by Country 2024 & 2032
- Figure 101: South America Cancer Biomarkers Market Revenue Share (%), by Country 2024 & 2032
- Figure 102: South America Cancer Biomarkers Market Volume Share (%), by Country 2024 & 2032
List of Tables
- Table 1: Global Cancer Biomarkers Market Revenue Million Forecast, by Region 2019 & 2032
- Table 2: Global Cancer Biomarkers Market Volume K Unit Forecast, by Region 2019 & 2032
- Table 3: Global Cancer Biomarkers Market Revenue Million Forecast, by Disease 2019 & 2032
- Table 4: Global Cancer Biomarkers Market Volume K Unit Forecast, by Disease 2019 & 2032
- Table 5: Global Cancer Biomarkers Market Revenue Million Forecast, by Type 2019 & 2032
- Table 6: Global Cancer Biomarkers Market Volume K Unit Forecast, by Type 2019 & 2032
- Table 7: Global Cancer Biomarkers Market Revenue Million Forecast, by Profiling Technology 2019 & 2032
- Table 8: Global Cancer Biomarkers Market Volume K Unit Forecast, by Profiling Technology 2019 & 2032
- Table 9: Global Cancer Biomarkers Market Revenue Million Forecast, by Region 2019 & 2032
- Table 10: Global Cancer Biomarkers Market Volume K Unit Forecast, by Region 2019 & 2032
- Table 11: Global Cancer Biomarkers Market Revenue Million Forecast, by Country 2019 & 2032
- Table 12: Global Cancer Biomarkers Market Volume K Unit Forecast, by Country 2019 & 2032
- Table 13: United States Cancer Biomarkers Market Revenue (Million) Forecast, by Application 2019 & 2032
- Table 14: United States Cancer Biomarkers Market Volume (K Unit) Forecast, by Application 2019 & 2032
- Table 15: Canada Cancer Biomarkers Market Revenue (Million) Forecast, by Application 2019 & 2032
- Table 16: Canada Cancer Biomarkers Market Volume (K Unit) Forecast, by Application 2019 & 2032
- Table 17: Mexico Cancer Biomarkers Market Revenue (Million) Forecast, by Application 2019 & 2032
- Table 18: Mexico Cancer Biomarkers Market Volume (K Unit) Forecast, by Application 2019 & 2032
- Table 19: Global Cancer Biomarkers Market Revenue Million Forecast, by Country 2019 & 2032
- Table 20: Global Cancer Biomarkers Market Volume K Unit Forecast, by Country 2019 & 2032
- Table 21: Germany Cancer Biomarkers Market Revenue (Million) Forecast, by Application 2019 & 2032
- Table 22: Germany Cancer Biomarkers Market Volume (K Unit) Forecast, by Application 2019 & 2032
- Table 23: United Kingdom Cancer Biomarkers Market Revenue (Million) Forecast, by Application 2019 & 2032
- Table 24: United Kingdom Cancer Biomarkers Market Volume (K Unit) Forecast, by Application 2019 & 2032
- Table 25: France Cancer Biomarkers Market Revenue (Million) Forecast, by Application 2019 & 2032
- Table 26: France Cancer Biomarkers Market Volume (K Unit) Forecast, by Application 2019 & 2032
- Table 27: Italy Cancer Biomarkers Market Revenue (Million) Forecast, by Application 2019 & 2032
- Table 28: Italy Cancer Biomarkers Market Volume (K Unit) Forecast, by Application 2019 & 2032
- Table 29: Spain Cancer Biomarkers Market Revenue (Million) Forecast, by Application 2019 & 2032
- Table 30: Spain Cancer Biomarkers Market Volume (K Unit) Forecast, by Application 2019 & 2032
- Table 31: Rest of Europe Cancer Biomarkers Market Revenue (Million) Forecast, by Application 2019 & 2032
- Table 32: Rest of Europe Cancer Biomarkers Market Volume (K Unit) Forecast, by Application 2019 & 2032
- Table 33: Global Cancer Biomarkers Market Revenue Million Forecast, by Country 2019 & 2032
- Table 34: Global Cancer Biomarkers Market Volume K Unit Forecast, by Country 2019 & 2032
- Table 35: China Cancer Biomarkers Market Revenue (Million) Forecast, by Application 2019 & 2032
- Table 36: China Cancer Biomarkers Market Volume (K Unit) Forecast, by Application 2019 & 2032
- Table 37: Japan Cancer Biomarkers Market Revenue (Million) Forecast, by Application 2019 & 2032
- Table 38: Japan Cancer Biomarkers Market Volume (K Unit) Forecast, by Application 2019 & 2032
- Table 39: India Cancer Biomarkers Market Revenue (Million) Forecast, by Application 2019 & 2032
- Table 40: India Cancer Biomarkers Market Volume (K Unit) Forecast, by Application 2019 & 2032
- Table 41: Australia Cancer Biomarkers Market Revenue (Million) Forecast, by Application 2019 & 2032
- Table 42: Australia Cancer Biomarkers Market Volume (K Unit) Forecast, by Application 2019 & 2032
- Table 43: South Korea Cancer Biomarkers Market Revenue (Million) Forecast, by Application 2019 & 2032
- Table 44: South Korea Cancer Biomarkers Market Volume (K Unit) Forecast, by Application 2019 & 2032
- Table 45: Rest of Asia Pacific Cancer Biomarkers Market Revenue (Million) Forecast, by Application 2019 & 2032
- Table 46: Rest of Asia Pacific Cancer Biomarkers Market Volume (K Unit) Forecast, by Application 2019 & 2032
- Table 47: Global Cancer Biomarkers Market Revenue Million Forecast, by Country 2019 & 2032
- Table 48: Global Cancer Biomarkers Market Volume K Unit Forecast, by Country 2019 & 2032
- Table 49: GCC Cancer Biomarkers Market Revenue (Million) Forecast, by Application 2019 & 2032
- Table 50: GCC Cancer Biomarkers Market Volume (K Unit) Forecast, by Application 2019 & 2032
- Table 51: South Africa Cancer Biomarkers Market Revenue (Million) Forecast, by Application 2019 & 2032
- Table 52: South Africa Cancer Biomarkers Market Volume (K Unit) Forecast, by Application 2019 & 2032
- Table 53: Rest of Middle East and Africa Cancer Biomarkers Market Revenue (Million) Forecast, by Application 2019 & 2032
- Table 54: Rest of Middle East and Africa Cancer Biomarkers Market Volume (K Unit) Forecast, by Application 2019 & 2032
- Table 55: Global Cancer Biomarkers Market Revenue Million Forecast, by Country 2019 & 2032
- Table 56: Global Cancer Biomarkers Market Volume K Unit Forecast, by Country 2019 & 2032
- Table 57: Brazil Cancer Biomarkers Market Revenue (Million) Forecast, by Application 2019 & 2032
- Table 58: Brazil Cancer Biomarkers Market Volume (K Unit) Forecast, by Application 2019 & 2032
- Table 59: Argentina Cancer Biomarkers Market Revenue (Million) Forecast, by Application 2019 & 2032
- Table 60: Argentina Cancer Biomarkers Market Volume (K Unit) Forecast, by Application 2019 & 2032
- Table 61: Rest of South America Cancer Biomarkers Market Revenue (Million) Forecast, by Application 2019 & 2032
- Table 62: Rest of South America Cancer Biomarkers Market Volume (K Unit) Forecast, by Application 2019 & 2032
- Table 63: Global Cancer Biomarkers Market Revenue Million Forecast, by Disease 2019 & 2032
- Table 64: Global Cancer Biomarkers Market Volume K Unit Forecast, by Disease 2019 & 2032
- Table 65: Global Cancer Biomarkers Market Revenue Million Forecast, by Type 2019 & 2032
- Table 66: Global Cancer Biomarkers Market Volume K Unit Forecast, by Type 2019 & 2032
- Table 67: Global Cancer Biomarkers Market Revenue Million Forecast, by Profiling Technology 2019 & 2032
- Table 68: Global Cancer Biomarkers Market Volume K Unit Forecast, by Profiling Technology 2019 & 2032
- Table 69: Global Cancer Biomarkers Market Revenue Million Forecast, by Country 2019 & 2032
- Table 70: Global Cancer Biomarkers Market Volume K Unit Forecast, by Country 2019 & 2032
- Table 71: United States Cancer Biomarkers Market Revenue (Million) Forecast, by Application 2019 & 2032
- Table 72: United States Cancer Biomarkers Market Volume (K Unit) Forecast, by Application 2019 & 2032
- Table 73: Canada Cancer Biomarkers Market Revenue (Million) Forecast, by Application 2019 & 2032
- Table 74: Canada Cancer Biomarkers Market Volume (K Unit) Forecast, by Application 2019 & 2032
- Table 75: Mexico Cancer Biomarkers Market Revenue (Million) Forecast, by Application 2019 & 2032
- Table 76: Mexico Cancer Biomarkers Market Volume (K Unit) Forecast, by Application 2019 & 2032
- Table 77: Global Cancer Biomarkers Market Revenue Million Forecast, by Disease 2019 & 2032
- Table 78: Global Cancer Biomarkers Market Volume K Unit Forecast, by Disease 2019 & 2032
- Table 79: Global Cancer Biomarkers Market Revenue Million Forecast, by Type 2019 & 2032
- Table 80: Global Cancer Biomarkers Market Volume K Unit Forecast, by Type 2019 & 2032
- Table 81: Global Cancer Biomarkers Market Revenue Million Forecast, by Profiling Technology 2019 & 2032
- Table 82: Global Cancer Biomarkers Market Volume K Unit Forecast, by Profiling Technology 2019 & 2032
- Table 83: Global Cancer Biomarkers Market Revenue Million Forecast, by Country 2019 & 2032
- Table 84: Global Cancer Biomarkers Market Volume K Unit Forecast, by Country 2019 & 2032
- Table 85: Germany Cancer Biomarkers Market Revenue (Million) Forecast, by Application 2019 & 2032
- Table 86: Germany Cancer Biomarkers Market Volume (K Unit) Forecast, by Application 2019 & 2032
- Table 87: United Kingdom Cancer Biomarkers Market Revenue (Million) Forecast, by Application 2019 & 2032
- Table 88: United Kingdom Cancer Biomarkers Market Volume (K Unit) Forecast, by Application 2019 & 2032
- Table 89: France Cancer Biomarkers Market Revenue (Million) Forecast, by Application 2019 & 2032
- Table 90: France Cancer Biomarkers Market Volume (K Unit) Forecast, by Application 2019 & 2032
- Table 91: Italy Cancer Biomarkers Market Revenue (Million) Forecast, by Application 2019 & 2032
- Table 92: Italy Cancer Biomarkers Market Volume (K Unit) Forecast, by Application 2019 & 2032
- Table 93: Spain Cancer Biomarkers Market Revenue (Million) Forecast, by Application 2019 & 2032
- Table 94: Spain Cancer Biomarkers Market Volume (K Unit) Forecast, by Application 2019 & 2032
- Table 95: Rest of Europe Cancer Biomarkers Market Revenue (Million) Forecast, by Application 2019 & 2032
- Table 96: Rest of Europe Cancer Biomarkers Market Volume (K Unit) Forecast, by Application 2019 & 2032
- Table 97: Global Cancer Biomarkers Market Revenue Million Forecast, by Disease 2019 & 2032
- Table 98: Global Cancer Biomarkers Market Volume K Unit Forecast, by Disease 2019 & 2032
- Table 99: Global Cancer Biomarkers Market Revenue Million Forecast, by Type 2019 & 2032
- Table 100: Global Cancer Biomarkers Market Volume K Unit Forecast, by Type 2019 & 2032
- Table 101: Global Cancer Biomarkers Market Revenue Million Forecast, by Profiling Technology 2019 & 2032
- Table 102: Global Cancer Biomarkers Market Volume K Unit Forecast, by Profiling Technology 2019 & 2032
- Table 103: Global Cancer Biomarkers Market Revenue Million Forecast, by Country 2019 & 2032
- Table 104: Global Cancer Biomarkers Market Volume K Unit Forecast, by Country 2019 & 2032
- Table 105: China Cancer Biomarkers Market Revenue (Million) Forecast, by Application 2019 & 2032
- Table 106: China Cancer Biomarkers Market Volume (K Unit) Forecast, by Application 2019 & 2032
- Table 107: Japan Cancer Biomarkers Market Revenue (Million) Forecast, by Application 2019 & 2032
- Table 108: Japan Cancer Biomarkers Market Volume (K Unit) Forecast, by Application 2019 & 2032
- Table 109: India Cancer Biomarkers Market Revenue (Million) Forecast, by Application 2019 & 2032
- Table 110: India Cancer Biomarkers Market Volume (K Unit) Forecast, by Application 2019 & 2032
- Table 111: Australia Cancer Biomarkers Market Revenue (Million) Forecast, by Application 2019 & 2032
- Table 112: Australia Cancer Biomarkers Market Volume (K Unit) Forecast, by Application 2019 & 2032
- Table 113: South Korea Cancer Biomarkers Market Revenue (Million) Forecast, by Application 2019 & 2032
- Table 114: South Korea Cancer Biomarkers Market Volume (K Unit) Forecast, by Application 2019 & 2032
- Table 115: Rest of Asia Pacific Cancer Biomarkers Market Revenue (Million) Forecast, by Application 2019 & 2032
- Table 116: Rest of Asia Pacific Cancer Biomarkers Market Volume (K Unit) Forecast, by Application 2019 & 2032
- Table 117: Global Cancer Biomarkers Market Revenue Million Forecast, by Disease 2019 & 2032
- Table 118: Global Cancer Biomarkers Market Volume K Unit Forecast, by Disease 2019 & 2032
- Table 119: Global Cancer Biomarkers Market Revenue Million Forecast, by Type 2019 & 2032
- Table 120: Global Cancer Biomarkers Market Volume K Unit Forecast, by Type 2019 & 2032
- Table 121: Global Cancer Biomarkers Market Revenue Million Forecast, by Profiling Technology 2019 & 2032
- Table 122: Global Cancer Biomarkers Market Volume K Unit Forecast, by Profiling Technology 2019 & 2032
- Table 123: Global Cancer Biomarkers Market Revenue Million Forecast, by Country 2019 & 2032
- Table 124: Global Cancer Biomarkers Market Volume K Unit Forecast, by Country 2019 & 2032
- Table 125: GCC Cancer Biomarkers Market Revenue (Million) Forecast, by Application 2019 & 2032
- Table 126: GCC Cancer Biomarkers Market Volume (K Unit) Forecast, by Application 2019 & 2032
- Table 127: South Africa Cancer Biomarkers Market Revenue (Million) Forecast, by Application 2019 & 2032
- Table 128: South Africa Cancer Biomarkers Market Volume (K Unit) Forecast, by Application 2019 & 2032
- Table 129: Rest of Middle East and Africa Cancer Biomarkers Market Revenue (Million) Forecast, by Application 2019 & 2032
- Table 130: Rest of Middle East and Africa Cancer Biomarkers Market Volume (K Unit) Forecast, by Application 2019 & 2032
- Table 131: Global Cancer Biomarkers Market Revenue Million Forecast, by Disease 2019 & 2032
- Table 132: Global Cancer Biomarkers Market Volume K Unit Forecast, by Disease 2019 & 2032
- Table 133: Global Cancer Biomarkers Market Revenue Million Forecast, by Type 2019 & 2032
- Table 134: Global Cancer Biomarkers Market Volume K Unit Forecast, by Type 2019 & 2032
- Table 135: Global Cancer Biomarkers Market Revenue Million Forecast, by Profiling Technology 2019 & 2032
- Table 136: Global Cancer Biomarkers Market Volume K Unit Forecast, by Profiling Technology 2019 & 2032
- Table 137: Global Cancer Biomarkers Market Revenue Million Forecast, by Country 2019 & 2032
- Table 138: Global Cancer Biomarkers Market Volume K Unit Forecast, by Country 2019 & 2032
- Table 139: Brazil Cancer Biomarkers Market Revenue (Million) Forecast, by Application 2019 & 2032
- Table 140: Brazil Cancer Biomarkers Market Volume (K Unit) Forecast, by Application 2019 & 2032
- Table 141: Argentina Cancer Biomarkers Market Revenue (Million) Forecast, by Application 2019 & 2032
- Table 142: Argentina Cancer Biomarkers Market Volume (K Unit) Forecast, by Application 2019 & 2032
- Table 143: Rest of South America Cancer Biomarkers Market Revenue (Million) Forecast, by Application 2019 & 2032
- Table 144: Rest of South America Cancer Biomarkers Market Volume (K Unit) Forecast, by Application 2019 & 2032
Frequently Asked Questions
1. What is the projected Compound Annual Growth Rate (CAGR) of the Cancer Biomarkers Market?
The projected CAGR is approximately 12.43%.
2. Which companies are prominent players in the Cancer Biomarkers Market?
Key companies in the market include Merck Millipore, Biomerieux, F Hoffmann-La Roche Ltd, Hologic Inc, Quest Diagnostics, Qiagen, Thermo Fisher Scientific, Illumina Inc, Abbott Laboratories Inc, Agilent Technologies.
3. What are the main segments of the Cancer Biomarkers Market?
The market segments include Disease, Type, Profiling Technology.
4. Can you provide details about the market size?
The market size is estimated to be USD 23.26 Million as of 2022.
5. What are some drivers contributing to market growth?
Surge in Prevalence of Cancer Across the Globe; Paradigm Shift in Healthcare from Disease Diagnosis to Risk Assessment or Early Diagnosis; Increasing Focus on Innovative Drug Development.
6. What are the notable trends driving market growth?
Lung Cancer Segment is Expected to Hold a Significant Market Share in the Cancer Biomarkers Market.
7. Are there any restraints impacting market growth?
High Cost of Cancer Diagnosis with Biomarkers; Reimbursement Issues with Biomarker Testing.
8. Can you provide examples of recent developments in the market?
February 2022: OncoDNA introduced the OncoDEEP Solid Tumor Biomarker Test Kit. The OncoDEEP kit, which includes Twist Bioscience's enrichment and library preparation solutions, will give labs a complete and reliable solution for performing comprehensive NGS analysis of tumor samples.
9. What pricing options are available for accessing the report?
Pricing options include single-user, multi-user, and enterprise licenses priced at USD 4750, USD 5250, and USD 8750 respectively.
10. Is the market size provided in terms of value or volume?
The market size is provided in terms of value, measured in Million and volume, measured in K Unit.
11. Are there any specific market keywords associated with the report?
Yes, the market keyword associated with the report is "Cancer Biomarkers Market," which aids in identifying and referencing the specific market segment covered.
12. How do I determine which pricing option suits my needs best?
The pricing options vary based on user requirements and access needs. Individual users may opt for single-user licenses, while businesses requiring broader access may choose multi-user or enterprise licenses for cost-effective access to the report.
13. Are there any additional resources or data provided in the Cancer Biomarkers Market report?
While the report offers comprehensive insights, it's advisable to review the specific contents or supplementary materials provided to ascertain if additional resources or data are available.
14. How can I stay updated on further developments or reports in the Cancer Biomarkers Market?
To stay informed about further developments, trends, and reports in the Cancer Biomarkers Market, consider subscribing to industry newsletters, following relevant companies and organizations, or regularly checking reputable industry news sources and publications.
Methodology
Step 1 - Identification of Relevant Samples Size from Population Database


Step 2 - Approaches for Defining Global Market Size (Value, Volume* & Price*)

Note*: In applicable scenarios
Step 3 - Data Sources
Primary Research
- Web Analytics
- Survey Reports
- Research Institute
- Latest Research Reports
- Opinion Leaders
Secondary Research
- Annual Reports
- White Paper
- Latest Press Release
- Industry Association
- Paid Database
- Investor Presentations

Step 4 - Data Triangulation
Involves using different sources of information in order to increase the validity of a study
These sources are likely to be stakeholders in a program - participants, other researchers, program staff, other community members, and so on.
Then we put all data in single framework & apply various statistical tools to find out the dynamic on the market.
During the analysis stage, feedback from the stakeholder groups would be compared to determine areas of agreement as well as areas of divergence
