

Key Insights
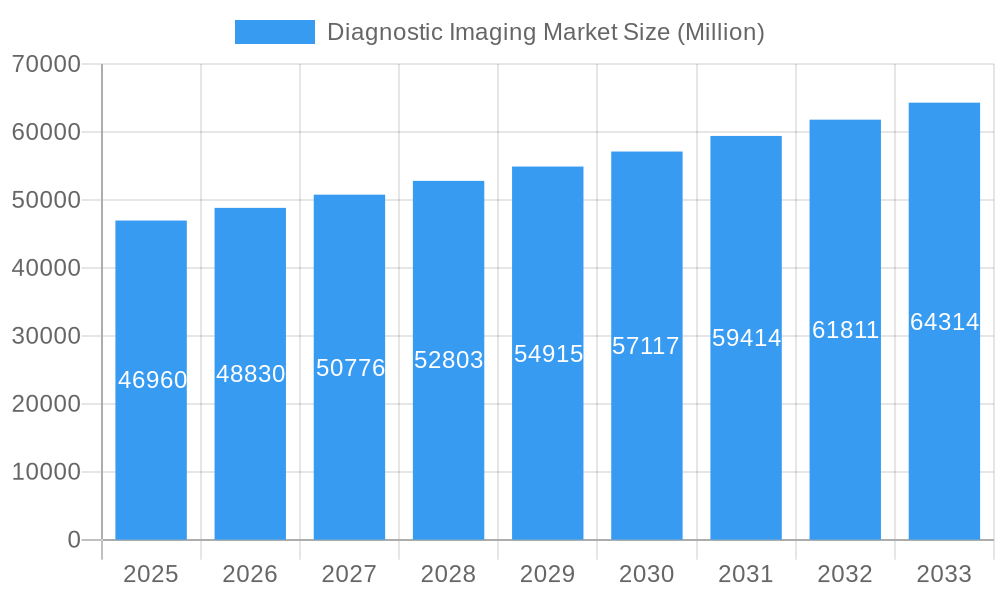
The global diagnostic imaging market, valued at $46.96 billion in 2025, is projected to experience robust growth, driven by several key factors. Technological advancements, such as the development of AI-powered image analysis and improved resolution in various modalities (X-ray, CT, MRI, Ultrasound, and Nuclear Imaging), are significantly enhancing diagnostic accuracy and efficiency. This leads to earlier and more precise disease detection, improved patient outcomes, and increased demand for these services across diverse applications. The aging global population, coupled with rising prevalence of chronic diseases like cancer, cardiovascular conditions, and neurological disorders, further fuels market expansion. Growth is particularly strong in emerging economies where healthcare infrastructure is rapidly developing and access to advanced diagnostic tools is increasing. While regulatory hurdles and high equipment costs present some challenges, the overall market outlook remains positive, with substantial growth opportunities across various segments. The strong presence of established players like GE Healthcare, Siemens Healthineers, and Philips, alongside the emergence of innovative companies, contributes to a dynamic and competitive market landscape. Segmentation by application (cardiology, oncology, etc.) and end-user (hospitals, diagnostic centers) reveals specific growth trajectories, allowing for targeted investment and strategic market penetration.
Diagnostic Imaging Market Market Size (In Billion)
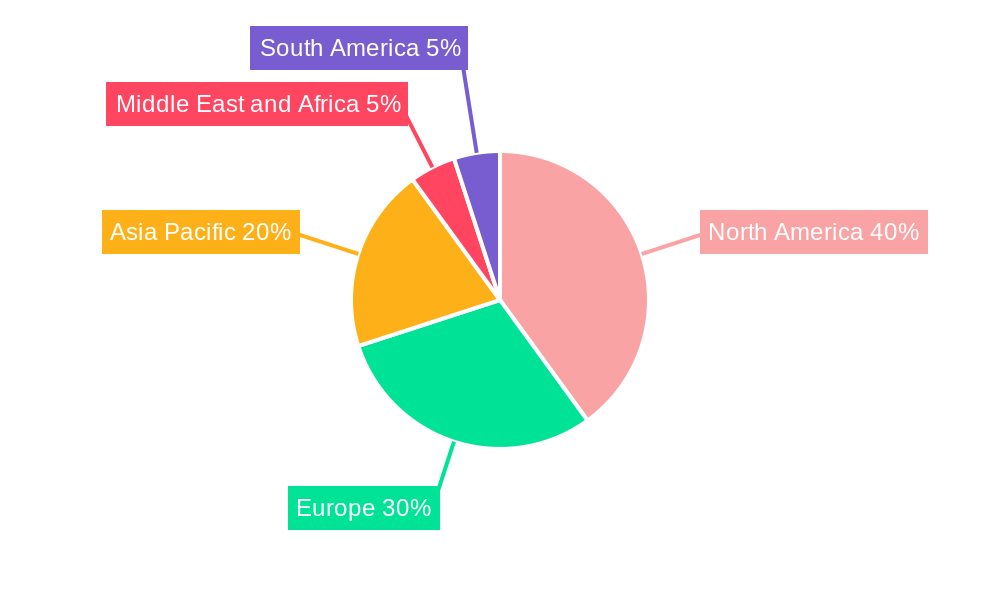
Significant regional variations exist. North America currently holds a large market share due to advanced healthcare infrastructure and high adoption rates of cutting-edge technologies. However, Asia-Pacific is anticipated to exhibit the fastest growth rate during the forecast period (2025-2033) driven by increasing healthcare expenditure and a growing middle class with improved access to healthcare services. Europe maintains a considerable market share, benefiting from established healthcare systems and consistent technological investments. The Middle East and Africa, while showing slower growth compared to the Asia-Pacific region, are expected to witness increasing demand due to government initiatives to improve healthcare infrastructure and rising awareness of the importance of early diagnosis. South America is expected to show moderate growth, influenced by economic factors and healthcare infrastructure development within the region. The ongoing integration of data analytics and cloud computing will further propel market growth by enabling remote diagnostics, improved workflow efficiency, and enhanced data security.
Diagnostic Imaging Market Company Market Share
Diagnostic Imaging Market Report: A Comprehensive Analysis 2019-2033
This dynamic report provides a comprehensive analysis of the Diagnostic Imaging Market, offering invaluable insights for stakeholders across the healthcare industry. With a detailed study period spanning 2019-2033 (base year 2025, forecast period 2025-2033), this report leverages high-impact keywords to enhance search visibility and deliver actionable intelligence. The market is projected to reach xx Million by 2033, exhibiting a robust CAGR of xx%.
Diagnostic Imaging Market Structure & Competitive Landscape
The Diagnostic Imaging market is characterized by a moderately consolidated structure, with several key players holding significant market share. The Herfindahl-Hirschman Index (HHI) is estimated at xx, indicating a moderately competitive landscape. Key innovation drivers include advancements in AI-powered image analysis, miniaturization of devices, and the development of hybrid imaging modalities. Stringent regulatory frameworks, particularly concerning data privacy and device safety (e.g., FDA approvals in the US and CE markings in Europe), significantly impact market dynamics. Product substitutes, such as advanced blood tests and molecular diagnostics, present a degree of competitive pressure, though the need for visual confirmation often maintains demand for imaging.
End-user segmentation is critical, with hospitals accounting for the largest share (xx%), followed by diagnostic centers (xx%) and other end-users (xx%). The market witnesses frequent mergers and acquisitions (M&A) activity, with an estimated xx M&A deals occurring between 2019 and 2024. These transactions often involve smaller companies being acquired by larger players to expand their product portfolios and geographical reach.
- Market Concentration: Moderately Consolidated (HHI: xx)
- Innovation Drivers: AI-powered image analysis, miniaturization, hybrid modalities
- Regulatory Impacts: Stringent regulations on data privacy and device safety
- Product Substitutes: Advanced blood tests, molecular diagnostics
- End-User Segmentation: Hospitals (xx%), Diagnostic Centers (xx%), Other (xx%)
- M&A Activity: xx deals between 2019 and 2024
Diagnostic Imaging Market Trends & Opportunities
The global diagnostic imaging market is experiencing substantial growth, driven by several key trends. The rising prevalence of chronic diseases, such as cancer and cardiovascular diseases, necessitates increased diagnostic testing, fueling market expansion. Technological advancements, particularly in AI and machine learning, are improving image quality, diagnostic accuracy, and workflow efficiency. This is leading to a shift towards more sophisticated and integrated imaging systems. Consumer preferences are increasingly focused on minimally invasive procedures, faster scan times, and more personalized healthcare solutions.
Competitive dynamics are shaped by ongoing innovation, strategic partnerships, and a focus on expanding market share globally. The market is witnessing a growing adoption of cloud-based solutions for image storage and analysis, improving accessibility and collaboration. The increasing adoption of telehealth and remote diagnostics is also driving market growth, offering more convenient and accessible care. The market is further propelled by favorable government initiatives, including increased healthcare spending and investments in medical infrastructure in developing economies. This is reflected in a projected market value of xx Million by 2033, with a CAGR of xx% during the forecast period.
Dominant Markets & Segments in Diagnostic Imaging Market
The North American region currently holds the largest share of the diagnostic imaging market, driven by advanced healthcare infrastructure, high technological adoption, and substantial investments in research and development. Within this region, the United States is the dominant market. However, Asia Pacific is projected to witness the fastest growth rate during the forecast period, fueled by rising disposable incomes, increased healthcare awareness, and expanding healthcare infrastructure.
Among the application segments, Cardiology holds the largest market share due to high prevalence of cardiovascular diseases, followed by Oncology and Neurology. Hospitals remain the dominant end-users globally, but the diagnostic imaging centers segment shows strong growth potential. In terms of modality, Computed Tomography (CT) scans and Magnetic Resonance Imaging (MRI) are the fastest-growing segments, owing to their superior diagnostic capabilities.
- Leading Region: North America (United States being dominant)
- Fastest Growing Region: Asia Pacific
- Largest Application Segment: Cardiology
- Fastest Growing Application Segments: Oncology and Neurology
- Dominant End-User: Hospitals
- Fastest Growing Modality: CT and MRI
Key Growth Drivers:
- Advanced healthcare infrastructure and high technological adoption in developed regions.
- Rising prevalence of chronic diseases globally.
- Increased healthcare spending and government initiatives.
- Growing adoption of minimally invasive procedures and personalized healthcare.
- Expanding healthcare infrastructure in developing economies, especially in Asia Pacific.
Diagnostic Imaging Market Product Analysis
Recent product innovations focus on enhancing image quality, reducing scan times, and improving workflow efficiency. Companies are integrating AI and machine learning to automate image analysis and improve diagnostic accuracy. These advancements lead to faster diagnosis, improved patient outcomes, and increased efficiency for healthcare providers. The market is witnessing the rise of hybrid imaging systems, combining multiple modalities for comprehensive diagnostic capabilities. The competitive advantage often lies in the combination of superior image quality, streamlined workflow, and affordability.
Key Drivers, Barriers & Challenges in Diagnostic Imaging Market
Key Drivers:
Technological advancements like AI-driven image analysis and hybrid imaging systems are driving substantial market growth. Rising prevalence of chronic diseases and an aging global population further increase demand for diagnostic imaging. Favorable government regulations and initiatives supporting healthcare infrastructure development provide a strong impetus for market expansion. For instance, increased healthcare spending in emerging markets fuels market growth.
Key Challenges and Restraints:
High costs associated with advanced imaging systems create a barrier to entry for many healthcare providers, particularly in developing countries. Stringent regulatory approvals for new technologies can delay market penetration. Intense competition among established players and the emergence of new technologies impose significant pressure on pricing and profitability. Supply chain disruptions can impact the availability of critical components, causing delays in production and delivery. Estimates suggest that supply chain disruptions impacted market growth by approximately xx% in 2022.
Growth Drivers in the Diagnostic Imaging Market Market
The increasing prevalence of chronic diseases, coupled with the rising geriatric population, is a significant driver of market growth. Advancements in imaging technology, such as AI-powered image analysis and the development of more portable and cost-effective systems, are expanding access to diagnostic imaging. Government initiatives promoting healthcare infrastructure development and increased healthcare spending further fuel market growth. Finally, the growing adoption of telemedicine and remote diagnostics is expanding access to care, contributing to market growth.
Challenges Impacting Diagnostic Imaging Market Growth
High initial investment costs associated with purchasing and maintaining advanced imaging equipment pose a major barrier for smaller healthcare facilities. Stringent regulatory approvals and compliance requirements can significantly delay the launch of new products and hinder market expansion. The intense competition among established players and the emergence of new technological advancements create price pressures and limit profitability. Supply chain disruptions can affect the availability of critical components, affecting production and market access. These challenges necessitate strategic planning and adaptability for businesses operating within this market.
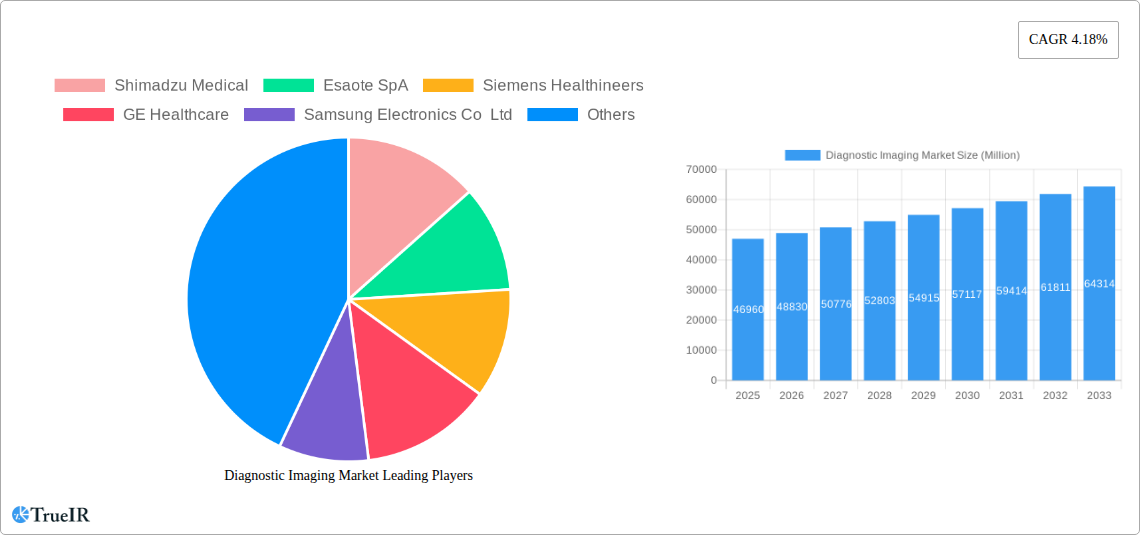
Key Players Shaping the Diagnostic Imaging Market Market
- Shimadzu Medical
- Esaote SpA
- Siemens Healthineers
- GE Healthcare
- Samsung Electronics Co Ltd
- Browns Medical Imaging (BMI)
- Mindray Medical International Limited
- FUJIFILM Holdings Corporation
- Koninklijke Philips NV
- Canon Medical Systems Corporation
- Hologic Corporation
- Koning Corporation
Significant Diagnostic Imaging Market Industry Milestones
- July 2022: Canon Medical launched the Vantage Fortain MRI System at ECR 2022. This system features innovative workflow solutions, image enhancements, and accelerated scan technology, reducing MRI procedure times. This launch significantly enhanced Canon Medical's competitive standing.
- April 2022: Wipro GE Healthcare launched the next-generation Revolution Aspire CT scanner, an advanced imaging solution designed and manufactured end-to-end in India. This signifies increased local manufacturing capabilities and potential market expansion in India and other developing regions.
Future Outlook for Diagnostic Imaging Market Market
The diagnostic imaging market is poised for continued growth, driven by technological advancements, increasing prevalence of chronic diseases, and favorable regulatory environments. Strategic opportunities lie in developing AI-powered solutions, expanding into emerging markets, and focusing on personalized medicine. The market potential is significant, with substantial growth expected across various segments, including advanced imaging modalities and hybrid systems. The integration of telehealth and remote diagnostics will further accelerate market expansion, enhancing access to care and driving overall market value.
Diagnostic Imaging Market Segmentation
-
1. Modality
-
1.1. MRI
- 1.1.1. Low and mid field MRI Systems (less than 1.5 T)
- 1.1.2. High field MRI Systems (1.5-3 T)
- 1.1.3. Very Hig
-
1.2. Computed Tomography
- 1.2.1. Low-end Scanners (~16-Slice)
- 1.2.2. Mid-range Scanners (~64-Slice)
- 1.2.3. High-end Scanners (128-Slice and More)
-
1.3. Ultrasound
- 1.3.1. 2D Ultrasound
- 1.3.2. 3D Ultrasound
- 1.3.3. Other Ultrasound
-
1.4. X-Ray
- 1.4.1. Analog Systems
- 1.4.2. Digital Systems
-
1.5. Nuclear Imaging
- 1.5.1. Positron Emission Tomography (PET)
- 1.5.2. Single Photon Emission Computed Tomography (SPECT)
- 1.6. Fluoroscopy
- 1.7. Mammography
-
1.1. MRI
-
2. Application
- 2.1. Cardiology
- 2.2. Oncology
- 2.3. Neurology
- 2.4. Orthopedics
- 2.5. Gastroenterology
- 2.6. Gynecology
- 2.7. Other Applications
-
3. End User
- 3.1. Hospital
- 3.2. Diagnostic Centers
- 3.3. Other End Users
Diagnostic Imaging Market Segmentation By Geography
-
1. North America
- 1.1. United States
- 1.2. Canada
- 1.3. Mexico
-
2. Europe
- 2.1. Germany
- 2.2. United Kingdom
- 2.3. France
- 2.4. Italy
- 2.5. Spain
- 2.6. Rest of Europe
-
3. Asia Pacific
- 3.1. China
- 3.2. Japan
- 3.3. India
- 3.4. Australia
- 3.5. South Korea
- 3.6. Rest of Asia Pacific
-
4. Middle East and Africa
- 4.1. GCC
- 4.2. South Africa
- 4.3. Rest of Middle East and Africa
-
5. South America
- 5.1. Brazil
- 5.2. Argentina
- 5.3. Rest of South America
Diagnostic Imaging Market Regional Market Share
Geographic Coverage of Diagnostic Imaging Market
Diagnostic Imaging Market REPORT HIGHLIGHTS
| Aspects | Details |
|---|---|
| Study Period | 2020-2034 |
| Base Year | 2025 |
| Estimated Year | 2026 |
| Forecast Period | 2026-2034 |
| Historical Period | 2020-2025 |
| Growth Rate | CAGR of 4.18% from 2020-2034 |
| Segmentation |
|
Table of Contents
- 1. Introduction
- 1.1. Research Scope
- 1.2. Market Segmentation
- 1.3. Research Objective
- 1.4. Definitions and Assumptions
- 2. Executive Summary
- 2.1. Market Snapshot
- 3. Market Dynamics
- 3.1. Market Drivers
- 3.2. Market Restrains
- 3.3. Market Trends
- 3.4. Market Opportunities
- 4. Market Factor Analysis
- 4.1. Porters Five Forces
- 4.1.1. Bargaining Power of Suppliers
- 4.1.2. Bargaining Power of Buyers
- 4.1.3. Threat of New Entrants
- 4.1.4. Threat of Substitutes
- 4.1.5. Competitive Rivalry
- 4.2. PESTEL analysis
- 4.3. BCG Analysis
- 4.3.1. Stars (High Growth, High Market Share)
- 4.3.2. Cash Cows (Low Growth, High Market Share)
- 4.3.3. Question Mark (High Growth, Low Market Share)
- 4.3.4. Dogs (Low Growth, Low Market Share)
- 4.4. Ansoff Matrix Analysis
- 4.5. Supply Chain Analysis
- 4.6. Regulatory Landscape
- 4.7. Current Market Potential and Opportunity Assessment (TAM–SAM–SOM Framework)
- 4.8. TIR Analyst Note
- 4.1. Porters Five Forces
- 5. Market Analysis, Insights and Forecast 2021-2033
- 5.1. Market Analysis, Insights and Forecast - by Modality
- 5.1.1. MRI
- 5.1.1.1. Low and mid field MRI Systems (less than 1.5 T)
- 5.1.1.2. High field MRI Systems (1.5-3 T)
- 5.1.1.3. Very Hig
- 5.1.2. Computed Tomography
- 5.1.2.1. Low-end Scanners (~16-Slice)
- 5.1.2.2. Mid-range Scanners (~64-Slice)
- 5.1.2.3. High-end Scanners (128-Slice and More)
- 5.1.3. Ultrasound
- 5.1.3.1. 2D Ultrasound
- 5.1.3.2. 3D Ultrasound
- 5.1.3.3. Other Ultrasound
- 5.1.4. X-Ray
- 5.1.4.1. Analog Systems
- 5.1.4.2. Digital Systems
- 5.1.5. Nuclear Imaging
- 5.1.5.1. Positron Emission Tomography (PET)
- 5.1.5.2. Single Photon Emission Computed Tomography (SPECT)
- 5.1.6. Fluoroscopy
- 5.1.7. Mammography
- 5.1.1. MRI
- 5.2. Market Analysis, Insights and Forecast - by Application
- 5.2.1. Cardiology
- 5.2.2. Oncology
- 5.2.3. Neurology
- 5.2.4. Orthopedics
- 5.2.5. Gastroenterology
- 5.2.6. Gynecology
- 5.2.7. Other Applications
- 5.3. Market Analysis, Insights and Forecast - by End User
- 5.3.1. Hospital
- 5.3.2. Diagnostic Centers
- 5.3.3. Other End Users
- 5.4. Market Analysis, Insights and Forecast - by Region
- 5.4.1. North America
- 5.4.2. Europe
- 5.4.3. Asia Pacific
- 5.4.4. Middle East and Africa
- 5.4.5. South America
- 5.1. Market Analysis, Insights and Forecast - by Modality
- 6. Global Diagnostic Imaging Market Analysis, Insights and Forecast, 2021-2033
- 6.1. Market Analysis, Insights and Forecast - by Modality
- 6.1.1. MRI
- 6.1.1.1. Low and mid field MRI Systems (less than 1.5 T)
- 6.1.1.2. High field MRI Systems (1.5-3 T)
- 6.1.1.3. Very Hig
- 6.1.2. Computed Tomography
- 6.1.2.1. Low-end Scanners (~16-Slice)
- 6.1.2.2. Mid-range Scanners (~64-Slice)
- 6.1.2.3. High-end Scanners (128-Slice and More)
- 6.1.3. Ultrasound
- 6.1.3.1. 2D Ultrasound
- 6.1.3.2. 3D Ultrasound
- 6.1.3.3. Other Ultrasound
- 6.1.4. X-Ray
- 6.1.4.1. Analog Systems
- 6.1.4.2. Digital Systems
- 6.1.5. Nuclear Imaging
- 6.1.5.1. Positron Emission Tomography (PET)
- 6.1.5.2. Single Photon Emission Computed Tomography (SPECT)
- 6.1.6. Fluoroscopy
- 6.1.7. Mammography
- 6.1.1. MRI
- 6.2. Market Analysis, Insights and Forecast - by Application
- 6.2.1. Cardiology
- 6.2.2. Oncology
- 6.2.3. Neurology
- 6.2.4. Orthopedics
- 6.2.5. Gastroenterology
- 6.2.6. Gynecology
- 6.2.7. Other Applications
- 6.3. Market Analysis, Insights and Forecast - by End User
- 6.3.1. Hospital
- 6.3.2. Diagnostic Centers
- 6.3.3. Other End Users
- 6.1. Market Analysis, Insights and Forecast - by Modality
- 7. North America Diagnostic Imaging Market Analysis, Insights and Forecast, 2020-2032
- 7.1. Market Analysis, Insights and Forecast - by Modality
- 7.1.1. MRI
- 7.1.1.1. Low and mid field MRI Systems (less than 1.5 T)
- 7.1.1.2. High field MRI Systems (1.5-3 T)
- 7.1.1.3. Very Hig
- 7.1.2. Computed Tomography
- 7.1.2.1. Low-end Scanners (~16-Slice)
- 7.1.2.2. Mid-range Scanners (~64-Slice)
- 7.1.2.3. High-end Scanners (128-Slice and More)
- 7.1.3. Ultrasound
- 7.1.3.1. 2D Ultrasound
- 7.1.3.2. 3D Ultrasound
- 7.1.3.3. Other Ultrasound
- 7.1.4. X-Ray
- 7.1.4.1. Analog Systems
- 7.1.4.2. Digital Systems
- 7.1.5. Nuclear Imaging
- 7.1.5.1. Positron Emission Tomography (PET)
- 7.1.5.2. Single Photon Emission Computed Tomography (SPECT)
- 7.1.6. Fluoroscopy
- 7.1.7. Mammography
- 7.1.1. MRI
- 7.2. Market Analysis, Insights and Forecast - by Application
- 7.2.1. Cardiology
- 7.2.2. Oncology
- 7.2.3. Neurology
- 7.2.4. Orthopedics
- 7.2.5. Gastroenterology
- 7.2.6. Gynecology
- 7.2.7. Other Applications
- 7.3. Market Analysis, Insights and Forecast - by End User
- 7.3.1. Hospital
- 7.3.2. Diagnostic Centers
- 7.3.3. Other End Users
- 7.1. Market Analysis, Insights and Forecast - by Modality
- 8. Europe Diagnostic Imaging Market Analysis, Insights and Forecast, 2020-2032
- 8.1. Market Analysis, Insights and Forecast - by Modality
- 8.1.1. MRI
- 8.1.1.1. Low and mid field MRI Systems (less than 1.5 T)
- 8.1.1.2. High field MRI Systems (1.5-3 T)
- 8.1.1.3. Very Hig
- 8.1.2. Computed Tomography
- 8.1.2.1. Low-end Scanners (~16-Slice)
- 8.1.2.2. Mid-range Scanners (~64-Slice)
- 8.1.2.3. High-end Scanners (128-Slice and More)
- 8.1.3. Ultrasound
- 8.1.3.1. 2D Ultrasound
- 8.1.3.2. 3D Ultrasound
- 8.1.3.3. Other Ultrasound
- 8.1.4. X-Ray
- 8.1.4.1. Analog Systems
- 8.1.4.2. Digital Systems
- 8.1.5. Nuclear Imaging
- 8.1.5.1. Positron Emission Tomography (PET)
- 8.1.5.2. Single Photon Emission Computed Tomography (SPECT)
- 8.1.6. Fluoroscopy
- 8.1.7. Mammography
- 8.1.1. MRI
- 8.2. Market Analysis, Insights and Forecast - by Application
- 8.2.1. Cardiology
- 8.2.2. Oncology
- 8.2.3. Neurology
- 8.2.4. Orthopedics
- 8.2.5. Gastroenterology
- 8.2.6. Gynecology
- 8.2.7. Other Applications
- 8.3. Market Analysis, Insights and Forecast - by End User
- 8.3.1. Hospital
- 8.3.2. Diagnostic Centers
- 8.3.3. Other End Users
- 8.1. Market Analysis, Insights and Forecast - by Modality
- 9. Asia Pacific Diagnostic Imaging Market Analysis, Insights and Forecast, 2020-2032
- 9.1. Market Analysis, Insights and Forecast - by Modality
- 9.1.1. MRI
- 9.1.1.1. Low and mid field MRI Systems (less than 1.5 T)
- 9.1.1.2. High field MRI Systems (1.5-3 T)
- 9.1.1.3. Very Hig
- 9.1.2. Computed Tomography
- 9.1.2.1. Low-end Scanners (~16-Slice)
- 9.1.2.2. Mid-range Scanners (~64-Slice)
- 9.1.2.3. High-end Scanners (128-Slice and More)
- 9.1.3. Ultrasound
- 9.1.3.1. 2D Ultrasound
- 9.1.3.2. 3D Ultrasound
- 9.1.3.3. Other Ultrasound
- 9.1.4. X-Ray
- 9.1.4.1. Analog Systems
- 9.1.4.2. Digital Systems
- 9.1.5. Nuclear Imaging
- 9.1.5.1. Positron Emission Tomography (PET)
- 9.1.5.2. Single Photon Emission Computed Tomography (SPECT)
- 9.1.6. Fluoroscopy
- 9.1.7. Mammography
- 9.1.1. MRI
- 9.2. Market Analysis, Insights and Forecast - by Application
- 9.2.1. Cardiology
- 9.2.2. Oncology
- 9.2.3. Neurology
- 9.2.4. Orthopedics
- 9.2.5. Gastroenterology
- 9.2.6. Gynecology
- 9.2.7. Other Applications
- 9.3. Market Analysis, Insights and Forecast - by End User
- 9.3.1. Hospital
- 9.3.2. Diagnostic Centers
- 9.3.3. Other End Users
- 9.1. Market Analysis, Insights and Forecast - by Modality
- 10. Middle East and Africa Diagnostic Imaging Market Analysis, Insights and Forecast, 2020-2032
- 10.1. Market Analysis, Insights and Forecast - by Modality
- 10.1.1. MRI
- 10.1.1.1. Low and mid field MRI Systems (less than 1.5 T)
- 10.1.1.2. High field MRI Systems (1.5-3 T)
- 10.1.1.3. Very Hig
- 10.1.2. Computed Tomography
- 10.1.2.1. Low-end Scanners (~16-Slice)
- 10.1.2.2. Mid-range Scanners (~64-Slice)
- 10.1.2.3. High-end Scanners (128-Slice and More)
- 10.1.3. Ultrasound
- 10.1.3.1. 2D Ultrasound
- 10.1.3.2. 3D Ultrasound
- 10.1.3.3. Other Ultrasound
- 10.1.4. X-Ray
- 10.1.4.1. Analog Systems
- 10.1.4.2. Digital Systems
- 10.1.5. Nuclear Imaging
- 10.1.5.1. Positron Emission Tomography (PET)
- 10.1.5.2. Single Photon Emission Computed Tomography (SPECT)
- 10.1.6. Fluoroscopy
- 10.1.7. Mammography
- 10.1.1. MRI
- 10.2. Market Analysis, Insights and Forecast - by Application
- 10.2.1. Cardiology
- 10.2.2. Oncology
- 10.2.3. Neurology
- 10.2.4. Orthopedics
- 10.2.5. Gastroenterology
- 10.2.6. Gynecology
- 10.2.7. Other Applications
- 10.3. Market Analysis, Insights and Forecast - by End User
- 10.3.1. Hospital
- 10.3.2. Diagnostic Centers
- 10.3.3. Other End Users
- 10.1. Market Analysis, Insights and Forecast - by Modality
- 11. South America Diagnostic Imaging Market Analysis, Insights and Forecast, 2020-2032
- 11.1. Market Analysis, Insights and Forecast - by Modality
- 11.1.1. MRI
- 11.1.1.1. Low and mid field MRI Systems (less than 1.5 T)
- 11.1.1.2. High field MRI Systems (1.5-3 T)
- 11.1.1.3. Very Hig
- 11.1.2. Computed Tomography
- 11.1.2.1. Low-end Scanners (~16-Slice)
- 11.1.2.2. Mid-range Scanners (~64-Slice)
- 11.1.2.3. High-end Scanners (128-Slice and More)
- 11.1.3. Ultrasound
- 11.1.3.1. 2D Ultrasound
- 11.1.3.2. 3D Ultrasound
- 11.1.3.3. Other Ultrasound
- 11.1.4. X-Ray
- 11.1.4.1. Analog Systems
- 11.1.4.2. Digital Systems
- 11.1.5. Nuclear Imaging
- 11.1.5.1. Positron Emission Tomography (PET)
- 11.1.5.2. Single Photon Emission Computed Tomography (SPECT)
- 11.1.6. Fluoroscopy
- 11.1.7. Mammography
- 11.1.1. MRI
- 11.2. Market Analysis, Insights and Forecast - by Application
- 11.2.1. Cardiology
- 11.2.2. Oncology
- 11.2.3. Neurology
- 11.2.4. Orthopedics
- 11.2.5. Gastroenterology
- 11.2.6. Gynecology
- 11.2.7. Other Applications
- 11.3. Market Analysis, Insights and Forecast - by End User
- 11.3.1. Hospital
- 11.3.2. Diagnostic Centers
- 11.3.3. Other End Users
- 11.1. Market Analysis, Insights and Forecast - by Modality
- 12. Competitive Analysis
- 12.1. Company Profiles
- 12.1.1 Shimadzu Medical
- 12.1.1.1. Company Overview
- 12.1.1.2. Products
- 12.1.1.3. Company Financials
- 12.1.1.4. SWOT Analysis
- 12.1.2 Esaote SpA
- 12.1.2.1. Company Overview
- 12.1.2.2. Products
- 12.1.2.3. Company Financials
- 12.1.2.4. SWOT Analysis
- 12.1.3 Siemens Healthineers
- 12.1.3.1. Company Overview
- 12.1.3.2. Products
- 12.1.3.3. Company Financials
- 12.1.3.4. SWOT Analysis
- 12.1.4 GE Healthcare
- 12.1.4.1. Company Overview
- 12.1.4.2. Products
- 12.1.4.3. Company Financials
- 12.1.4.4. SWOT Analysis
- 12.1.5 Samsung Electronics Co Ltd
- 12.1.5.1. Company Overview
- 12.1.5.2. Products
- 12.1.5.3. Company Financials
- 12.1.5.4. SWOT Analysis
- 12.1.6 Browns Medical Imaging (BMI)
- 12.1.6.1. Company Overview
- 12.1.6.2. Products
- 12.1.6.3. Company Financials
- 12.1.6.4. SWOT Analysis
- 12.1.7 Mindray Medical International Limited
- 12.1.7.1. Company Overview
- 12.1.7.2. Products
- 12.1.7.3. Company Financials
- 12.1.7.4. SWOT Analysis
- 12.1.8 FUJIFILM Holdings Corporation
- 12.1.8.1. Company Overview
- 12.1.8.2. Products
- 12.1.8.3. Company Financials
- 12.1.8.4. SWOT Analysis
- 12.1.9 Koninklijke Philips NV
- 12.1.9.1. Company Overview
- 12.1.9.2. Products
- 12.1.9.3. Company Financials
- 12.1.9.4. SWOT Analysis
- 12.1.10 Canon Medical Systems Corporation
- 12.1.10.1. Company Overview
- 12.1.10.2. Products
- 12.1.10.3. Company Financials
- 12.1.10.4. SWOT Analysis
- 12.1.11 Hologic Corporation
- 12.1.11.1. Company Overview
- 12.1.11.2. Products
- 12.1.11.3. Company Financials
- 12.1.11.4. SWOT Analysis
- 12.1.12 Koning Corporation*List Not Exhaustive
- 12.1.12.1. Company Overview
- 12.1.12.2. Products
- 12.1.12.3. Company Financials
- 12.1.12.4. SWOT Analysis
- 12.1.1 Shimadzu Medical
- 12.2. Market Entropy
- 12.2.1 Company's Key Areas Served
- 12.2.2 Recent Developments
- 12.3. Company Market Share Analysis 2025
- 12.3.1 Top 5 Companies Market Share Analysis
- 12.3.2 Top 3 Companies Market Share Analysis
- 12.4. List of Potential Customers
- 13. Research Methodology
List of Figures
- Figure 1: Global Diagnostic Imaging Market Revenue Breakdown (Million, %) by Region 2025 & 2033
- Figure 2: North America Diagnostic Imaging Market Revenue (Million), by Modality 2025 & 2033
- Figure 3: North America Diagnostic Imaging Market Revenue Share (%), by Modality 2025 & 2033
- Figure 4: North America Diagnostic Imaging Market Revenue (Million), by Application 2025 & 2033
- Figure 5: North America Diagnostic Imaging Market Revenue Share (%), by Application 2025 & 2033
- Figure 6: North America Diagnostic Imaging Market Revenue (Million), by End User 2025 & 2033
- Figure 7: North America Diagnostic Imaging Market Revenue Share (%), by End User 2025 & 2033
- Figure 8: North America Diagnostic Imaging Market Revenue (Million), by Country 2025 & 2033
- Figure 9: North America Diagnostic Imaging Market Revenue Share (%), by Country 2025 & 2033
- Figure 10: Europe Diagnostic Imaging Market Revenue (Million), by Modality 2025 & 2033
- Figure 11: Europe Diagnostic Imaging Market Revenue Share (%), by Modality 2025 & 2033
- Figure 12: Europe Diagnostic Imaging Market Revenue (Million), by Application 2025 & 2033
- Figure 13: Europe Diagnostic Imaging Market Revenue Share (%), by Application 2025 & 2033
- Figure 14: Europe Diagnostic Imaging Market Revenue (Million), by End User 2025 & 2033
- Figure 15: Europe Diagnostic Imaging Market Revenue Share (%), by End User 2025 & 2033
- Figure 16: Europe Diagnostic Imaging Market Revenue (Million), by Country 2025 & 2033
- Figure 17: Europe Diagnostic Imaging Market Revenue Share (%), by Country 2025 & 2033
- Figure 18: Asia Pacific Diagnostic Imaging Market Revenue (Million), by Modality 2025 & 2033
- Figure 19: Asia Pacific Diagnostic Imaging Market Revenue Share (%), by Modality 2025 & 2033
- Figure 20: Asia Pacific Diagnostic Imaging Market Revenue (Million), by Application 2025 & 2033
- Figure 21: Asia Pacific Diagnostic Imaging Market Revenue Share (%), by Application 2025 & 2033
- Figure 22: Asia Pacific Diagnostic Imaging Market Revenue (Million), by End User 2025 & 2033
- Figure 23: Asia Pacific Diagnostic Imaging Market Revenue Share (%), by End User 2025 & 2033
- Figure 24: Asia Pacific Diagnostic Imaging Market Revenue (Million), by Country 2025 & 2033
- Figure 25: Asia Pacific Diagnostic Imaging Market Revenue Share (%), by Country 2025 & 2033
- Figure 26: Middle East and Africa Diagnostic Imaging Market Revenue (Million), by Modality 2025 & 2033
- Figure 27: Middle East and Africa Diagnostic Imaging Market Revenue Share (%), by Modality 2025 & 2033
- Figure 28: Middle East and Africa Diagnostic Imaging Market Revenue (Million), by Application 2025 & 2033
- Figure 29: Middle East and Africa Diagnostic Imaging Market Revenue Share (%), by Application 2025 & 2033
- Figure 30: Middle East and Africa Diagnostic Imaging Market Revenue (Million), by End User 2025 & 2033
- Figure 31: Middle East and Africa Diagnostic Imaging Market Revenue Share (%), by End User 2025 & 2033
- Figure 32: Middle East and Africa Diagnostic Imaging Market Revenue (Million), by Country 2025 & 2033
- Figure 33: Middle East and Africa Diagnostic Imaging Market Revenue Share (%), by Country 2025 & 2033
- Figure 34: South America Diagnostic Imaging Market Revenue (Million), by Modality 2025 & 2033
- Figure 35: South America Diagnostic Imaging Market Revenue Share (%), by Modality 2025 & 2033
- Figure 36: South America Diagnostic Imaging Market Revenue (Million), by Application 2025 & 2033
- Figure 37: South America Diagnostic Imaging Market Revenue Share (%), by Application 2025 & 2033
- Figure 38: South America Diagnostic Imaging Market Revenue (Million), by End User 2025 & 2033
- Figure 39: South America Diagnostic Imaging Market Revenue Share (%), by End User 2025 & 2033
- Figure 40: South America Diagnostic Imaging Market Revenue (Million), by Country 2025 & 2033
- Figure 41: South America Diagnostic Imaging Market Revenue Share (%), by Country 2025 & 2033
List of Tables
- Table 1: Global Diagnostic Imaging Market Revenue Million Forecast, by Modality 2020 & 2033
- Table 2: Global Diagnostic Imaging Market Revenue Million Forecast, by Application 2020 & 2033
- Table 3: Global Diagnostic Imaging Market Revenue Million Forecast, by End User 2020 & 2033
- Table 4: Global Diagnostic Imaging Market Revenue Million Forecast, by Region 2020 & 2033
- Table 5: Global Diagnostic Imaging Market Revenue Million Forecast, by Modality 2020 & 2033
- Table 6: Global Diagnostic Imaging Market Revenue Million Forecast, by Application 2020 & 2033
- Table 7: Global Diagnostic Imaging Market Revenue Million Forecast, by End User 2020 & 2033
- Table 8: Global Diagnostic Imaging Market Revenue Million Forecast, by Country 2020 & 2033
- Table 9: United States Diagnostic Imaging Market Revenue (Million) Forecast, by Application 2020 & 2033
- Table 10: Canada Diagnostic Imaging Market Revenue (Million) Forecast, by Application 2020 & 2033
- Table 11: Mexico Diagnostic Imaging Market Revenue (Million) Forecast, by Application 2020 & 2033
- Table 12: Global Diagnostic Imaging Market Revenue Million Forecast, by Modality 2020 & 2033
- Table 13: Global Diagnostic Imaging Market Revenue Million Forecast, by Application 2020 & 2033
- Table 14: Global Diagnostic Imaging Market Revenue Million Forecast, by End User 2020 & 2033
- Table 15: Global Diagnostic Imaging Market Revenue Million Forecast, by Country 2020 & 2033
- Table 16: Germany Diagnostic Imaging Market Revenue (Million) Forecast, by Application 2020 & 2033
- Table 17: United Kingdom Diagnostic Imaging Market Revenue (Million) Forecast, by Application 2020 & 2033
- Table 18: France Diagnostic Imaging Market Revenue (Million) Forecast, by Application 2020 & 2033
- Table 19: Italy Diagnostic Imaging Market Revenue (Million) Forecast, by Application 2020 & 2033
- Table 20: Spain Diagnostic Imaging Market Revenue (Million) Forecast, by Application 2020 & 2033
- Table 21: Rest of Europe Diagnostic Imaging Market Revenue (Million) Forecast, by Application 2020 & 2033
- Table 22: Global Diagnostic Imaging Market Revenue Million Forecast, by Modality 2020 & 2033
- Table 23: Global Diagnostic Imaging Market Revenue Million Forecast, by Application 2020 & 2033
- Table 24: Global Diagnostic Imaging Market Revenue Million Forecast, by End User 2020 & 2033
- Table 25: Global Diagnostic Imaging Market Revenue Million Forecast, by Country 2020 & 2033
- Table 26: China Diagnostic Imaging Market Revenue (Million) Forecast, by Application 2020 & 2033
- Table 27: Japan Diagnostic Imaging Market Revenue (Million) Forecast, by Application 2020 & 2033
- Table 28: India Diagnostic Imaging Market Revenue (Million) Forecast, by Application 2020 & 2033
- Table 29: Australia Diagnostic Imaging Market Revenue (Million) Forecast, by Application 2020 & 2033
- Table 30: South Korea Diagnostic Imaging Market Revenue (Million) Forecast, by Application 2020 & 2033
- Table 31: Rest of Asia Pacific Diagnostic Imaging Market Revenue (Million) Forecast, by Application 2020 & 2033
- Table 32: Global Diagnostic Imaging Market Revenue Million Forecast, by Modality 2020 & 2033
- Table 33: Global Diagnostic Imaging Market Revenue Million Forecast, by Application 2020 & 2033
- Table 34: Global Diagnostic Imaging Market Revenue Million Forecast, by End User 2020 & 2033
- Table 35: Global Diagnostic Imaging Market Revenue Million Forecast, by Country 2020 & 2033
- Table 36: GCC Diagnostic Imaging Market Revenue (Million) Forecast, by Application 2020 & 2033
- Table 37: South Africa Diagnostic Imaging Market Revenue (Million) Forecast, by Application 2020 & 2033
- Table 38: Rest of Middle East and Africa Diagnostic Imaging Market Revenue (Million) Forecast, by Application 2020 & 2033
- Table 39: Global Diagnostic Imaging Market Revenue Million Forecast, by Modality 2020 & 2033
- Table 40: Global Diagnostic Imaging Market Revenue Million Forecast, by Application 2020 & 2033
- Table 41: Global Diagnostic Imaging Market Revenue Million Forecast, by End User 2020 & 2033
- Table 42: Global Diagnostic Imaging Market Revenue Million Forecast, by Country 2020 & 2033
- Table 43: Brazil Diagnostic Imaging Market Revenue (Million) Forecast, by Application 2020 & 2033
- Table 44: Argentina Diagnostic Imaging Market Revenue (Million) Forecast, by Application 2020 & 2033
- Table 45: Rest of South America Diagnostic Imaging Market Revenue (Million) Forecast, by Application 2020 & 2033
Frequently Asked Questions
1. What is the projected Compound Annual Growth Rate (CAGR) of the Diagnostic Imaging Market?
The projected CAGR is approximately 4.18%.
2. Which companies are prominent players in the Diagnostic Imaging Market?
Key companies in the market include Shimadzu Medical, Esaote SpA, Siemens Healthineers, GE Healthcare, Samsung Electronics Co Ltd, Browns Medical Imaging (BMI), Mindray Medical International Limited, FUJIFILM Holdings Corporation, Koninklijke Philips NV, Canon Medical Systems Corporation, Hologic Corporation, Koning Corporation*List Not Exhaustive.
3. What are the main segments of the Diagnostic Imaging Market?
The market segments include Modality, Application, End User.
4. Can you provide details about the market size?
The market size is estimated to be USD 46.96 Million as of 2022.
5. What are some drivers contributing to market growth?
Rise in the Prevalence of Chronic Diseases; Increased Adoption of Advanced Technologies in Medical Imaging; Increase in the Geriatric Population.
6. What are the notable trends driving market growth?
Mid-range Scanners (~64-Slice) Segment under Computed Tomography expected to Account for Largest Market Share during the Forecast Period.
7. Are there any restraints impacting market growth?
Expensive Procedures and Equipment; Side Effects of Diagnostic Imaging.
8. Can you provide examples of recent developments in the market?
July 2022 : Canon Medical launched the Vantage Fortain MRI System at ECR 2022, This MRI system features innovative workflow solutions, image enhancements and accelerated scan technology, which together contributes to reducing the time required for MRI procedures.
9. What pricing options are available for accessing the report?
Pricing options include single-user, multi-user, and enterprise licenses priced at USD 4750, USD 5250, and USD 8750 respectively.
10. Is the market size provided in terms of value or volume?
The market size is provided in terms of value, measured in Million.
11. Are there any specific market keywords associated with the report?
Yes, the market keyword associated with the report is "Diagnostic Imaging Market," which aids in identifying and referencing the specific market segment covered.
12. How do I determine which pricing option suits my needs best?
The pricing options vary based on user requirements and access needs. Individual users may opt for single-user licenses, while businesses requiring broader access may choose multi-user or enterprise licenses for cost-effective access to the report.
13. Are there any additional resources or data provided in the Diagnostic Imaging Market report?
While the report offers comprehensive insights, it's advisable to review the specific contents or supplementary materials provided to ascertain if additional resources or data are available.
14. How can I stay updated on further developments or reports in the Diagnostic Imaging Market?
To stay informed about further developments, trends, and reports in the Diagnostic Imaging Market, consider subscribing to industry newsletters, following relevant companies and organizations, or regularly checking reputable industry news sources and publications.
Methodology
Step 1 - Identification of Relevant Samples Size from Population Database


Step 2 - Approaches for Defining Global Market Size (Value, Volume* & Price*)

Note*: In applicable scenarios
Step 3 - Data Sources
Primary Research
- Web Analytics
- Survey Reports
- Research Institute
- Latest Research Reports
- Opinion Leaders
Secondary Research
- Annual Reports
- White Paper
- Latest Press Release
- Industry Association
- Paid Database
- Investor Presentations

Step 4 - Data Triangulation
Involves using different sources of information in order to increase the validity of a study
These sources are likely to be stakeholders in a program - participants, other researchers, program staff, other community members, and so on.
Then we put all data in single framework & apply various statistical tools to find out the dynamic on the market.
During the analysis stage, feedback from the stakeholder groups would be compared to determine areas of agreement as well as areas of divergence