

Key Insights
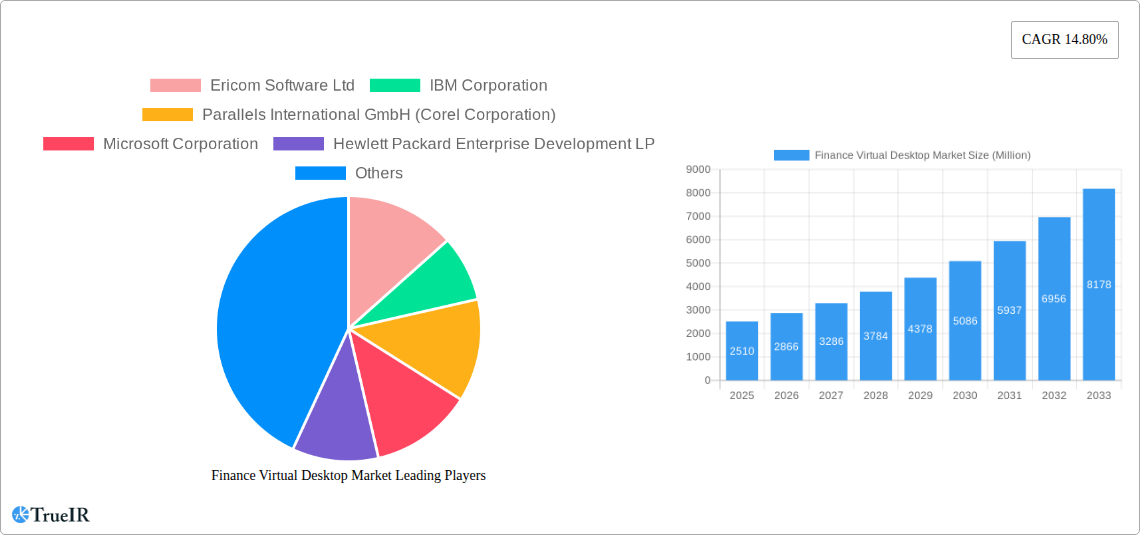
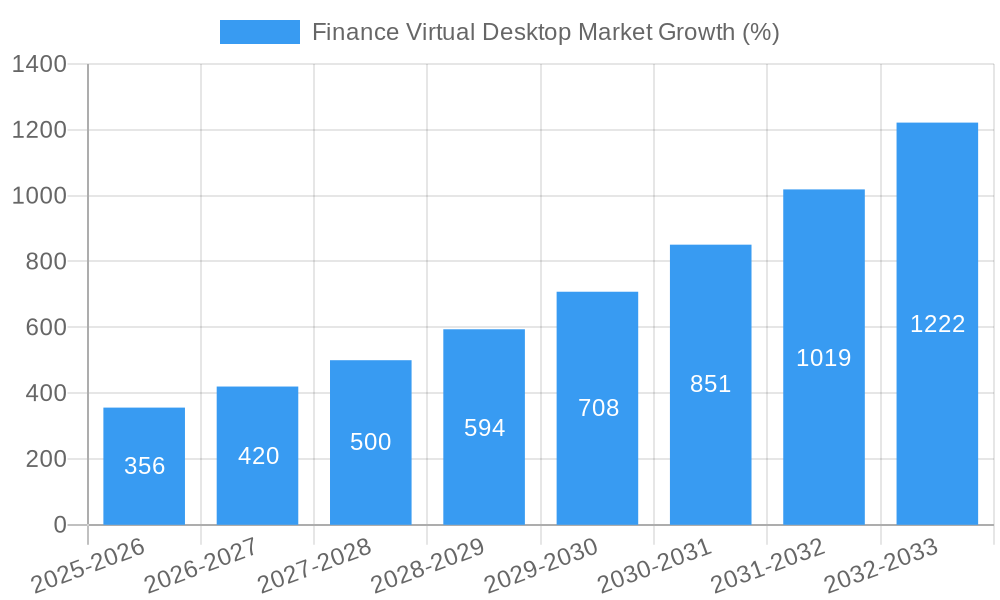
The Finance Virtual Desktop (FVD) market is experiencing robust growth, projected to reach \$2.51 billion in 2025 and maintain a Compound Annual Growth Rate (CAGR) of 14.80% from 2025 to 2033. This expansion is driven by several key factors. Firstly, the increasing need for secure access to financial data and applications from diverse locations fuels the adoption of FVD solutions. Enhanced security features, including robust encryption and multi-factor authentication, are crucial for mitigating cyber threats and complying with stringent financial regulations. Secondly, the growing trend of remote work and the bring-your-own-device (BYOD) policy within financial institutions are significantly impacting market growth. FVDs offer a secure and manageable solution for providing employees with access to sensitive information regardless of their physical location or device. Finally, cost optimization through centralized management and reduced IT infrastructure expenses are compelling financial institutions to embrace FVD solutions. The cloud-based deployment model, in particular, is gaining significant traction due to its scalability, flexibility, and reduced upfront capital expenditure.
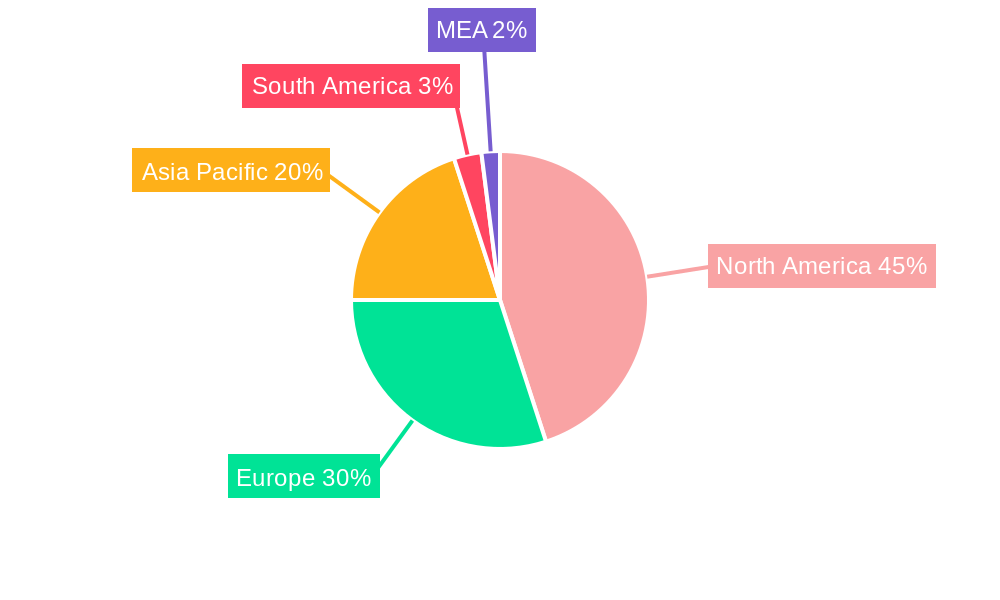
The competitive landscape is characterized by a mix of established technology vendors like Microsoft, Citrix, and IBM, alongside specialized providers like Ericom Software and Parallels. Market segmentation reveals strong demand for both Hosted Virtual Desktops (HVDs) and Hosted Shared Desktops (HSDs), with cloud deployment surpassing on-premises solutions in market share. Geographically, North America currently holds a significant share of the FVD market, driven by early adoption and a robust financial sector. However, the Asia-Pacific region is projected to experience substantial growth over the forecast period, fueled by increasing digitalization and the expansion of financial technology (FinTech) companies. Europe is also a substantial market, with significant growth expected across key economies such as the UK, Germany, and France. Continued technological advancements, regulatory changes, and expanding adoption across various financial sub-sectors will shape the future of this dynamic market.
Finance Virtual Desktop Market: A Comprehensive Report (2019-2033)
This dynamic report provides a comprehensive analysis of the Finance Virtual Desktop Market, offering invaluable insights for businesses, investors, and stakeholders seeking to understand and capitalize on this rapidly evolving sector. The study period covers 2019-2033, with 2025 serving as the base and estimated year. The report projects a market size of xx Million by 2025, with a Compound Annual Growth Rate (CAGR) of xx% during the forecast period (2025-2033).
Finance Virtual Desktop Market Market Structure & Competitive Landscape
The Finance Virtual Desktop Market exhibits a moderately concentrated structure, with several key players vying for market share. The market concentration ratio (CR4) is estimated at xx%, indicating the influence of the top four companies: Microsoft Corporation, Citrix Systems Inc, IBM Corporation, and VMware, Inc. (xx% market share collectively). Innovation is a key driver, with companies constantly developing new features, enhancing security protocols, and improving scalability to cater to the evolving needs of financial institutions. Regulatory compliance, particularly concerning data security and privacy (e.g., GDPR, CCPA), significantly impacts market dynamics. The market also faces competitive pressure from alternative solutions, such as cloud-based applications and specialized SaaS solutions. The end-user segment is dominated by large financial institutions and multinational banks with significant IT budgets and complex infrastructure needs. M&A activity has been relatively moderate in recent years, with a total of xx acquisitions recorded between 2019 and 2024, valuing approximately xx Million. This activity reflects the consolidation trend within the market and companies’ efforts to expand their product portfolios and geographic reach. Key M&A trends indicate a preference for acquisitions of smaller, specialized firms with unique technologies or customer bases.
Finance Virtual Desktop Market Market Trends & Opportunities
The Finance Virtual Desktop Market is experiencing substantial growth driven by several factors. The increasing adoption of cloud computing within financial institutions is a significant trend, as organizations look to improve scalability, reduce IT infrastructure costs, and enhance security. The demand for enhanced security and regulatory compliance is driving the shift towards robust VDI solutions. The market is also witnessing the rise of new technologies such as AI and machine learning, which are improving the efficiency and effectiveness of virtual desktop solutions. Furthermore, the expanding adoption of hybrid work models, particularly since the COVID-19 pandemic, is accelerating the demand for secure and reliable remote access solutions. The projected market size expansion of xx Million in 2025 to xx Million by 2033 demonstrates substantial market growth, underpinned by these trends. Market penetration rates for VDI solutions in the financial sector are currently estimated at xx%, with considerable room for growth, particularly in developing economies. This presents lucrative opportunities for existing and new market entrants.
Dominant Markets & Segments in Finance Virtual Desktop Market
The North American region currently dominates the Finance Virtual Desktop Market, driven by high technology adoption rates, stringent regulatory requirements, and a large number of financial institutions. Within the market segments:
By Desktop Delivery Platform: The Hosted Virtual Desktop (HVD) segment currently holds the largest market share, attributed to its flexibility, scalability, and cost-effectiveness. Key growth drivers include increasing cloud adoption and the rising need for secure remote access.
By Deployment Mode: The cloud deployment model is experiencing rapid growth, exceeding the on-premises deployment model by xx% in 2025 due to its inherent scalability, reduced infrastructure costs and ease of management. This segment is primarily driven by the rising adoption of cloud computing infrastructure and the desire for enhanced flexibility and accessibility.
Growth Drivers:
- Robust regulatory frameworks emphasizing data security and compliance.
- Increasing investment in advanced security measures.
- Growing adoption of hybrid work models.
- Continued technological advancements.
Finance Virtual Desktop Market Product Analysis
The Finance Virtual Desktop Market is characterized by a diverse range of products, each tailored to specific needs and security requirements. Leading vendors offer solutions ranging from basic virtual desktop infrastructure (VDI) to highly sophisticated platforms incorporating advanced security features, such as multi-factor authentication and micro-segmentation. Technological advancements are leading to the development of more user-friendly interfaces, streamlined management tools, and improved performance optimization. The integration of AI and machine learning capabilities is improving the security and efficiency of VDI solutions. The increasing demand for secure and reliable remote access is creating a strong market fit for solutions that offer robust encryption, authentication, and access control features.
Key Drivers, Barriers & Challenges in Finance Virtual Desktop Market
Key Drivers:
- The increasing adoption of cloud computing and hybrid work models significantly drives market growth.
- Stringent regulatory compliance requirements for data security and privacy further propel the demand for secure VDI solutions.
- Technological advancements in areas like AI and machine learning enhance performance and security, boosting market appeal.
Challenges and Restraints:
- The high initial investment cost of implementing VDI solutions can be a barrier for smaller financial institutions.
- Integrating VDI solutions with existing legacy systems can be technically challenging and resource-intensive.
- The complexity of managing and securing VDI environments poses a significant operational challenge.
Growth Drivers in the Finance Virtual Desktop Market Market
The Finance Virtual Desktop Market is propelled by the increasing need for secure remote access, enhanced data security, and improved operational efficiency. Technological advancements in cloud computing, AI, and machine learning are key drivers, along with evolving regulatory landscapes demanding robust security protocols and the widespread adoption of hybrid work models. The cost-effectiveness of cloud-based VDI solutions compared to on-premises infrastructure is also a significant factor.
Challenges Impacting Finance Virtual Desktop Market Growth
Significant challenges include the high initial investment costs, the complexity of integration with legacy systems, and the ongoing need for robust security measures to comply with strict regulatory requirements. Competition from alternative solutions and concerns around data privacy and security can also impact market growth. Supply chain disruptions, while affecting the availability of some components, have not significantly hampered market expansion in recent years.
Key Players Shaping the Finance Virtual Desktop Market Market
- Ericom Software Ltd
- IBM Corporation
- Parallels International GmbH (Corel Corporation)
- Microsoft Corporation
- Hewlett Packard Enterprise Development LP
- Dell Inc
- NComputing Co Ltd
- Huawei Technologies Co Ltd
- Evolve IP LLC
- Citrix Systems Inc
Significant Finance Virtual Desktop Market Industry Milestones
- September 2022: AWS launched Amazon WorkSpaces Core, a managed VDI solution enhancing cloud-based options for financial institutions.
- February 2023: Coretelligent's acquisition of NetCom Systems expanded its VDI capabilities and strengthened its market position.
Future Outlook for Finance Virtual Desktop Market Market
The Finance Virtual Desktop Market is poised for continued growth, driven by sustained demand for enhanced security, scalability, and remote access capabilities. Strategic partnerships, technological innovations, and the expansion of cloud-based solutions will shape the market's future. The increasing adoption of hybrid work models and the rising emphasis on regulatory compliance further contribute to the market's positive outlook, suggesting significant potential for expansion in the coming years.
Finance Virtual Desktop Market Segmentation
-
1. Desktop Delivery Platform
- 1.1. Hosted Virtual Desktop (HVD)
- 1.2. Hosted Shared Desktop (HSD)
- 1.3. Other Desktop Delivery Platform
-
2. Deployment Mode
- 2.1. On-premises
- 2.2. Cloud
Finance Virtual Desktop Market Segmentation By Geography
- 1. North America
- 2. Europe
- 3. Asia
- 4. Australia and New Zealand
- 5. Latin America
- 6. Middle East and Africa
Finance Virtual Desktop Market REPORT HIGHLIGHTS
| Aspects | Details |
|---|---|
| Study Period | 2019-2033 |
| Base Year | 2024 |
| Estimated Year | 2025 |
| Forecast Period | 2025-2033 |
| Historical Period | 2019-2024 |
| Growth Rate | CAGR of 14.80% from 2019-2033 |
| Segmentation |
|
Table of Contents
- 1. Introduction
- 1.1. Research Scope
- 1.2. Market Segmentation
- 1.3. Research Methodology
- 1.4. Definitions and Assumptions
- 2. Executive Summary
- 2.1. Introduction
- 3. Market Dynamics
- 3.1. Introduction
- 3.2. Market Drivers
- 3.2.1. Increasing Adoption of Cloud Services in Financial Institutions; Desktop Virtualization Supports Inorganic Growth
- 3.3. Market Restrains
- 3.3.1. Infrastructural Constraints of Enterprises will Act as a Challenge for the Growth of the Market; Lack of Skilled Professionals
- 3.4. Market Trends
- 3.4.1. Increasing Adoption of Cloud Services in Financial Institutions to Drive the Market Growth
- 4. Market Factor Analysis
- 4.1. Porters Five Forces
- 4.2. Supply/Value Chain
- 4.3. PESTEL analysis
- 4.4. Market Entropy
- 4.5. Patent/Trademark Analysis
- 5. Global Finance Virtual Desktop Market Analysis, Insights and Forecast, 2019-2031
- 5.1. Market Analysis, Insights and Forecast - by Desktop Delivery Platform
- 5.1.1. Hosted Virtual Desktop (HVD)
- 5.1.2. Hosted Shared Desktop (HSD)
- 5.1.3. Other Desktop Delivery Platform
- 5.2. Market Analysis, Insights and Forecast - by Deployment Mode
- 5.2.1. On-premises
- 5.2.2. Cloud
- 5.3. Market Analysis, Insights and Forecast - by Region
- 5.3.1. North America
- 5.3.2. Europe
- 5.3.3. Asia
- 5.3.4. Australia and New Zealand
- 5.3.5. Latin America
- 5.3.6. Middle East and Africa
- 5.1. Market Analysis, Insights and Forecast - by Desktop Delivery Platform
- 6. North America Finance Virtual Desktop Market Analysis, Insights and Forecast, 2019-2031
- 6.1. Market Analysis, Insights and Forecast - by Desktop Delivery Platform
- 6.1.1. Hosted Virtual Desktop (HVD)
- 6.1.2. Hosted Shared Desktop (HSD)
- 6.1.3. Other Desktop Delivery Platform
- 6.2. Market Analysis, Insights and Forecast - by Deployment Mode
- 6.2.1. On-premises
- 6.2.2. Cloud
- 6.1. Market Analysis, Insights and Forecast - by Desktop Delivery Platform
- 7. Europe Finance Virtual Desktop Market Analysis, Insights and Forecast, 2019-2031
- 7.1. Market Analysis, Insights and Forecast - by Desktop Delivery Platform
- 7.1.1. Hosted Virtual Desktop (HVD)
- 7.1.2. Hosted Shared Desktop (HSD)
- 7.1.3. Other Desktop Delivery Platform
- 7.2. Market Analysis, Insights and Forecast - by Deployment Mode
- 7.2.1. On-premises
- 7.2.2. Cloud
- 7.1. Market Analysis, Insights and Forecast - by Desktop Delivery Platform
- 8. Asia Finance Virtual Desktop Market Analysis, Insights and Forecast, 2019-2031
- 8.1. Market Analysis, Insights and Forecast - by Desktop Delivery Platform
- 8.1.1. Hosted Virtual Desktop (HVD)
- 8.1.2. Hosted Shared Desktop (HSD)
- 8.1.3. Other Desktop Delivery Platform
- 8.2. Market Analysis, Insights and Forecast - by Deployment Mode
- 8.2.1. On-premises
- 8.2.2. Cloud
- 8.1. Market Analysis, Insights and Forecast - by Desktop Delivery Platform
- 9. Australia and New Zealand Finance Virtual Desktop Market Analysis, Insights and Forecast, 2019-2031
- 9.1. Market Analysis, Insights and Forecast - by Desktop Delivery Platform
- 9.1.1. Hosted Virtual Desktop (HVD)
- 9.1.2. Hosted Shared Desktop (HSD)
- 9.1.3. Other Desktop Delivery Platform
- 9.2. Market Analysis, Insights and Forecast - by Deployment Mode
- 9.2.1. On-premises
- 9.2.2. Cloud
- 9.1. Market Analysis, Insights and Forecast - by Desktop Delivery Platform
- 10. Latin America Finance Virtual Desktop Market Analysis, Insights and Forecast, 2019-2031
- 10.1. Market Analysis, Insights and Forecast - by Desktop Delivery Platform
- 10.1.1. Hosted Virtual Desktop (HVD)
- 10.1.2. Hosted Shared Desktop (HSD)
- 10.1.3. Other Desktop Delivery Platform
- 10.2. Market Analysis, Insights and Forecast - by Deployment Mode
- 10.2.1. On-premises
- 10.2.2. Cloud
- 10.1. Market Analysis, Insights and Forecast - by Desktop Delivery Platform
- 11. Middle East and Africa Finance Virtual Desktop Market Analysis, Insights and Forecast, 2019-2031
- 11.1. Market Analysis, Insights and Forecast - by Desktop Delivery Platform
- 11.1.1. Hosted Virtual Desktop (HVD)
- 11.1.2. Hosted Shared Desktop (HSD)
- 11.1.3. Other Desktop Delivery Platform
- 11.2. Market Analysis, Insights and Forecast - by Deployment Mode
- 11.2.1. On-premises
- 11.2.2. Cloud
- 11.1. Market Analysis, Insights and Forecast - by Desktop Delivery Platform
- 12. North America Finance Virtual Desktop Market Analysis, Insights and Forecast, 2019-2031
- 12.1. Market Analysis, Insights and Forecast - By Country/Sub-region
- 12.1.1 United States
- 12.1.2 Canada
- 12.1.3 Mexico
- 13. Europe Finance Virtual Desktop Market Analysis, Insights and Forecast, 2019-2031
- 13.1. Market Analysis, Insights and Forecast - By Country/Sub-region
- 13.1.1 Germany
- 13.1.2 United Kingdom
- 13.1.3 France
- 13.1.4 Spain
- 13.1.5 Italy
- 13.1.6 Spain
- 13.1.7 Belgium
- 13.1.8 Netherland
- 13.1.9 Nordics
- 13.1.10 Rest of Europe
- 14. Asia Pacific Finance Virtual Desktop Market Analysis, Insights and Forecast, 2019-2031
- 14.1. Market Analysis, Insights and Forecast - By Country/Sub-region
- 14.1.1 China
- 14.1.2 Japan
- 14.1.3 India
- 14.1.4 South Korea
- 14.1.5 Southeast Asia
- 14.1.6 Australia
- 14.1.7 Indonesia
- 14.1.8 Phillipes
- 14.1.9 Singapore
- 14.1.10 Thailandc
- 14.1.11 Rest of Asia Pacific
- 15. South America Finance Virtual Desktop Market Analysis, Insights and Forecast, 2019-2031
- 15.1. Market Analysis, Insights and Forecast - By Country/Sub-region
- 15.1.1 Brazil
- 15.1.2 Argentina
- 15.1.3 Peru
- 15.1.4 Chile
- 15.1.5 Colombia
- 15.1.6 Ecuador
- 15.1.7 Venezuela
- 15.1.8 Rest of South America
- 16. North America Finance Virtual Desktop Market Analysis, Insights and Forecast, 2019-2031
- 16.1. Market Analysis, Insights and Forecast - By Country/Sub-region
- 16.1.1 United States
- 16.1.2 Canada
- 16.1.3 Mexico
- 17. MEA Finance Virtual Desktop Market Analysis, Insights and Forecast, 2019-2031
- 17.1. Market Analysis, Insights and Forecast - By Country/Sub-region
- 17.1.1 United Arab Emirates
- 17.1.2 Saudi Arabia
- 17.1.3 South Africa
- 17.1.4 Rest of Middle East and Africa
- 18. Competitive Analysis
- 18.1. Global Market Share Analysis 2024
- 18.2. Company Profiles
- 18.2.1 Ericom Software Ltd
- 18.2.1.1. Overview
- 18.2.1.2. Products
- 18.2.1.3. SWOT Analysis
- 18.2.1.4. Recent Developments
- 18.2.1.5. Financials (Based on Availability)
- 18.2.2 IBM Corporation
- 18.2.2.1. Overview
- 18.2.2.2. Products
- 18.2.2.3. SWOT Analysis
- 18.2.2.4. Recent Developments
- 18.2.2.5. Financials (Based on Availability)
- 18.2.3 Parallels International GmbH (Corel Corporation)
- 18.2.3.1. Overview
- 18.2.3.2. Products
- 18.2.3.3. SWOT Analysis
- 18.2.3.4. Recent Developments
- 18.2.3.5. Financials (Based on Availability)
- 18.2.4 Microsoft Corporation
- 18.2.4.1. Overview
- 18.2.4.2. Products
- 18.2.4.3. SWOT Analysis
- 18.2.4.4. Recent Developments
- 18.2.4.5. Financials (Based on Availability)
- 18.2.5 Hewlett Packard Enterprise Development LP
- 18.2.5.1. Overview
- 18.2.5.2. Products
- 18.2.5.3. SWOT Analysis
- 18.2.5.4. Recent Developments
- 18.2.5.5. Financials (Based on Availability)
- 18.2.6 Dell Inc
- 18.2.6.1. Overview
- 18.2.6.2. Products
- 18.2.6.3. SWOT Analysis
- 18.2.6.4. Recent Developments
- 18.2.6.5. Financials (Based on Availability)
- 18.2.7 NComputing Co Ltd
- 18.2.7.1. Overview
- 18.2.7.2. Products
- 18.2.7.3. SWOT Analysis
- 18.2.7.4. Recent Developments
- 18.2.7.5. Financials (Based on Availability)
- 18.2.8 Huawei Technologies Co Ltd
- 18.2.8.1. Overview
- 18.2.8.2. Products
- 18.2.8.3. SWOT Analysis
- 18.2.8.4. Recent Developments
- 18.2.8.5. Financials (Based on Availability)
- 18.2.9 Evolve IP LLC
- 18.2.9.1. Overview
- 18.2.9.2. Products
- 18.2.9.3. SWOT Analysis
- 18.2.9.4. Recent Developments
- 18.2.9.5. Financials (Based on Availability)
- 18.2.10 Citrix Systems Inc
- 18.2.10.1. Overview
- 18.2.10.2. Products
- 18.2.10.3. SWOT Analysis
- 18.2.10.4. Recent Developments
- 18.2.10.5. Financials (Based on Availability)
- 18.2.1 Ericom Software Ltd
List of Figures
- Figure 1: Global Finance Virtual Desktop Market Revenue Breakdown (Million, %) by Region 2024 & 2032
- Figure 2: North America Finance Virtual Desktop Market Revenue (Million), by Country 2024 & 2032
- Figure 3: North America Finance Virtual Desktop Market Revenue Share (%), by Country 2024 & 2032
- Figure 4: Europe Finance Virtual Desktop Market Revenue (Million), by Country 2024 & 2032
- Figure 5: Europe Finance Virtual Desktop Market Revenue Share (%), by Country 2024 & 2032
- Figure 6: Asia Pacific Finance Virtual Desktop Market Revenue (Million), by Country 2024 & 2032
- Figure 7: Asia Pacific Finance Virtual Desktop Market Revenue Share (%), by Country 2024 & 2032
- Figure 8: South America Finance Virtual Desktop Market Revenue (Million), by Country 2024 & 2032
- Figure 9: South America Finance Virtual Desktop Market Revenue Share (%), by Country 2024 & 2032
- Figure 10: North America Finance Virtual Desktop Market Revenue (Million), by Country 2024 & 2032
- Figure 11: North America Finance Virtual Desktop Market Revenue Share (%), by Country 2024 & 2032
- Figure 12: MEA Finance Virtual Desktop Market Revenue (Million), by Country 2024 & 2032
- Figure 13: MEA Finance Virtual Desktop Market Revenue Share (%), by Country 2024 & 2032
- Figure 14: North America Finance Virtual Desktop Market Revenue (Million), by Desktop Delivery Platform 2024 & 2032
- Figure 15: North America Finance Virtual Desktop Market Revenue Share (%), by Desktop Delivery Platform 2024 & 2032
- Figure 16: North America Finance Virtual Desktop Market Revenue (Million), by Deployment Mode 2024 & 2032
- Figure 17: North America Finance Virtual Desktop Market Revenue Share (%), by Deployment Mode 2024 & 2032
- Figure 18: North America Finance Virtual Desktop Market Revenue (Million), by Country 2024 & 2032
- Figure 19: North America Finance Virtual Desktop Market Revenue Share (%), by Country 2024 & 2032
- Figure 20: Europe Finance Virtual Desktop Market Revenue (Million), by Desktop Delivery Platform 2024 & 2032
- Figure 21: Europe Finance Virtual Desktop Market Revenue Share (%), by Desktop Delivery Platform 2024 & 2032
- Figure 22: Europe Finance Virtual Desktop Market Revenue (Million), by Deployment Mode 2024 & 2032
- Figure 23: Europe Finance Virtual Desktop Market Revenue Share (%), by Deployment Mode 2024 & 2032
- Figure 24: Europe Finance Virtual Desktop Market Revenue (Million), by Country 2024 & 2032
- Figure 25: Europe Finance Virtual Desktop Market Revenue Share (%), by Country 2024 & 2032
- Figure 26: Asia Finance Virtual Desktop Market Revenue (Million), by Desktop Delivery Platform 2024 & 2032
- Figure 27: Asia Finance Virtual Desktop Market Revenue Share (%), by Desktop Delivery Platform 2024 & 2032
- Figure 28: Asia Finance Virtual Desktop Market Revenue (Million), by Deployment Mode 2024 & 2032
- Figure 29: Asia Finance Virtual Desktop Market Revenue Share (%), by Deployment Mode 2024 & 2032
- Figure 30: Asia Finance Virtual Desktop Market Revenue (Million), by Country 2024 & 2032
- Figure 31: Asia Finance Virtual Desktop Market Revenue Share (%), by Country 2024 & 2032
- Figure 32: Australia and New Zealand Finance Virtual Desktop Market Revenue (Million), by Desktop Delivery Platform 2024 & 2032
- Figure 33: Australia and New Zealand Finance Virtual Desktop Market Revenue Share (%), by Desktop Delivery Platform 2024 & 2032
- Figure 34: Australia and New Zealand Finance Virtual Desktop Market Revenue (Million), by Deployment Mode 2024 & 2032
- Figure 35: Australia and New Zealand Finance Virtual Desktop Market Revenue Share (%), by Deployment Mode 2024 & 2032
- Figure 36: Australia and New Zealand Finance Virtual Desktop Market Revenue (Million), by Country 2024 & 2032
- Figure 37: Australia and New Zealand Finance Virtual Desktop Market Revenue Share (%), by Country 2024 & 2032
- Figure 38: Latin America Finance Virtual Desktop Market Revenue (Million), by Desktop Delivery Platform 2024 & 2032
- Figure 39: Latin America Finance Virtual Desktop Market Revenue Share (%), by Desktop Delivery Platform 2024 & 2032
- Figure 40: Latin America Finance Virtual Desktop Market Revenue (Million), by Deployment Mode 2024 & 2032
- Figure 41: Latin America Finance Virtual Desktop Market Revenue Share (%), by Deployment Mode 2024 & 2032
- Figure 42: Latin America Finance Virtual Desktop Market Revenue (Million), by Country 2024 & 2032
- Figure 43: Latin America Finance Virtual Desktop Market Revenue Share (%), by Country 2024 & 2032
- Figure 44: Middle East and Africa Finance Virtual Desktop Market Revenue (Million), by Desktop Delivery Platform 2024 & 2032
- Figure 45: Middle East and Africa Finance Virtual Desktop Market Revenue Share (%), by Desktop Delivery Platform 2024 & 2032
- Figure 46: Middle East and Africa Finance Virtual Desktop Market Revenue (Million), by Deployment Mode 2024 & 2032
- Figure 47: Middle East and Africa Finance Virtual Desktop Market Revenue Share (%), by Deployment Mode 2024 & 2032
- Figure 48: Middle East and Africa Finance Virtual Desktop Market Revenue (Million), by Country 2024 & 2032
- Figure 49: Middle East and Africa Finance Virtual Desktop Market Revenue Share (%), by Country 2024 & 2032
List of Tables
- Table 1: Global Finance Virtual Desktop Market Revenue Million Forecast, by Region 2019 & 2032
- Table 2: Global Finance Virtual Desktop Market Revenue Million Forecast, by Desktop Delivery Platform 2019 & 2032
- Table 3: Global Finance Virtual Desktop Market Revenue Million Forecast, by Deployment Mode 2019 & 2032
- Table 4: Global Finance Virtual Desktop Market Revenue Million Forecast, by Region 2019 & 2032
- Table 5: Global Finance Virtual Desktop Market Revenue Million Forecast, by Country 2019 & 2032
- Table 6: United States Finance Virtual Desktop Market Revenue (Million) Forecast, by Application 2019 & 2032
- Table 7: Canada Finance Virtual Desktop Market Revenue (Million) Forecast, by Application 2019 & 2032
- Table 8: Mexico Finance Virtual Desktop Market Revenue (Million) Forecast, by Application 2019 & 2032
- Table 9: Global Finance Virtual Desktop Market Revenue Million Forecast, by Country 2019 & 2032
- Table 10: Germany Finance Virtual Desktop Market Revenue (Million) Forecast, by Application 2019 & 2032
- Table 11: United Kingdom Finance Virtual Desktop Market Revenue (Million) Forecast, by Application 2019 & 2032
- Table 12: France Finance Virtual Desktop Market Revenue (Million) Forecast, by Application 2019 & 2032
- Table 13: Spain Finance Virtual Desktop Market Revenue (Million) Forecast, by Application 2019 & 2032
- Table 14: Italy Finance Virtual Desktop Market Revenue (Million) Forecast, by Application 2019 & 2032
- Table 15: Spain Finance Virtual Desktop Market Revenue (Million) Forecast, by Application 2019 & 2032
- Table 16: Belgium Finance Virtual Desktop Market Revenue (Million) Forecast, by Application 2019 & 2032
- Table 17: Netherland Finance Virtual Desktop Market Revenue (Million) Forecast, by Application 2019 & 2032
- Table 18: Nordics Finance Virtual Desktop Market Revenue (Million) Forecast, by Application 2019 & 2032
- Table 19: Rest of Europe Finance Virtual Desktop Market Revenue (Million) Forecast, by Application 2019 & 2032
- Table 20: Global Finance Virtual Desktop Market Revenue Million Forecast, by Country 2019 & 2032
- Table 21: China Finance Virtual Desktop Market Revenue (Million) Forecast, by Application 2019 & 2032
- Table 22: Japan Finance Virtual Desktop Market Revenue (Million) Forecast, by Application 2019 & 2032
- Table 23: India Finance Virtual Desktop Market Revenue (Million) Forecast, by Application 2019 & 2032
- Table 24: South Korea Finance Virtual Desktop Market Revenue (Million) Forecast, by Application 2019 & 2032
- Table 25: Southeast Asia Finance Virtual Desktop Market Revenue (Million) Forecast, by Application 2019 & 2032
- Table 26: Australia Finance Virtual Desktop Market Revenue (Million) Forecast, by Application 2019 & 2032
- Table 27: Indonesia Finance Virtual Desktop Market Revenue (Million) Forecast, by Application 2019 & 2032
- Table 28: Phillipes Finance Virtual Desktop Market Revenue (Million) Forecast, by Application 2019 & 2032
- Table 29: Singapore Finance Virtual Desktop Market Revenue (Million) Forecast, by Application 2019 & 2032
- Table 30: Thailandc Finance Virtual Desktop Market Revenue (Million) Forecast, by Application 2019 & 2032
- Table 31: Rest of Asia Pacific Finance Virtual Desktop Market Revenue (Million) Forecast, by Application 2019 & 2032
- Table 32: Global Finance Virtual Desktop Market Revenue Million Forecast, by Country 2019 & 2032
- Table 33: Brazil Finance Virtual Desktop Market Revenue (Million) Forecast, by Application 2019 & 2032
- Table 34: Argentina Finance Virtual Desktop Market Revenue (Million) Forecast, by Application 2019 & 2032
- Table 35: Peru Finance Virtual Desktop Market Revenue (Million) Forecast, by Application 2019 & 2032
- Table 36: Chile Finance Virtual Desktop Market Revenue (Million) Forecast, by Application 2019 & 2032
- Table 37: Colombia Finance Virtual Desktop Market Revenue (Million) Forecast, by Application 2019 & 2032
- Table 38: Ecuador Finance Virtual Desktop Market Revenue (Million) Forecast, by Application 2019 & 2032
- Table 39: Venezuela Finance Virtual Desktop Market Revenue (Million) Forecast, by Application 2019 & 2032
- Table 40: Rest of South America Finance Virtual Desktop Market Revenue (Million) Forecast, by Application 2019 & 2032
- Table 41: Global Finance Virtual Desktop Market Revenue Million Forecast, by Country 2019 & 2032
- Table 42: United States Finance Virtual Desktop Market Revenue (Million) Forecast, by Application 2019 & 2032
- Table 43: Canada Finance Virtual Desktop Market Revenue (Million) Forecast, by Application 2019 & 2032
- Table 44: Mexico Finance Virtual Desktop Market Revenue (Million) Forecast, by Application 2019 & 2032
- Table 45: Global Finance Virtual Desktop Market Revenue Million Forecast, by Country 2019 & 2032
- Table 46: United Arab Emirates Finance Virtual Desktop Market Revenue (Million) Forecast, by Application 2019 & 2032
- Table 47: Saudi Arabia Finance Virtual Desktop Market Revenue (Million) Forecast, by Application 2019 & 2032
- Table 48: South Africa Finance Virtual Desktop Market Revenue (Million) Forecast, by Application 2019 & 2032
- Table 49: Rest of Middle East and Africa Finance Virtual Desktop Market Revenue (Million) Forecast, by Application 2019 & 2032
- Table 50: Global Finance Virtual Desktop Market Revenue Million Forecast, by Desktop Delivery Platform 2019 & 2032
- Table 51: Global Finance Virtual Desktop Market Revenue Million Forecast, by Deployment Mode 2019 & 2032
- Table 52: Global Finance Virtual Desktop Market Revenue Million Forecast, by Country 2019 & 2032
- Table 53: Global Finance Virtual Desktop Market Revenue Million Forecast, by Desktop Delivery Platform 2019 & 2032
- Table 54: Global Finance Virtual Desktop Market Revenue Million Forecast, by Deployment Mode 2019 & 2032
- Table 55: Global Finance Virtual Desktop Market Revenue Million Forecast, by Country 2019 & 2032
- Table 56: Global Finance Virtual Desktop Market Revenue Million Forecast, by Desktop Delivery Platform 2019 & 2032
- Table 57: Global Finance Virtual Desktop Market Revenue Million Forecast, by Deployment Mode 2019 & 2032
- Table 58: Global Finance Virtual Desktop Market Revenue Million Forecast, by Country 2019 & 2032
- Table 59: Global Finance Virtual Desktop Market Revenue Million Forecast, by Desktop Delivery Platform 2019 & 2032
- Table 60: Global Finance Virtual Desktop Market Revenue Million Forecast, by Deployment Mode 2019 & 2032
- Table 61: Global Finance Virtual Desktop Market Revenue Million Forecast, by Country 2019 & 2032
- Table 62: Global Finance Virtual Desktop Market Revenue Million Forecast, by Desktop Delivery Platform 2019 & 2032
- Table 63: Global Finance Virtual Desktop Market Revenue Million Forecast, by Deployment Mode 2019 & 2032
- Table 64: Global Finance Virtual Desktop Market Revenue Million Forecast, by Country 2019 & 2032
- Table 65: Global Finance Virtual Desktop Market Revenue Million Forecast, by Desktop Delivery Platform 2019 & 2032
- Table 66: Global Finance Virtual Desktop Market Revenue Million Forecast, by Deployment Mode 2019 & 2032
- Table 67: Global Finance Virtual Desktop Market Revenue Million Forecast, by Country 2019 & 2032
Frequently Asked Questions
1. What is the projected Compound Annual Growth Rate (CAGR) of the Finance Virtual Desktop Market?
The projected CAGR is approximately 14.80%.
2. Which companies are prominent players in the Finance Virtual Desktop Market?
Key companies in the market include Ericom Software Ltd, IBM Corporation, Parallels International GmbH (Corel Corporation), Microsoft Corporation, Hewlett Packard Enterprise Development LP, Dell Inc, NComputing Co Ltd, Huawei Technologies Co Ltd, Evolve IP LLC, Citrix Systems Inc.
3. What are the main segments of the Finance Virtual Desktop Market?
The market segments include Desktop Delivery Platform, Deployment Mode.
4. Can you provide details about the market size?
The market size is estimated to be USD 2.51 Million as of 2022.
5. What are some drivers contributing to market growth?
Increasing Adoption of Cloud Services in Financial Institutions; Desktop Virtualization Supports Inorganic Growth.
6. What are the notable trends driving market growth?
Increasing Adoption of Cloud Services in Financial Institutions to Drive the Market Growth.
7. Are there any restraints impacting market growth?
Infrastructural Constraints of Enterprises will Act as a Challenge for the Growth of the Market; Lack of Skilled Professionals.
8. Can you provide examples of recent developments in the market?
February 2023: Norwest Equity Partners (NEP), a prominent middle-market investment firm, and Coretelligent, a United States-based IT service management firm, announced the acquisition of NetCom Systems, Inc. The acquisition adds network and cloud infrastructure, application administration, and virtual desktop infrastructure (VDI) to Coretelligent's currently secure infrastructure, enhancing current resources and providing critical redundancies.
9. What pricing options are available for accessing the report?
Pricing options include single-user, multi-user, and enterprise licenses priced at USD 4750, USD 5250, and USD 8750 respectively.
10. Is the market size provided in terms of value or volume?
The market size is provided in terms of value, measured in Million.
11. Are there any specific market keywords associated with the report?
Yes, the market keyword associated with the report is "Finance Virtual Desktop Market," which aids in identifying and referencing the specific market segment covered.
12. How do I determine which pricing option suits my needs best?
The pricing options vary based on user requirements and access needs. Individual users may opt for single-user licenses, while businesses requiring broader access may choose multi-user or enterprise licenses for cost-effective access to the report.
13. Are there any additional resources or data provided in the Finance Virtual Desktop Market report?
While the report offers comprehensive insights, it's advisable to review the specific contents or supplementary materials provided to ascertain if additional resources or data are available.
14. How can I stay updated on further developments or reports in the Finance Virtual Desktop Market?
To stay informed about further developments, trends, and reports in the Finance Virtual Desktop Market, consider subscribing to industry newsletters, following relevant companies and organizations, or regularly checking reputable industry news sources and publications.
Methodology
Step 1 - Identification of Relevant Samples Size from Population Database


Step 2 - Approaches for Defining Global Market Size (Value, Volume* & Price*)

Note*: In applicable scenarios
Step 3 - Data Sources
Primary Research
- Web Analytics
- Survey Reports
- Research Institute
- Latest Research Reports
- Opinion Leaders
Secondary Research
- Annual Reports
- White Paper
- Latest Press Release
- Industry Association
- Paid Database
- Investor Presentations

Step 4 - Data Triangulation
Involves using different sources of information in order to increase the validity of a study
These sources are likely to be stakeholders in a program - participants, other researchers, program staff, other community members, and so on.
Then we put all data in single framework & apply various statistical tools to find out the dynamic on the market.
During the analysis stage, feedback from the stakeholder groups would be compared to determine areas of agreement as well as areas of divergence
