

Key Insights
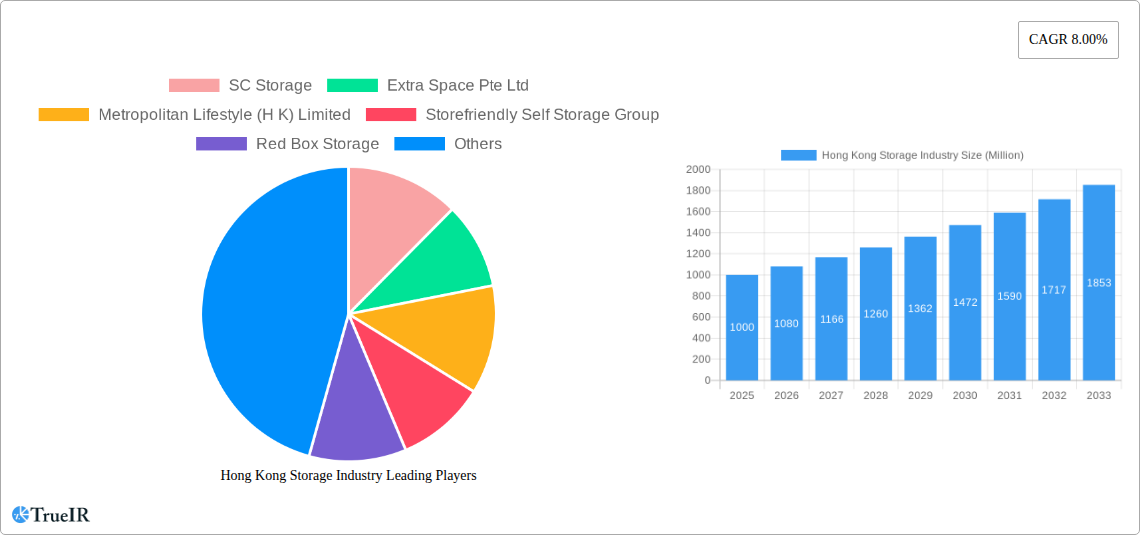
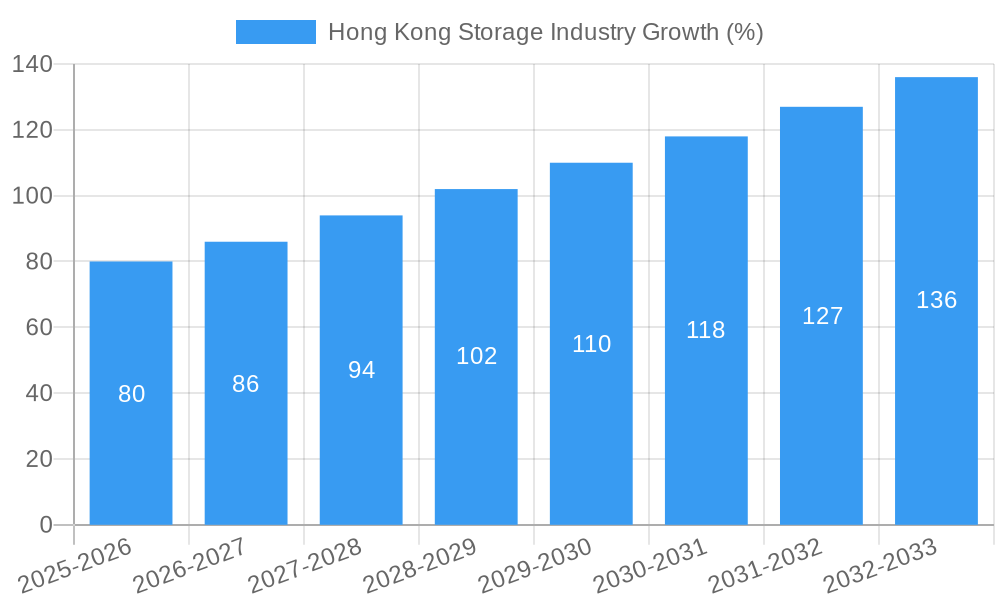
The Hong Kong storage industry, currently experiencing robust growth, presents a compelling investment opportunity. With a Compound Annual Growth Rate (CAGR) of 8.00% from 2019 to 2024, and a projected continuation of this trend through 2033, the market demonstrates significant potential. The rising demand is fueled by several factors: Hong Kong's dense urban environment necessitates efficient space management, particularly for both residential and business needs. The increasing popularity of e-commerce further boosts demand for warehousing and logistics-related storage solutions. Furthermore, the growth of the small and medium-sized enterprise (SME) sector contributes significantly to the demand for flexible and scalable storage options. Major players like SC Storage, Extra Space Pte Ltd, and others are actively shaping this market, offering diverse solutions to meet the varied needs of personal and business clients. While competition is intensifying, the sustained growth trajectory signals ample room for expansion and innovation within the sector.
The forecast period of 2025-2033 anticipates a continuation of this upward trend, driven by sustained urbanization, economic growth, and the ongoing adoption of digital business models requiring robust storage solutions. However, potential challenges exist including rising land costs and competition from newer entrants. Nevertheless, strategic players leveraging technological advancements, such as automated storage and retrieval systems, and a focus on enhanced customer service, are expected to capture significant market share. The segmentation of the market, comprising personal and business users, allows for targeted marketing and service offerings, allowing businesses to tailor solutions to meet specific client needs, thereby maximizing market penetration and profitability within this dynamic landscape.
Hong Kong Storage Industry: A Comprehensive Market Report (2019-2033)
This dynamic report provides a detailed analysis of the Hong Kong storage industry, offering invaluable insights for investors, industry professionals, and strategic planners. Covering the period 2019-2033, with a focus on 2025, this comprehensive study unravels market trends, competitive dynamics, and future growth potential. The report leverages extensive data analysis and expert insights to provide a clear and actionable understanding of this rapidly evolving sector. The Hong Kong storage market, valued at xx Million in 2025, is projected to reach xx Million by 2033, exhibiting a robust CAGR of xx%.
Hong Kong Storage Industry Market Structure & Competitive Landscape
The Hong Kong storage market exhibits a moderately concentrated structure, with a Herfindahl-Hirschman Index (HHI) of xx. Key players like SC Storage, Extra Space Pte Ltd, Metropolitan Lifestyle (H K) Limited, Storefriendly Self Storage Group, Red Box Storage, Boxful Self Storage, Cube Self Storage, Apple Storage (tai Yau Storage Group Limited), Spacebox Limited, In N Out Storage, Hongkong Storage, and Storhub Self Storage compete across various segments. Innovation drivers include technological advancements in security, access control, and space optimization. Regulatory impacts, primarily related to land use and building codes, influence market expansion. Product substitutes, such as cloud storage solutions, pose a limited threat. End-user segmentation comprises personal and business users, with the latter showing increasing demand. M&A activity has been significant, with xx Million in deals recorded between 2019 and 2024, reflecting consolidation and expansion strategies.
- Market Concentration: HHI of xx indicating a moderately concentrated market.
- Innovation Drivers: Smart storage solutions, enhanced security features, online booking platforms.
- Regulatory Impacts: Land use regulations, building codes, environmental compliance.
- Product Substitutes: Cloud storage, alternative storage solutions.
- End-User Segmentation: Personal (xx Million), Business (xx Million)
- M&A Trends: xx Million in deal value between 2019 and 2024.
Hong Kong Storage Industry Market Trends & Opportunities
The Hong Kong storage market is experiencing significant growth, fueled by several key trends. The increasing urbanization and limited residential space drive demand for personal storage solutions. Simultaneously, the thriving business sector and e-commerce boom are boosting the need for business storage. Technological advancements, such as automated storage and retrieval systems and enhanced security features, are improving efficiency and attracting customers. Consumer preferences are shifting towards flexible lease terms, convenient access, and value-added services. The competitive landscape is dynamic, with established players and new entrants vying for market share. The market size is projected to expand at a CAGR of xx%, driven by strong demand from both personal and business users. Market penetration rates are currently at xx% and are expected to reach xx% by 2033.
Dominant Markets & Segments in Hong Kong Storage Industry
The Hong Kong storage market shows strong growth across both personal and business segments. However, the business segment is demonstrating faster growth due to the expansion of e-commerce and SMEs. Key regions within Hong Kong with higher storage demand include urban centers with limited space and strong commercial activity.
- Key Growth Drivers (Business Segment):
- Rise of e-commerce and online retail.
- Growth of small and medium-sized enterprises (SMEs).
- Increasing need for inventory management and logistics solutions.
- Key Growth Drivers (Personal Segment):
- Urbanization and limited living space.
- Increased consumer demand for convenience and storage solutions.
- Rising disposable incomes in Hong Kong.
The analysis indicates that the business segment will continue to dominate the market share due to strong growth in e-commerce and the rising number of SMEs.
Hong Kong Storage Industry Product Analysis
The Hong Kong storage industry offers a range of products catering to diverse needs. These include climate-controlled units, drive-up units, and specialized storage solutions for specific items like documents or valuable assets. Technological advancements like smart access systems and online booking platforms enhance convenience and security. Competitive advantages are driven by location, price, service quality, and specialized offerings. The market is witnessing a clear shift towards technologically advanced and customer-centric offerings.
Key Drivers, Barriers & Challenges in Hong Kong Storage Industry
Key Drivers:
- Urbanization and Limited Space: Hong Kong’s high population density and limited residential space fuel demand for storage solutions.
- E-commerce Growth: The booming e-commerce sector necessitates efficient storage and logistics for businesses.
- Government Initiatives: Supportive government policies and infrastructure development facilitate market expansion.
Challenges:
- High Land Costs: The high cost of land in Hong Kong presents a significant barrier to market entry and expansion. This impacts the availability and affordability of storage units.
- Competition: The increasing number of players intensifies competition, potentially squeezing profit margins.
- Regulatory Hurdles: Complex land use regulations and building codes can hinder the development of new storage facilities.
Growth Drivers in the Hong Kong Storage Industry Market
The Hong Kong storage industry's growth is propelled by urbanization, limited living space, and the thriving e-commerce sector. Government initiatives supporting logistics and infrastructure development further boost the market. Technological advancements offering enhanced security, convenience, and space optimization are also key drivers.
Challenges Impacting Hong Kong Storage Industry Growth
High land costs restrict expansion, while intense competition and complex regulatory hurdles create barriers to entry and growth. Supply chain disruptions can impact the availability of materials, hindering the construction and operation of new facilities. These factors constrain market growth potential.
Key Players Shaping the Hong Kong Storage Industry Market
- SC Storage
- Extra Space Pte Ltd
- Metropolitan Lifestyle (H K) Limited
- Storefriendly Self Storage Group
- Red Box Storage
- Boxful Self Storage
- Cube Self Storage
- Apple Storage (tai Yau Storage Group Limited)
- Spacebox Limited
- In N Out Storage
- Hongkong Storage
- Storhub Self Storage
Significant Hong Kong Storage Industry Industry Milestones
- April 2023: Storefriendly launched two new locations on Hong Kong Island and in the New Territories. This expansion significantly increased the company's market share.
- December 2023: A Blackstone-StoreFriendly joint venture acquired an industrial building in Tsuen Wan for HKD560 million (USD 72 million), signaling further market consolidation and expansion plans.
Future Outlook for Hong Kong Storage Industry Market
The Hong Kong storage industry is poised for sustained growth, driven by continued urbanization, e-commerce expansion, and supportive government policies. Strategic opportunities exist for innovative companies offering technologically advanced solutions and tailored services. The market's potential is substantial, with significant growth expected in both the personal and business segments.
Hong Kong Storage Industry Segmentation
-
1. End User
- 1.1. Personal
- 1.2. Business
Hong Kong Storage Industry Segmentation By Geography
-
1. North America
- 1.1. United States
- 1.2. Canada
- 1.3. Mexico
-
2. South America
- 2.1. Brazil
- 2.2. Argentina
- 2.3. Rest of South America
-
3. Europe
- 3.1. United Kingdom
- 3.2. Germany
- 3.3. France
- 3.4. Italy
- 3.5. Spain
- 3.6. Russia
- 3.7. Benelux
- 3.8. Nordics
- 3.9. Rest of Europe
-
4. Middle East & Africa
- 4.1. Turkey
- 4.2. Israel
- 4.3. GCC
- 4.4. North Africa
- 4.5. South Africa
- 4.6. Rest of Middle East & Africa
-
5. Asia Pacific
- 5.1. China
- 5.2. India
- 5.3. Japan
- 5.4. South Korea
- 5.5. ASEAN
- 5.6. Oceania
- 5.7. Rest of Asia Pacific
Hong Kong Storage Industry REPORT HIGHLIGHTS
| Aspects | Details |
|---|---|
| Study Period | 2019-2033 |
| Base Year | 2024 |
| Estimated Year | 2025 |
| Forecast Period | 2025-2033 |
| Historical Period | 2019-2024 |
| Growth Rate | CAGR of 8.00% from 2019-2033 |
| Segmentation |
|
Table of Contents
- 1. Introduction
- 1.1. Research Scope
- 1.2. Market Segmentation
- 1.3. Research Methodology
- 1.4. Definitions and Assumptions
- 2. Executive Summary
- 2.1. Introduction
- 3. Market Dynamics
- 3.1. Introduction
- 3.2. Market Drivers
- 3.2.1. Growing Population Density is the Key Driver of the Market
- 3.3. Market Restrains
- 3.3.1. Lack of Enough Space to Build Self-storage Facilities
- 3.4. Market Trends
- 3.4.1. Personal Segment is Expected to Drive the Market
- 4. Market Factor Analysis
- 4.1. Porters Five Forces
- 4.2. Supply/Value Chain
- 4.3. PESTEL analysis
- 4.4. Market Entropy
- 4.5. Patent/Trademark Analysis
- 5. Global Hong Kong Storage Industry Analysis, Insights and Forecast, 2019-2031
- 5.1. Market Analysis, Insights and Forecast - by End User
- 5.1.1. Personal
- 5.1.2. Business
- 5.2. Market Analysis, Insights and Forecast - by Region
- 5.2.1. North America
- 5.2.2. South America
- 5.2.3. Europe
- 5.2.4. Middle East & Africa
- 5.2.5. Asia Pacific
- 5.1. Market Analysis, Insights and Forecast - by End User
- 6. North America Hong Kong Storage Industry Analysis, Insights and Forecast, 2019-2031
- 6.1. Market Analysis, Insights and Forecast - by End User
- 6.1.1. Personal
- 6.1.2. Business
- 6.1. Market Analysis, Insights and Forecast - by End User
- 7. South America Hong Kong Storage Industry Analysis, Insights and Forecast, 2019-2031
- 7.1. Market Analysis, Insights and Forecast - by End User
- 7.1.1. Personal
- 7.1.2. Business
- 7.1. Market Analysis, Insights and Forecast - by End User
- 8. Europe Hong Kong Storage Industry Analysis, Insights and Forecast, 2019-2031
- 8.1. Market Analysis, Insights and Forecast - by End User
- 8.1.1. Personal
- 8.1.2. Business
- 8.1. Market Analysis, Insights and Forecast - by End User
- 9. Middle East & Africa Hong Kong Storage Industry Analysis, Insights and Forecast, 2019-2031
- 9.1. Market Analysis, Insights and Forecast - by End User
- 9.1.1. Personal
- 9.1.2. Business
- 9.1. Market Analysis, Insights and Forecast - by End User
- 10. Asia Pacific Hong Kong Storage Industry Analysis, Insights and Forecast, 2019-2031
- 10.1. Market Analysis, Insights and Forecast - by End User
- 10.1.1. Personal
- 10.1.2. Business
- 10.1. Market Analysis, Insights and Forecast - by End User
- 11. Competitive Analysis
- 11.1. Global Market Share Analysis 2024
- 11.2. Company Profiles
- 11.2.1 SC Storage
- 11.2.1.1. Overview
- 11.2.1.2. Products
- 11.2.1.3. SWOT Analysis
- 11.2.1.4. Recent Developments
- 11.2.1.5. Financials (Based on Availability)
- 11.2.2 Extra Space Pte Ltd
- 11.2.2.1. Overview
- 11.2.2.2. Products
- 11.2.2.3. SWOT Analysis
- 11.2.2.4. Recent Developments
- 11.2.2.5. Financials (Based on Availability)
- 11.2.3 Metropolitan Lifestyle (H K) Limited
- 11.2.3.1. Overview
- 11.2.3.2. Products
- 11.2.3.3. SWOT Analysis
- 11.2.3.4. Recent Developments
- 11.2.3.5. Financials (Based on Availability)
- 11.2.4 Storefriendly Self Storage Group
- 11.2.4.1. Overview
- 11.2.4.2. Products
- 11.2.4.3. SWOT Analysis
- 11.2.4.4. Recent Developments
- 11.2.4.5. Financials (Based on Availability)
- 11.2.5 Red Box Storage
- 11.2.5.1. Overview
- 11.2.5.2. Products
- 11.2.5.3. SWOT Analysis
- 11.2.5.4. Recent Developments
- 11.2.5.5. Financials (Based on Availability)
- 11.2.6 Boxful Self Storage
- 11.2.6.1. Overview
- 11.2.6.2. Products
- 11.2.6.3. SWOT Analysis
- 11.2.6.4. Recent Developments
- 11.2.6.5. Financials (Based on Availability)
- 11.2.7 Cube Self Storage
- 11.2.7.1. Overview
- 11.2.7.2. Products
- 11.2.7.3. SWOT Analysis
- 11.2.7.4. Recent Developments
- 11.2.7.5. Financials (Based on Availability)
- 11.2.8 Apple Storage (tai Yau Storage Group Limited)
- 11.2.8.1. Overview
- 11.2.8.2. Products
- 11.2.8.3. SWOT Analysis
- 11.2.8.4. Recent Developments
- 11.2.8.5. Financials (Based on Availability)
- 11.2.9 Spacebox Limited
- 11.2.9.1. Overview
- 11.2.9.2. Products
- 11.2.9.3. SWOT Analysis
- 11.2.9.4. Recent Developments
- 11.2.9.5. Financials (Based on Availability)
- 11.2.10 In N Out Storage
- 11.2.10.1. Overview
- 11.2.10.2. Products
- 11.2.10.3. SWOT Analysis
- 11.2.10.4. Recent Developments
- 11.2.10.5. Financials (Based on Availability)
- 11.2.11 Hongkong Storage
- 11.2.11.1. Overview
- 11.2.11.2. Products
- 11.2.11.3. SWOT Analysis
- 11.2.11.4. Recent Developments
- 11.2.11.5. Financials (Based on Availability)
- 11.2.12 Storhub Self Storage*List Not Exhaustive
- 11.2.12.1. Overview
- 11.2.12.2. Products
- 11.2.12.3. SWOT Analysis
- 11.2.12.4. Recent Developments
- 11.2.12.5. Financials (Based on Availability)
- 11.2.1 SC Storage
List of Figures
- Figure 1: Global Hong Kong Storage Industry Revenue Breakdown (Million, %) by Region 2024 & 2032
- Figure 2: Global Hong Kong Storage Industry Volume Breakdown (Million, %) by Region 2024 & 2032
- Figure 3: Hong Kong Hong Kong Storage Industry Revenue (Million), by Country 2024 & 2032
- Figure 4: Hong Kong Hong Kong Storage Industry Volume (Million), by Country 2024 & 2032
- Figure 5: Hong Kong Hong Kong Storage Industry Revenue Share (%), by Country 2024 & 2032
- Figure 6: Hong Kong Hong Kong Storage Industry Volume Share (%), by Country 2024 & 2032
- Figure 7: North America Hong Kong Storage Industry Revenue (Million), by End User 2024 & 2032
- Figure 8: North America Hong Kong Storage Industry Volume (Million), by End User 2024 & 2032
- Figure 9: North America Hong Kong Storage Industry Revenue Share (%), by End User 2024 & 2032
- Figure 10: North America Hong Kong Storage Industry Volume Share (%), by End User 2024 & 2032
- Figure 11: North America Hong Kong Storage Industry Revenue (Million), by Country 2024 & 2032
- Figure 12: North America Hong Kong Storage Industry Volume (Million), by Country 2024 & 2032
- Figure 13: North America Hong Kong Storage Industry Revenue Share (%), by Country 2024 & 2032
- Figure 14: North America Hong Kong Storage Industry Volume Share (%), by Country 2024 & 2032
- Figure 15: South America Hong Kong Storage Industry Revenue (Million), by End User 2024 & 2032
- Figure 16: South America Hong Kong Storage Industry Volume (Million), by End User 2024 & 2032
- Figure 17: South America Hong Kong Storage Industry Revenue Share (%), by End User 2024 & 2032
- Figure 18: South America Hong Kong Storage Industry Volume Share (%), by End User 2024 & 2032
- Figure 19: South America Hong Kong Storage Industry Revenue (Million), by Country 2024 & 2032
- Figure 20: South America Hong Kong Storage Industry Volume (Million), by Country 2024 & 2032
- Figure 21: South America Hong Kong Storage Industry Revenue Share (%), by Country 2024 & 2032
- Figure 22: South America Hong Kong Storage Industry Volume Share (%), by Country 2024 & 2032
- Figure 23: Europe Hong Kong Storage Industry Revenue (Million), by End User 2024 & 2032
- Figure 24: Europe Hong Kong Storage Industry Volume (Million), by End User 2024 & 2032
- Figure 25: Europe Hong Kong Storage Industry Revenue Share (%), by End User 2024 & 2032
- Figure 26: Europe Hong Kong Storage Industry Volume Share (%), by End User 2024 & 2032
- Figure 27: Europe Hong Kong Storage Industry Revenue (Million), by Country 2024 & 2032
- Figure 28: Europe Hong Kong Storage Industry Volume (Million), by Country 2024 & 2032
- Figure 29: Europe Hong Kong Storage Industry Revenue Share (%), by Country 2024 & 2032
- Figure 30: Europe Hong Kong Storage Industry Volume Share (%), by Country 2024 & 2032
- Figure 31: Middle East & Africa Hong Kong Storage Industry Revenue (Million), by End User 2024 & 2032
- Figure 32: Middle East & Africa Hong Kong Storage Industry Volume (Million), by End User 2024 & 2032
- Figure 33: Middle East & Africa Hong Kong Storage Industry Revenue Share (%), by End User 2024 & 2032
- Figure 34: Middle East & Africa Hong Kong Storage Industry Volume Share (%), by End User 2024 & 2032
- Figure 35: Middle East & Africa Hong Kong Storage Industry Revenue (Million), by Country 2024 & 2032
- Figure 36: Middle East & Africa Hong Kong Storage Industry Volume (Million), by Country 2024 & 2032
- Figure 37: Middle East & Africa Hong Kong Storage Industry Revenue Share (%), by Country 2024 & 2032
- Figure 38: Middle East & Africa Hong Kong Storage Industry Volume Share (%), by Country 2024 & 2032
- Figure 39: Asia Pacific Hong Kong Storage Industry Revenue (Million), by End User 2024 & 2032
- Figure 40: Asia Pacific Hong Kong Storage Industry Volume (Million), by End User 2024 & 2032
- Figure 41: Asia Pacific Hong Kong Storage Industry Revenue Share (%), by End User 2024 & 2032
- Figure 42: Asia Pacific Hong Kong Storage Industry Volume Share (%), by End User 2024 & 2032
- Figure 43: Asia Pacific Hong Kong Storage Industry Revenue (Million), by Country 2024 & 2032
- Figure 44: Asia Pacific Hong Kong Storage Industry Volume (Million), by Country 2024 & 2032
- Figure 45: Asia Pacific Hong Kong Storage Industry Revenue Share (%), by Country 2024 & 2032
- Figure 46: Asia Pacific Hong Kong Storage Industry Volume Share (%), by Country 2024 & 2032
List of Tables
- Table 1: Global Hong Kong Storage Industry Revenue Million Forecast, by Region 2019 & 2032
- Table 2: Global Hong Kong Storage Industry Volume Million Forecast, by Region 2019 & 2032
- Table 3: Global Hong Kong Storage Industry Revenue Million Forecast, by End User 2019 & 2032
- Table 4: Global Hong Kong Storage Industry Volume Million Forecast, by End User 2019 & 2032
- Table 5: Global Hong Kong Storage Industry Revenue Million Forecast, by Region 2019 & 2032
- Table 6: Global Hong Kong Storage Industry Volume Million Forecast, by Region 2019 & 2032
- Table 7: Global Hong Kong Storage Industry Revenue Million Forecast, by Country 2019 & 2032
- Table 8: Global Hong Kong Storage Industry Volume Million Forecast, by Country 2019 & 2032
- Table 9: Global Hong Kong Storage Industry Revenue Million Forecast, by End User 2019 & 2032
- Table 10: Global Hong Kong Storage Industry Volume Million Forecast, by End User 2019 & 2032
- Table 11: Global Hong Kong Storage Industry Revenue Million Forecast, by Country 2019 & 2032
- Table 12: Global Hong Kong Storage Industry Volume Million Forecast, by Country 2019 & 2032
- Table 13: United States Hong Kong Storage Industry Revenue (Million) Forecast, by Application 2019 & 2032
- Table 14: United States Hong Kong Storage Industry Volume (Million) Forecast, by Application 2019 & 2032
- Table 15: Canada Hong Kong Storage Industry Revenue (Million) Forecast, by Application 2019 & 2032
- Table 16: Canada Hong Kong Storage Industry Volume (Million) Forecast, by Application 2019 & 2032
- Table 17: Mexico Hong Kong Storage Industry Revenue (Million) Forecast, by Application 2019 & 2032
- Table 18: Mexico Hong Kong Storage Industry Volume (Million) Forecast, by Application 2019 & 2032
- Table 19: Global Hong Kong Storage Industry Revenue Million Forecast, by End User 2019 & 2032
- Table 20: Global Hong Kong Storage Industry Volume Million Forecast, by End User 2019 & 2032
- Table 21: Global Hong Kong Storage Industry Revenue Million Forecast, by Country 2019 & 2032
- Table 22: Global Hong Kong Storage Industry Volume Million Forecast, by Country 2019 & 2032
- Table 23: Brazil Hong Kong Storage Industry Revenue (Million) Forecast, by Application 2019 & 2032
- Table 24: Brazil Hong Kong Storage Industry Volume (Million) Forecast, by Application 2019 & 2032
- Table 25: Argentina Hong Kong Storage Industry Revenue (Million) Forecast, by Application 2019 & 2032
- Table 26: Argentina Hong Kong Storage Industry Volume (Million) Forecast, by Application 2019 & 2032
- Table 27: Rest of South America Hong Kong Storage Industry Revenue (Million) Forecast, by Application 2019 & 2032
- Table 28: Rest of South America Hong Kong Storage Industry Volume (Million) Forecast, by Application 2019 & 2032
- Table 29: Global Hong Kong Storage Industry Revenue Million Forecast, by End User 2019 & 2032
- Table 30: Global Hong Kong Storage Industry Volume Million Forecast, by End User 2019 & 2032
- Table 31: Global Hong Kong Storage Industry Revenue Million Forecast, by Country 2019 & 2032
- Table 32: Global Hong Kong Storage Industry Volume Million Forecast, by Country 2019 & 2032
- Table 33: United Kingdom Hong Kong Storage Industry Revenue (Million) Forecast, by Application 2019 & 2032
- Table 34: United Kingdom Hong Kong Storage Industry Volume (Million) Forecast, by Application 2019 & 2032
- Table 35: Germany Hong Kong Storage Industry Revenue (Million) Forecast, by Application 2019 & 2032
- Table 36: Germany Hong Kong Storage Industry Volume (Million) Forecast, by Application 2019 & 2032
- Table 37: France Hong Kong Storage Industry Revenue (Million) Forecast, by Application 2019 & 2032
- Table 38: France Hong Kong Storage Industry Volume (Million) Forecast, by Application 2019 & 2032
- Table 39: Italy Hong Kong Storage Industry Revenue (Million) Forecast, by Application 2019 & 2032
- Table 40: Italy Hong Kong Storage Industry Volume (Million) Forecast, by Application 2019 & 2032
- Table 41: Spain Hong Kong Storage Industry Revenue (Million) Forecast, by Application 2019 & 2032
- Table 42: Spain Hong Kong Storage Industry Volume (Million) Forecast, by Application 2019 & 2032
- Table 43: Russia Hong Kong Storage Industry Revenue (Million) Forecast, by Application 2019 & 2032
- Table 44: Russia Hong Kong Storage Industry Volume (Million) Forecast, by Application 2019 & 2032
- Table 45: Benelux Hong Kong Storage Industry Revenue (Million) Forecast, by Application 2019 & 2032
- Table 46: Benelux Hong Kong Storage Industry Volume (Million) Forecast, by Application 2019 & 2032
- Table 47: Nordics Hong Kong Storage Industry Revenue (Million) Forecast, by Application 2019 & 2032
- Table 48: Nordics Hong Kong Storage Industry Volume (Million) Forecast, by Application 2019 & 2032
- Table 49: Rest of Europe Hong Kong Storage Industry Revenue (Million) Forecast, by Application 2019 & 2032
- Table 50: Rest of Europe Hong Kong Storage Industry Volume (Million) Forecast, by Application 2019 & 2032
- Table 51: Global Hong Kong Storage Industry Revenue Million Forecast, by End User 2019 & 2032
- Table 52: Global Hong Kong Storage Industry Volume Million Forecast, by End User 2019 & 2032
- Table 53: Global Hong Kong Storage Industry Revenue Million Forecast, by Country 2019 & 2032
- Table 54: Global Hong Kong Storage Industry Volume Million Forecast, by Country 2019 & 2032
- Table 55: Turkey Hong Kong Storage Industry Revenue (Million) Forecast, by Application 2019 & 2032
- Table 56: Turkey Hong Kong Storage Industry Volume (Million) Forecast, by Application 2019 & 2032
- Table 57: Israel Hong Kong Storage Industry Revenue (Million) Forecast, by Application 2019 & 2032
- Table 58: Israel Hong Kong Storage Industry Volume (Million) Forecast, by Application 2019 & 2032
- Table 59: GCC Hong Kong Storage Industry Revenue (Million) Forecast, by Application 2019 & 2032
- Table 60: GCC Hong Kong Storage Industry Volume (Million) Forecast, by Application 2019 & 2032
- Table 61: North Africa Hong Kong Storage Industry Revenue (Million) Forecast, by Application 2019 & 2032
- Table 62: North Africa Hong Kong Storage Industry Volume (Million) Forecast, by Application 2019 & 2032
- Table 63: South Africa Hong Kong Storage Industry Revenue (Million) Forecast, by Application 2019 & 2032
- Table 64: South Africa Hong Kong Storage Industry Volume (Million) Forecast, by Application 2019 & 2032
- Table 65: Rest of Middle East & Africa Hong Kong Storage Industry Revenue (Million) Forecast, by Application 2019 & 2032
- Table 66: Rest of Middle East & Africa Hong Kong Storage Industry Volume (Million) Forecast, by Application 2019 & 2032
- Table 67: Global Hong Kong Storage Industry Revenue Million Forecast, by End User 2019 & 2032
- Table 68: Global Hong Kong Storage Industry Volume Million Forecast, by End User 2019 & 2032
- Table 69: Global Hong Kong Storage Industry Revenue Million Forecast, by Country 2019 & 2032
- Table 70: Global Hong Kong Storage Industry Volume Million Forecast, by Country 2019 & 2032
- Table 71: China Hong Kong Storage Industry Revenue (Million) Forecast, by Application 2019 & 2032
- Table 72: China Hong Kong Storage Industry Volume (Million) Forecast, by Application 2019 & 2032
- Table 73: India Hong Kong Storage Industry Revenue (Million) Forecast, by Application 2019 & 2032
- Table 74: India Hong Kong Storage Industry Volume (Million) Forecast, by Application 2019 & 2032
- Table 75: Japan Hong Kong Storage Industry Revenue (Million) Forecast, by Application 2019 & 2032
- Table 76: Japan Hong Kong Storage Industry Volume (Million) Forecast, by Application 2019 & 2032
- Table 77: South Korea Hong Kong Storage Industry Revenue (Million) Forecast, by Application 2019 & 2032
- Table 78: South Korea Hong Kong Storage Industry Volume (Million) Forecast, by Application 2019 & 2032
- Table 79: ASEAN Hong Kong Storage Industry Revenue (Million) Forecast, by Application 2019 & 2032
- Table 80: ASEAN Hong Kong Storage Industry Volume (Million) Forecast, by Application 2019 & 2032
- Table 81: Oceania Hong Kong Storage Industry Revenue (Million) Forecast, by Application 2019 & 2032
- Table 82: Oceania Hong Kong Storage Industry Volume (Million) Forecast, by Application 2019 & 2032
- Table 83: Rest of Asia Pacific Hong Kong Storage Industry Revenue (Million) Forecast, by Application 2019 & 2032
- Table 84: Rest of Asia Pacific Hong Kong Storage Industry Volume (Million) Forecast, by Application 2019 & 2032
Frequently Asked Questions
1. What is the projected Compound Annual Growth Rate (CAGR) of the Hong Kong Storage Industry?
The projected CAGR is approximately 8.00%.
2. Which companies are prominent players in the Hong Kong Storage Industry?
Key companies in the market include SC Storage, Extra Space Pte Ltd, Metropolitan Lifestyle (H K) Limited, Storefriendly Self Storage Group, Red Box Storage, Boxful Self Storage, Cube Self Storage, Apple Storage (tai Yau Storage Group Limited), Spacebox Limited, In N Out Storage, Hongkong Storage, Storhub Self Storage*List Not Exhaustive.
3. What are the main segments of the Hong Kong Storage Industry?
The market segments include End User.
4. Can you provide details about the market size?
The market size is estimated to be USD XX Million as of 2022.
5. What are some drivers contributing to market growth?
Growing Population Density is the Key Driver of the Market.
6. What are the notable trends driving market growth?
Personal Segment is Expected to Drive the Market.
7. Are there any restraints impacting market growth?
Lack of Enough Space to Build Self-storage Facilities.
8. Can you provide examples of recent developments in the market?
April 2023 - Storefriendly, the Asia self-storage operator backed by investment giant Blackstone, recently introduced its two latest locations at redeveloped properties on Hong Kong Island and in the New Territories.
9. What pricing options are available for accessing the report?
Pricing options include single-user, multi-user, and enterprise licenses priced at USD 3800, USD 4500, and USD 5800 respectively.
10. Is the market size provided in terms of value or volume?
The market size is provided in terms of value, measured in Million and volume, measured in Million.
11. Are there any specific market keywords associated with the report?
Yes, the market keyword associated with the report is "Hong Kong Storage Industry," which aids in identifying and referencing the specific market segment covered.
12. How do I determine which pricing option suits my needs best?
The pricing options vary based on user requirements and access needs. Individual users may opt for single-user licenses, while businesses requiring broader access may choose multi-user or enterprise licenses for cost-effective access to the report.
13. Are there any additional resources or data provided in the Hong Kong Storage Industry report?
While the report offers comprehensive insights, it's advisable to review the specific contents or supplementary materials provided to ascertain if additional resources or data are available.
14. How can I stay updated on further developments or reports in the Hong Kong Storage Industry?
To stay informed about further developments, trends, and reports in the Hong Kong Storage Industry, consider subscribing to industry newsletters, following relevant companies and organizations, or regularly checking reputable industry news sources and publications.
Methodology
Step 1 - Identification of Relevant Samples Size from Population Database


Step 2 - Approaches for Defining Global Market Size (Value, Volume* & Price*)

Note*: In applicable scenarios
Step 3 - Data Sources
Primary Research
- Web Analytics
- Survey Reports
- Research Institute
- Latest Research Reports
- Opinion Leaders
Secondary Research
- Annual Reports
- White Paper
- Latest Press Release
- Industry Association
- Paid Database
- Investor Presentations

Step 4 - Data Triangulation
Involves using different sources of information in order to increase the validity of a study
These sources are likely to be stakeholders in a program - participants, other researchers, program staff, other community members, and so on.
Then we put all data in single framework & apply various statistical tools to find out the dynamic on the market.
During the analysis stage, feedback from the stakeholder groups would be compared to determine areas of agreement as well as areas of divergence
