

Key Insights
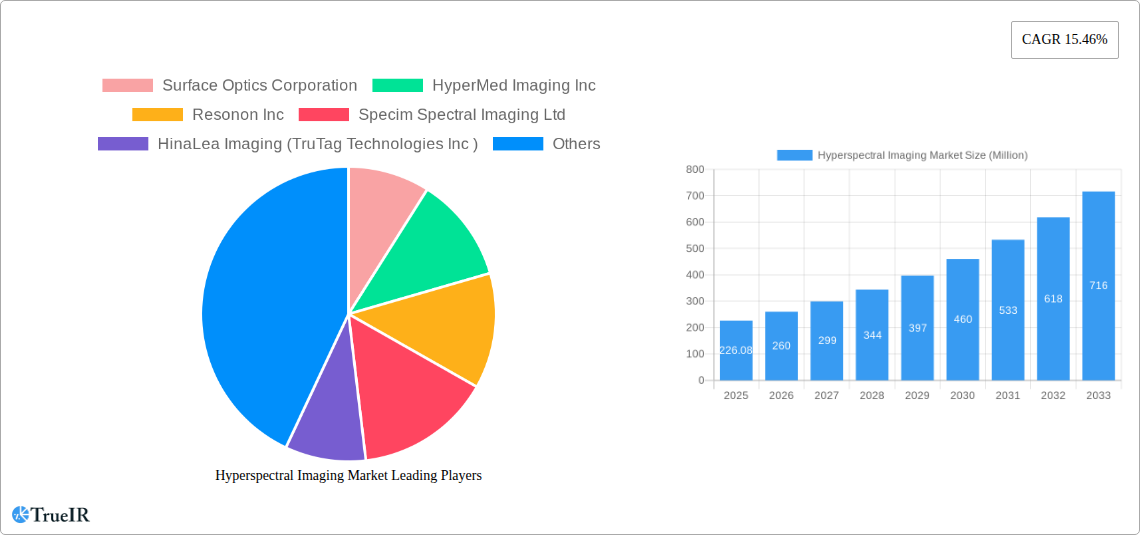
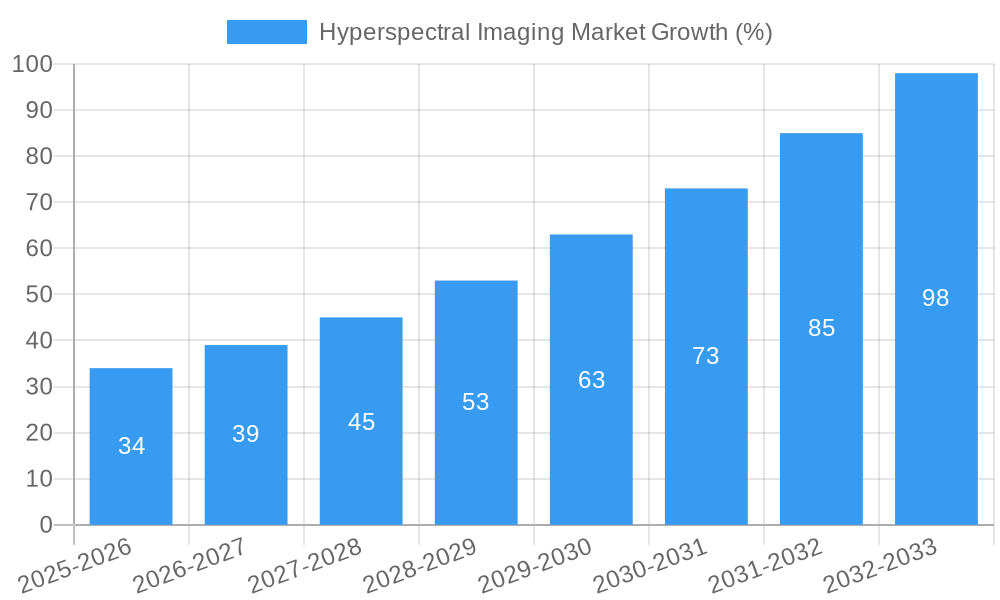
The hyperspectral imaging market is experiencing robust growth, projected to reach \$226.08 million in 2025 and expanding at a Compound Annual Growth Rate (CAGR) of 15.46% from 2025 to 2033. This significant expansion is driven by increasing demand across diverse sectors. The food and agriculture industry leverages hyperspectral imaging for quality control, crop monitoring, and precision farming, leading to higher yields and reduced waste. Similarly, the healthcare sector utilizes this technology for advanced diagnostics, disease detection, and drug discovery, improving patient outcomes. Defense applications, including surveillance and target identification, further fuel market growth. Mining and metrology also benefit from its precise material analysis capabilities. Technological advancements, such as the development of more compact and cost-effective sensors, are accelerating market penetration. Furthermore, the growing integration of hyperspectral imaging with artificial intelligence (AI) and machine learning (ML) algorithms is enhancing data analysis and automation, expanding its application potential. Despite this strong momentum, challenges remain, including the high initial investment costs associated with hyperspectral imaging systems and the need for specialized expertise in data analysis. Nevertheless, the continued technological innovations and expanding application base are poised to overcome these restraints, driving substantial market expansion in the coming years.
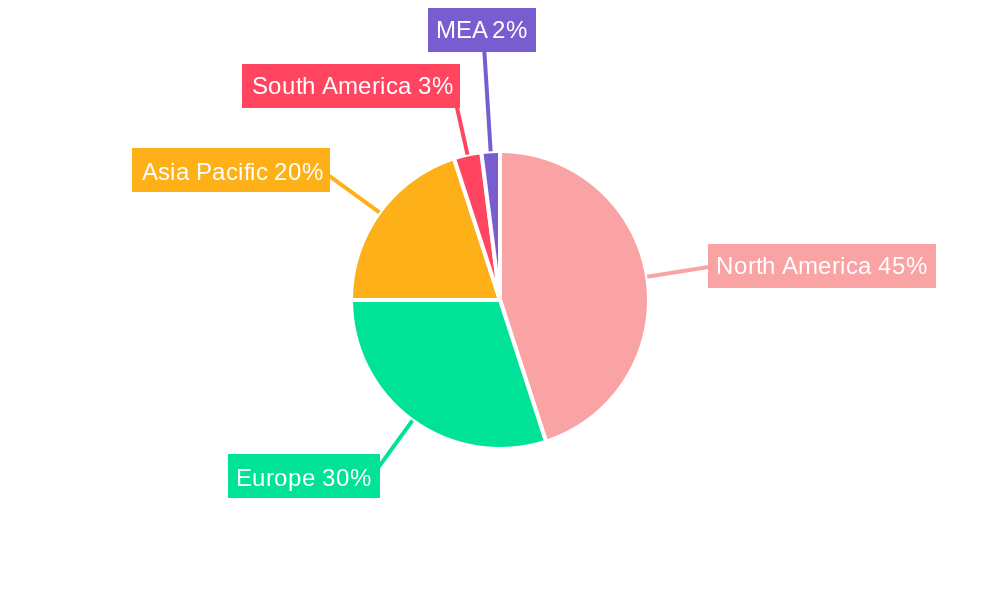
The key players in the hyperspectral imaging market, such as Surface Optics Corporation, HyperMed Imaging Inc., and Resonon Inc., are actively investing in research and development, focusing on improving sensor performance, enhancing software capabilities, and expanding their product portfolios. Geographic expansion is also a key strategy, with North America currently dominating the market due to the presence of major technology players and strong adoption across various sectors. However, rapidly developing economies in Asia-Pacific and increasing investments in advanced technologies in regions like Europe are expected to drive regional market share diversification over the forecast period. The competitive landscape is characterized by both established players and emerging companies, creating a dynamic market with continuous innovation and increasing accessibility of hyperspectral imaging solutions to diverse industries. This competitive environment fosters innovation and encourages the development of more affordable and user-friendly systems.
Hyperspectral Imaging Market: A Comprehensive Report (2019-2033)
This dynamic report provides a detailed analysis of the Hyperspectral Imaging market, offering invaluable insights for industry stakeholders, investors, and researchers. Covering the period from 2019 to 2033, with a focus on 2025, this report delves into market size, segmentation, competitive landscape, growth drivers, and future outlook. The report leverages extensive data and analysis to provide a comprehensive understanding of this rapidly evolving market, projected to reach xx Million by 2033.
Hyperspectral Imaging Market Structure & Competitive Landscape
The hyperspectral imaging market exhibits a moderately concentrated structure, with a handful of major players and numerous smaller, specialized firms. The market concentration ratio (CR4) is estimated at xx%, indicating a competitive landscape with both established players and emerging innovators. Innovation is a key driver, fueled by advancements in sensor technology, data processing capabilities, and application-specific software solutions. Regulatory frameworks, particularly those related to data privacy and safety standards in specific end-user verticals, exert a significant influence on market dynamics. Product substitutes, such as traditional multispectral imaging, present a degree of competitive pressure, albeit limited due to hyperspectral imaging's superior spectral resolution and detailed data output. The market is segmented by end-user, including Food and Agriculture, Healthcare, Defense, Mining and Metrology, and Other End-user Verticals, each exhibiting unique growth trajectories and technological requirements. Mergers and acquisitions (M&A) activity has been relatively moderate in recent years, with a total M&A volume estimated at xx Million in the last five years, primarily focused on strengthening technological capabilities and expanding market reach.
- Market Concentration: CR4 estimated at xx%
- Innovation Drivers: Sensor technology advancements, data processing, application-specific software.
- Regulatory Impacts: Data privacy and safety standards influence market growth in specific sectors.
- Product Substitutes: Multispectral imaging poses limited competition.
- End-user Segmentation: Food & Agriculture, Healthcare, Defense, Mining & Metrology, Other.
- M&A Trends: Moderate activity, xx Million in volume over the past five years.
Hyperspectral Imaging Market Trends & Opportunities
The global hyperspectral imaging market is experiencing robust growth, with a projected Compound Annual Growth Rate (CAGR) of xx% during the forecast period (2025-2033). This growth is fueled by several key trends: increasing adoption across diverse end-user sectors, driven by the technology's ability to provide detailed spectral information for enhanced analysis and decision-making; technological advancements resulting in smaller, lighter, and more cost-effective hyperspectral imaging systems; and rising demand for precision agriculture, improved healthcare diagnostics, and enhanced remote sensing applications. Consumer preferences are shifting toward non-destructive, rapid analysis techniques, directly benefiting hyperspectral imaging's adoption. Market penetration rates vary across sectors, with the highest penetration in xx, followed by xx and xx. The competitive dynamics remain intense, with established players focusing on innovation and product diversification while new entrants concentrate on niche applications and technological disruption.
Dominant Markets & Segments in Hyperspectral Imaging Market
The North American market currently dominates the hyperspectral imaging landscape, accounting for approximately xx% of the global market share in 2025. This dominance is attributed to robust R&D investments, early adoption of advanced technologies, and a strong presence of major hyperspectral imaging companies. Within end-user segments, the Healthcare sector exhibits the highest growth potential, driven by increasing demand for advanced medical diagnostics and personalized medicine. The Food and Agriculture segment is also experiencing rapid growth, fueled by increasing demand for quality control, improved crop monitoring, and precision agriculture practices. Other key segments, such as Defense and Mining, showcase steady growth, supported by specific applications.
Key Growth Drivers (North America):
- Strong R&D infrastructure and investments.
- Early adoption of advanced technologies.
- Significant presence of leading hyperspectral imaging companies.
Healthcare Segment Growth: Driven by advanced diagnostics and personalized medicine.
Food and Agriculture Segment Growth: Quality control, crop monitoring, precision agriculture.
Defense and Mining Segments: Steady growth driven by specific application needs.
Hyperspectral Imaging Market Product Analysis
Hyperspectral imaging product innovation focuses on improving spectral resolution, spatial resolution, speed, and portability. Recent advancements include the development of compact, lightweight systems suitable for field applications and integration with advanced data processing algorithms for real-time analysis. The competitive advantage lies in offering superior image quality, improved data analysis capabilities, user-friendly interfaces, and cost-effectiveness. The market is witnessing a trend toward integrated solutions, combining hyperspectral imaging hardware with specialized software and data analytics platforms.
Key Drivers, Barriers & Challenges in Hyperspectral Imaging Market
Key Drivers: Technological advancements leading to miniaturization, improved sensitivity, and faster processing; increasing demand across diverse sectors for improved analytics; supportive government initiatives and funding for research and development in specific applications.
Challenges: High initial investment costs for advanced systems, lack of skilled personnel to operate and analyze data, complexity of data processing and interpretation, and potentially stringent regulatory frameworks in certain industries limiting market access. Supply chain disruptions may impact availability and pricing. Competitive pressure from established players and the emergence of new technologies can constrain growth.
Growth Drivers in the Hyperspectral Imaging Market
The hyperspectral imaging market is primarily driven by technological advancements resulting in cost-effective and more portable devices. Increased demand for precise analysis in diverse sectors such as healthcare, agriculture, and defense further fuels this growth. Government support for research and development in specific applications adds momentum.
Challenges Impacting Hyperspectral Imaging Market Growth
High initial investment costs and the need for specialized expertise in data analysis pose significant challenges. Regulatory hurdles, particularly in industries with strict data handling protocols, might impede market penetration. The competitive landscape, with both established players and new entrants, adds complexity. Supply chain vulnerabilities can impact timely delivery and pricing.
Key Players Shaping the Hyperspectral Imaging Market
- Surface Optics Corporation
- HyperMed Imaging Inc
- Resonon Inc
- Specim Spectral Imaging Ltd
- HinaLea Imaging (TruTag Technologies Inc)
- Headwall Photonics Inc
- Telops Inc
- Cubert GmbH
- BaySpec Inc
- Galileo Group Inc
- XIMEA GmbH
- Norsk Elektro Optikk AS
- Brimrose Corporation of America
- Corning Incorporated
- ITRES Research Limited
Significant Hyperspectral Imaging Market Industry Milestones
- December 2023: SPECIM launched an upgraded FX50 middle-wave infrared hyperspectral camera with enhanced spectral and spatial resolution, and a high frame rate. This signifies advancements in mid-wave infrared imaging capabilities, opening new applications.
- November 2023: European Space Imaging (EUSI) and Pixxel formed a strategic partnership to bring hyperspectral imaging to the European market, expanding market reach and potential applications in remote sensing.
- June 2023: HinaLea Imaging unveiled a new hyperspectral camera (Model 4455) extending SWIR capabilities for chemical detection and classification, further broadening the application range of hyperspectral imaging.
Future Outlook for Hyperspectral Imaging Market
The hyperspectral imaging market is poised for continued strong growth, driven by ongoing technological innovations and expanding applications across diverse sectors. Strategic partnerships, increased R&D investment, and the development of user-friendly, cost-effective systems will further propel market expansion. The market presents significant opportunities for companies focusing on niche applications and integrating hyperspectral imaging with advanced data analytics platforms. The integration of AI and machine learning into data processing pipelines will further enhance market growth and adoption.
Hyperspectral Imaging Market Segmentation
-
1. End-user Industry
- 1.1. Food and Agriculture
- 1.2. Healthcare
- 1.3. Defense
- 1.4. Mining and Metrology
- 1.5. Recycling
- 1.6. Other End-user Verticals
Hyperspectral Imaging Market Segmentation By Geography
- 1. North America
- 2. Europe
- 3. Asia
- 4. Australia and New Zealand
- 5. Latin America
- 6. Middle East and Africa
Hyperspectral Imaging Market REPORT HIGHLIGHTS
| Aspects | Details |
|---|---|
| Study Period | 2019-2033 |
| Base Year | 2024 |
| Estimated Year | 2025 |
| Forecast Period | 2025-2033 |
| Historical Period | 2019-2024 |
| Growth Rate | CAGR of 15.46% from 2019-2033 |
| Segmentation |
|
Table of Contents
- 1. Introduction
- 1.1. Research Scope
- 1.2. Market Segmentation
- 1.3. Research Methodology
- 1.4. Definitions and Assumptions
- 2. Executive Summary
- 2.1. Introduction
- 3. Market Dynamics
- 3.1. Introduction
- 3.2. Market Drivers
- 3.2.1. Technological Advancements; Increasing Demand for Data Accuracy and Consistency
- 3.3. Market Restrains
- 3.3.1. High Costs Associated with the Use of Hyperspectral Imaging
- 3.4. Market Trends
- 3.4.1. Healthcare to be the Fastest Growing End User Segment
- 4. Market Factor Analysis
- 4.1. Porters Five Forces
- 4.2. Supply/Value Chain
- 4.3. PESTEL analysis
- 4.4. Market Entropy
- 4.5. Patent/Trademark Analysis
- 5. Global Hyperspectral Imaging Market Analysis, Insights and Forecast, 2019-2031
- 5.1. Market Analysis, Insights and Forecast - by End-user Industry
- 5.1.1. Food and Agriculture
- 5.1.2. Healthcare
- 5.1.3. Defense
- 5.1.4. Mining and Metrology
- 5.1.5. Recycling
- 5.1.6. Other End-user Verticals
- 5.2. Market Analysis, Insights and Forecast - by Region
- 5.2.1. North America
- 5.2.2. Europe
- 5.2.3. Asia
- 5.2.4. Australia and New Zealand
- 5.2.5. Latin America
- 5.2.6. Middle East and Africa
- 5.1. Market Analysis, Insights and Forecast - by End-user Industry
- 6. North America Hyperspectral Imaging Market Analysis, Insights and Forecast, 2019-2031
- 6.1. Market Analysis, Insights and Forecast - by End-user Industry
- 6.1.1. Food and Agriculture
- 6.1.2. Healthcare
- 6.1.3. Defense
- 6.1.4. Mining and Metrology
- 6.1.5. Recycling
- 6.1.6. Other End-user Verticals
- 6.1. Market Analysis, Insights and Forecast - by End-user Industry
- 7. Europe Hyperspectral Imaging Market Analysis, Insights and Forecast, 2019-2031
- 7.1. Market Analysis, Insights and Forecast - by End-user Industry
- 7.1.1. Food and Agriculture
- 7.1.2. Healthcare
- 7.1.3. Defense
- 7.1.4. Mining and Metrology
- 7.1.5. Recycling
- 7.1.6. Other End-user Verticals
- 7.1. Market Analysis, Insights and Forecast - by End-user Industry
- 8. Asia Hyperspectral Imaging Market Analysis, Insights and Forecast, 2019-2031
- 8.1. Market Analysis, Insights and Forecast - by End-user Industry
- 8.1.1. Food and Agriculture
- 8.1.2. Healthcare
- 8.1.3. Defense
- 8.1.4. Mining and Metrology
- 8.1.5. Recycling
- 8.1.6. Other End-user Verticals
- 8.1. Market Analysis, Insights and Forecast - by End-user Industry
- 9. Australia and New Zealand Hyperspectral Imaging Market Analysis, Insights and Forecast, 2019-2031
- 9.1. Market Analysis, Insights and Forecast - by End-user Industry
- 9.1.1. Food and Agriculture
- 9.1.2. Healthcare
- 9.1.3. Defense
- 9.1.4. Mining and Metrology
- 9.1.5. Recycling
- 9.1.6. Other End-user Verticals
- 9.1. Market Analysis, Insights and Forecast - by End-user Industry
- 10. Latin America Hyperspectral Imaging Market Analysis, Insights and Forecast, 2019-2031
- 10.1. Market Analysis, Insights and Forecast - by End-user Industry
- 10.1.1. Food and Agriculture
- 10.1.2. Healthcare
- 10.1.3. Defense
- 10.1.4. Mining and Metrology
- 10.1.5. Recycling
- 10.1.6. Other End-user Verticals
- 10.1. Market Analysis, Insights and Forecast - by End-user Industry
- 11. Middle East and Africa Hyperspectral Imaging Market Analysis, Insights and Forecast, 2019-2031
- 11.1. Market Analysis, Insights and Forecast - by End-user Industry
- 11.1.1. Food and Agriculture
- 11.1.2. Healthcare
- 11.1.3. Defense
- 11.1.4. Mining and Metrology
- 11.1.5. Recycling
- 11.1.6. Other End-user Verticals
- 11.1. Market Analysis, Insights and Forecast - by End-user Industry
- 12. North America Hyperspectral Imaging Market Analysis, Insights and Forecast, 2019-2031
- 12.1. Market Analysis, Insights and Forecast - By Country/Sub-region
- 12.1.1 United States
- 12.1.2 Canada
- 12.1.3 Mexico
- 13. Europe Hyperspectral Imaging Market Analysis, Insights and Forecast, 2019-2031
- 13.1. Market Analysis, Insights and Forecast - By Country/Sub-region
- 13.1.1 Germany
- 13.1.2 United Kingdom
- 13.1.3 France
- 13.1.4 Spain
- 13.1.5 Italy
- 13.1.6 Spain
- 13.1.7 Belgium
- 13.1.8 Netherland
- 13.1.9 Nordics
- 13.1.10 Rest of Europe
- 14. Asia Pacific Hyperspectral Imaging Market Analysis, Insights and Forecast, 2019-2031
- 14.1. Market Analysis, Insights and Forecast - By Country/Sub-region
- 14.1.1 China
- 14.1.2 Japan
- 14.1.3 India
- 14.1.4 South Korea
- 14.1.5 Southeast Asia
- 14.1.6 Australia
- 14.1.7 Indonesia
- 14.1.8 Phillipes
- 14.1.9 Singapore
- 14.1.10 Thailandc
- 14.1.11 Rest of Asia Pacific
- 15. South America Hyperspectral Imaging Market Analysis, Insights and Forecast, 2019-2031
- 15.1. Market Analysis, Insights and Forecast - By Country/Sub-region
- 15.1.1 Brazil
- 15.1.2 Argentina
- 15.1.3 Peru
- 15.1.4 Chile
- 15.1.5 Colombia
- 15.1.6 Ecuador
- 15.1.7 Venezuela
- 15.1.8 Rest of South America
- 16. North America Hyperspectral Imaging Market Analysis, Insights and Forecast, 2019-2031
- 16.1. Market Analysis, Insights and Forecast - By Country/Sub-region
- 16.1.1 United States
- 16.1.2 Canada
- 16.1.3 Mexico
- 17. MEA Hyperspectral Imaging Market Analysis, Insights and Forecast, 2019-2031
- 17.1. Market Analysis, Insights and Forecast - By Country/Sub-region
- 17.1.1 United Arab Emirates
- 17.1.2 Saudi Arabia
- 17.1.3 South Africa
- 17.1.4 Rest of Middle East and Africa
- 18. Competitive Analysis
- 18.1. Global Market Share Analysis 2024
- 18.2. Company Profiles
- 18.2.1 Surface Optics Corporation
- 18.2.1.1. Overview
- 18.2.1.2. Products
- 18.2.1.3. SWOT Analysis
- 18.2.1.4. Recent Developments
- 18.2.1.5. Financials (Based on Availability)
- 18.2.2 HyperMed Imaging Inc
- 18.2.2.1. Overview
- 18.2.2.2. Products
- 18.2.2.3. SWOT Analysis
- 18.2.2.4. Recent Developments
- 18.2.2.5. Financials (Based on Availability)
- 18.2.3 Resonon Inc
- 18.2.3.1. Overview
- 18.2.3.2. Products
- 18.2.3.3. SWOT Analysis
- 18.2.3.4. Recent Developments
- 18.2.3.5. Financials (Based on Availability)
- 18.2.4 Specim Spectral Imaging Ltd
- 18.2.4.1. Overview
- 18.2.4.2. Products
- 18.2.4.3. SWOT Analysis
- 18.2.4.4. Recent Developments
- 18.2.4.5. Financials (Based on Availability)
- 18.2.5 HinaLea Imaging (TruTag Technologies Inc )
- 18.2.5.1. Overview
- 18.2.5.2. Products
- 18.2.5.3. SWOT Analysis
- 18.2.5.4. Recent Developments
- 18.2.5.5. Financials (Based on Availability)
- 18.2.6 Headwall Photonics Inc
- 18.2.6.1. Overview
- 18.2.6.2. Products
- 18.2.6.3. SWOT Analysis
- 18.2.6.4. Recent Developments
- 18.2.6.5. Financials (Based on Availability)
- 18.2.7 Telops Inc
- 18.2.7.1. Overview
- 18.2.7.2. Products
- 18.2.7.3. SWOT Analysis
- 18.2.7.4. Recent Developments
- 18.2.7.5. Financials (Based on Availability)
- 18.2.8 Cubert GmbH
- 18.2.8.1. Overview
- 18.2.8.2. Products
- 18.2.8.3. SWOT Analysis
- 18.2.8.4. Recent Developments
- 18.2.8.5. Financials (Based on Availability)
- 18.2.9 BaySpec Inc
- 18.2.9.1. Overview
- 18.2.9.2. Products
- 18.2.9.3. SWOT Analysis
- 18.2.9.4. Recent Developments
- 18.2.9.5. Financials (Based on Availability)
- 18.2.10 Galileo Group Inc
- 18.2.10.1. Overview
- 18.2.10.2. Products
- 18.2.10.3. SWOT Analysis
- 18.2.10.4. Recent Developments
- 18.2.10.5. Financials (Based on Availability)
- 18.2.11 XIMEA GmbH
- 18.2.11.1. Overview
- 18.2.11.2. Products
- 18.2.11.3. SWOT Analysis
- 18.2.11.4. Recent Developments
- 18.2.11.5. Financials (Based on Availability)
- 18.2.12 Norsk Elektro Optikk AS
- 18.2.12.1. Overview
- 18.2.12.2. Products
- 18.2.12.3. SWOT Analysis
- 18.2.12.4. Recent Developments
- 18.2.12.5. Financials (Based on Availability)
- 18.2.13 Brimrose Corporation of America
- 18.2.13.1. Overview
- 18.2.13.2. Products
- 18.2.13.3. SWOT Analysis
- 18.2.13.4. Recent Developments
- 18.2.13.5. Financials (Based on Availability)
- 18.2.14 Corning Incorporated
- 18.2.14.1. Overview
- 18.2.14.2. Products
- 18.2.14.3. SWOT Analysis
- 18.2.14.4. Recent Developments
- 18.2.14.5. Financials (Based on Availability)
- 18.2.15 ITRES Research Limited
- 18.2.15.1. Overview
- 18.2.15.2. Products
- 18.2.15.3. SWOT Analysis
- 18.2.15.4. Recent Developments
- 18.2.15.5. Financials (Based on Availability)
- 18.2.1 Surface Optics Corporation
List of Figures
- Figure 1: Global Hyperspectral Imaging Market Revenue Breakdown (Million, %) by Region 2024 & 2032
- Figure 2: North America Hyperspectral Imaging Market Revenue (Million), by Country 2024 & 2032
- Figure 3: North America Hyperspectral Imaging Market Revenue Share (%), by Country 2024 & 2032
- Figure 4: Europe Hyperspectral Imaging Market Revenue (Million), by Country 2024 & 2032
- Figure 5: Europe Hyperspectral Imaging Market Revenue Share (%), by Country 2024 & 2032
- Figure 6: Asia Pacific Hyperspectral Imaging Market Revenue (Million), by Country 2024 & 2032
- Figure 7: Asia Pacific Hyperspectral Imaging Market Revenue Share (%), by Country 2024 & 2032
- Figure 8: South America Hyperspectral Imaging Market Revenue (Million), by Country 2024 & 2032
- Figure 9: South America Hyperspectral Imaging Market Revenue Share (%), by Country 2024 & 2032
- Figure 10: North America Hyperspectral Imaging Market Revenue (Million), by Country 2024 & 2032
- Figure 11: North America Hyperspectral Imaging Market Revenue Share (%), by Country 2024 & 2032
- Figure 12: MEA Hyperspectral Imaging Market Revenue (Million), by Country 2024 & 2032
- Figure 13: MEA Hyperspectral Imaging Market Revenue Share (%), by Country 2024 & 2032
- Figure 14: North America Hyperspectral Imaging Market Revenue (Million), by End-user Industry 2024 & 2032
- Figure 15: North America Hyperspectral Imaging Market Revenue Share (%), by End-user Industry 2024 & 2032
- Figure 16: North America Hyperspectral Imaging Market Revenue (Million), by Country 2024 & 2032
- Figure 17: North America Hyperspectral Imaging Market Revenue Share (%), by Country 2024 & 2032
- Figure 18: Europe Hyperspectral Imaging Market Revenue (Million), by End-user Industry 2024 & 2032
- Figure 19: Europe Hyperspectral Imaging Market Revenue Share (%), by End-user Industry 2024 & 2032
- Figure 20: Europe Hyperspectral Imaging Market Revenue (Million), by Country 2024 & 2032
- Figure 21: Europe Hyperspectral Imaging Market Revenue Share (%), by Country 2024 & 2032
- Figure 22: Asia Hyperspectral Imaging Market Revenue (Million), by End-user Industry 2024 & 2032
- Figure 23: Asia Hyperspectral Imaging Market Revenue Share (%), by End-user Industry 2024 & 2032
- Figure 24: Asia Hyperspectral Imaging Market Revenue (Million), by Country 2024 & 2032
- Figure 25: Asia Hyperspectral Imaging Market Revenue Share (%), by Country 2024 & 2032
- Figure 26: Australia and New Zealand Hyperspectral Imaging Market Revenue (Million), by End-user Industry 2024 & 2032
- Figure 27: Australia and New Zealand Hyperspectral Imaging Market Revenue Share (%), by End-user Industry 2024 & 2032
- Figure 28: Australia and New Zealand Hyperspectral Imaging Market Revenue (Million), by Country 2024 & 2032
- Figure 29: Australia and New Zealand Hyperspectral Imaging Market Revenue Share (%), by Country 2024 & 2032
- Figure 30: Latin America Hyperspectral Imaging Market Revenue (Million), by End-user Industry 2024 & 2032
- Figure 31: Latin America Hyperspectral Imaging Market Revenue Share (%), by End-user Industry 2024 & 2032
- Figure 32: Latin America Hyperspectral Imaging Market Revenue (Million), by Country 2024 & 2032
- Figure 33: Latin America Hyperspectral Imaging Market Revenue Share (%), by Country 2024 & 2032
- Figure 34: Middle East and Africa Hyperspectral Imaging Market Revenue (Million), by End-user Industry 2024 & 2032
- Figure 35: Middle East and Africa Hyperspectral Imaging Market Revenue Share (%), by End-user Industry 2024 & 2032
- Figure 36: Middle East and Africa Hyperspectral Imaging Market Revenue (Million), by Country 2024 & 2032
- Figure 37: Middle East and Africa Hyperspectral Imaging Market Revenue Share (%), by Country 2024 & 2032
List of Tables
- Table 1: Global Hyperspectral Imaging Market Revenue Million Forecast, by Region 2019 & 2032
- Table 2: Global Hyperspectral Imaging Market Revenue Million Forecast, by End-user Industry 2019 & 2032
- Table 3: Global Hyperspectral Imaging Market Revenue Million Forecast, by Region 2019 & 2032
- Table 4: Global Hyperspectral Imaging Market Revenue Million Forecast, by Country 2019 & 2032
- Table 5: United States Hyperspectral Imaging Market Revenue (Million) Forecast, by Application 2019 & 2032
- Table 6: Canada Hyperspectral Imaging Market Revenue (Million) Forecast, by Application 2019 & 2032
- Table 7: Mexico Hyperspectral Imaging Market Revenue (Million) Forecast, by Application 2019 & 2032
- Table 8: Global Hyperspectral Imaging Market Revenue Million Forecast, by Country 2019 & 2032
- Table 9: Germany Hyperspectral Imaging Market Revenue (Million) Forecast, by Application 2019 & 2032
- Table 10: United Kingdom Hyperspectral Imaging Market Revenue (Million) Forecast, by Application 2019 & 2032
- Table 11: France Hyperspectral Imaging Market Revenue (Million) Forecast, by Application 2019 & 2032
- Table 12: Spain Hyperspectral Imaging Market Revenue (Million) Forecast, by Application 2019 & 2032
- Table 13: Italy Hyperspectral Imaging Market Revenue (Million) Forecast, by Application 2019 & 2032
- Table 14: Spain Hyperspectral Imaging Market Revenue (Million) Forecast, by Application 2019 & 2032
- Table 15: Belgium Hyperspectral Imaging Market Revenue (Million) Forecast, by Application 2019 & 2032
- Table 16: Netherland Hyperspectral Imaging Market Revenue (Million) Forecast, by Application 2019 & 2032
- Table 17: Nordics Hyperspectral Imaging Market Revenue (Million) Forecast, by Application 2019 & 2032
- Table 18: Rest of Europe Hyperspectral Imaging Market Revenue (Million) Forecast, by Application 2019 & 2032
- Table 19: Global Hyperspectral Imaging Market Revenue Million Forecast, by Country 2019 & 2032
- Table 20: China Hyperspectral Imaging Market Revenue (Million) Forecast, by Application 2019 & 2032
- Table 21: Japan Hyperspectral Imaging Market Revenue (Million) Forecast, by Application 2019 & 2032
- Table 22: India Hyperspectral Imaging Market Revenue (Million) Forecast, by Application 2019 & 2032
- Table 23: South Korea Hyperspectral Imaging Market Revenue (Million) Forecast, by Application 2019 & 2032
- Table 24: Southeast Asia Hyperspectral Imaging Market Revenue (Million) Forecast, by Application 2019 & 2032
- Table 25: Australia Hyperspectral Imaging Market Revenue (Million) Forecast, by Application 2019 & 2032
- Table 26: Indonesia Hyperspectral Imaging Market Revenue (Million) Forecast, by Application 2019 & 2032
- Table 27: Phillipes Hyperspectral Imaging Market Revenue (Million) Forecast, by Application 2019 & 2032
- Table 28: Singapore Hyperspectral Imaging Market Revenue (Million) Forecast, by Application 2019 & 2032
- Table 29: Thailandc Hyperspectral Imaging Market Revenue (Million) Forecast, by Application 2019 & 2032
- Table 30: Rest of Asia Pacific Hyperspectral Imaging Market Revenue (Million) Forecast, by Application 2019 & 2032
- Table 31: Global Hyperspectral Imaging Market Revenue Million Forecast, by Country 2019 & 2032
- Table 32: Brazil Hyperspectral Imaging Market Revenue (Million) Forecast, by Application 2019 & 2032
- Table 33: Argentina Hyperspectral Imaging Market Revenue (Million) Forecast, by Application 2019 & 2032
- Table 34: Peru Hyperspectral Imaging Market Revenue (Million) Forecast, by Application 2019 & 2032
- Table 35: Chile Hyperspectral Imaging Market Revenue (Million) Forecast, by Application 2019 & 2032
- Table 36: Colombia Hyperspectral Imaging Market Revenue (Million) Forecast, by Application 2019 & 2032
- Table 37: Ecuador Hyperspectral Imaging Market Revenue (Million) Forecast, by Application 2019 & 2032
- Table 38: Venezuela Hyperspectral Imaging Market Revenue (Million) Forecast, by Application 2019 & 2032
- Table 39: Rest of South America Hyperspectral Imaging Market Revenue (Million) Forecast, by Application 2019 & 2032
- Table 40: Global Hyperspectral Imaging Market Revenue Million Forecast, by Country 2019 & 2032
- Table 41: United States Hyperspectral Imaging Market Revenue (Million) Forecast, by Application 2019 & 2032
- Table 42: Canada Hyperspectral Imaging Market Revenue (Million) Forecast, by Application 2019 & 2032
- Table 43: Mexico Hyperspectral Imaging Market Revenue (Million) Forecast, by Application 2019 & 2032
- Table 44: Global Hyperspectral Imaging Market Revenue Million Forecast, by Country 2019 & 2032
- Table 45: United Arab Emirates Hyperspectral Imaging Market Revenue (Million) Forecast, by Application 2019 & 2032
- Table 46: Saudi Arabia Hyperspectral Imaging Market Revenue (Million) Forecast, by Application 2019 & 2032
- Table 47: South Africa Hyperspectral Imaging Market Revenue (Million) Forecast, by Application 2019 & 2032
- Table 48: Rest of Middle East and Africa Hyperspectral Imaging Market Revenue (Million) Forecast, by Application 2019 & 2032
- Table 49: Global Hyperspectral Imaging Market Revenue Million Forecast, by End-user Industry 2019 & 2032
- Table 50: Global Hyperspectral Imaging Market Revenue Million Forecast, by Country 2019 & 2032
- Table 51: Global Hyperspectral Imaging Market Revenue Million Forecast, by End-user Industry 2019 & 2032
- Table 52: Global Hyperspectral Imaging Market Revenue Million Forecast, by Country 2019 & 2032
- Table 53: Global Hyperspectral Imaging Market Revenue Million Forecast, by End-user Industry 2019 & 2032
- Table 54: Global Hyperspectral Imaging Market Revenue Million Forecast, by Country 2019 & 2032
- Table 55: Global Hyperspectral Imaging Market Revenue Million Forecast, by End-user Industry 2019 & 2032
- Table 56: Global Hyperspectral Imaging Market Revenue Million Forecast, by Country 2019 & 2032
- Table 57: Global Hyperspectral Imaging Market Revenue Million Forecast, by End-user Industry 2019 & 2032
- Table 58: Global Hyperspectral Imaging Market Revenue Million Forecast, by Country 2019 & 2032
- Table 59: Global Hyperspectral Imaging Market Revenue Million Forecast, by End-user Industry 2019 & 2032
- Table 60: Global Hyperspectral Imaging Market Revenue Million Forecast, by Country 2019 & 2032
Frequently Asked Questions
1. What is the projected Compound Annual Growth Rate (CAGR) of the Hyperspectral Imaging Market?
The projected CAGR is approximately 15.46%.
2. Which companies are prominent players in the Hyperspectral Imaging Market?
Key companies in the market include Surface Optics Corporation, HyperMed Imaging Inc, Resonon Inc, Specim Spectral Imaging Ltd, HinaLea Imaging (TruTag Technologies Inc ), Headwall Photonics Inc, Telops Inc, Cubert GmbH, BaySpec Inc, Galileo Group Inc, XIMEA GmbH, Norsk Elektro Optikk AS, Brimrose Corporation of America, Corning Incorporated, ITRES Research Limited.
3. What are the main segments of the Hyperspectral Imaging Market?
The market segments include End-user Industry.
4. Can you provide details about the market size?
The market size is estimated to be USD 226.08 Million as of 2022.
5. What are some drivers contributing to market growth?
Technological Advancements; Increasing Demand for Data Accuracy and Consistency.
6. What are the notable trends driving market growth?
Healthcare to be the Fastest Growing End User Segment.
7. Are there any restraints impacting market growth?
High Costs Associated with the Use of Hyperspectral Imaging.
8. Can you provide examples of recent developments in the market?
December 2023 - SPECIM recently launched an upgraded FX50 middle wave infrared hyperspectral camera model. The camera covers the full mid-wave infrared spectral range of 2.7 - 5.3 μm and has a 640-pixel spatial resolution, 35 nm spectral resolution, 30 μm adequate pixel size, and a maximum frame rate of 377 fps.
9. What pricing options are available for accessing the report?
Pricing options include single-user, multi-user, and enterprise licenses priced at USD 4750, USD 5250, and USD 8750 respectively.
10. Is the market size provided in terms of value or volume?
The market size is provided in terms of value, measured in Million.
11. Are there any specific market keywords associated with the report?
Yes, the market keyword associated with the report is "Hyperspectral Imaging Market," which aids in identifying and referencing the specific market segment covered.
12. How do I determine which pricing option suits my needs best?
The pricing options vary based on user requirements and access needs. Individual users may opt for single-user licenses, while businesses requiring broader access may choose multi-user or enterprise licenses for cost-effective access to the report.
13. Are there any additional resources or data provided in the Hyperspectral Imaging Market report?
While the report offers comprehensive insights, it's advisable to review the specific contents or supplementary materials provided to ascertain if additional resources or data are available.
14. How can I stay updated on further developments or reports in the Hyperspectral Imaging Market?
To stay informed about further developments, trends, and reports in the Hyperspectral Imaging Market, consider subscribing to industry newsletters, following relevant companies and organizations, or regularly checking reputable industry news sources and publications.
Methodology
Step 1 - Identification of Relevant Samples Size from Population Database


Step 2 - Approaches for Defining Global Market Size (Value, Volume* & Price*)

Note*: In applicable scenarios
Step 3 - Data Sources
Primary Research
- Web Analytics
- Survey Reports
- Research Institute
- Latest Research Reports
- Opinion Leaders
Secondary Research
- Annual Reports
- White Paper
- Latest Press Release
- Industry Association
- Paid Database
- Investor Presentations

Step 4 - Data Triangulation
Involves using different sources of information in order to increase the validity of a study
These sources are likely to be stakeholders in a program - participants, other researchers, program staff, other community members, and so on.
Then we put all data in single framework & apply various statistical tools to find out the dynamic on the market.
During the analysis stage, feedback from the stakeholder groups would be compared to determine areas of agreement as well as areas of divergence
