

Key Insights
The livestock monitoring market is experiencing robust growth, driven by increasing demand for efficient and data-driven farming practices. The rising adoption of precision livestock farming (PLF) techniques, coupled with advancements in sensor technology, IoT connectivity, and data analytics, are key catalysts. Farmers are increasingly recognizing the value of real-time data on animal health, behavior, and productivity to optimize resource allocation, improve animal welfare, and enhance overall farm profitability. This is particularly evident in the dairy sector, where technologies like automated milking systems and activity monitoring sensors are gaining widespread acceptance. While the initial investment in livestock monitoring systems can be significant, the long-term return on investment (ROI) is proving attractive, fueled by reduced labor costs, improved herd management, and increased milk yield or meat production. Furthermore, government initiatives promoting technological adoption in agriculture and the growing awareness of sustainable farming practices are bolstering market expansion.
Despite the significant growth potential, challenges remain. The high cost of implementation and maintenance of sophisticated monitoring systems can be a barrier for smaller farms. Data security and privacy concerns, especially with the increasing reliance on cloud-based platforms, also require careful consideration. Additionally, the need for robust and reliable internet connectivity in rural areas remains a limiting factor in certain regions. Overcoming these challenges requires collaborative efforts involving technology providers, government agencies, and agricultural communities to ensure equitable access and widespread adoption of livestock monitoring technologies. The competitive landscape is marked by both established players like DeLaval and GEA Group, offering comprehensive solutions, and smaller, specialized companies focusing on niche applications. The continued innovation in sensor technology, coupled with the development of user-friendly software and analytics platforms, will shape the future trajectory of the market. We project significant growth in the coming years, with an increasing focus on integration with other farm management systems for holistic data analysis and improved decision-making.
Dynamic Livestock Monitoring Market Report: 2019-2033
This comprehensive report provides an in-depth analysis of the global livestock monitoring market, projecting a market value exceeding $XX million by 2033. The study covers the period 2019-2033, with a base year of 2025 and a forecast period spanning 2025-2033. Leveraging extensive data analysis and industry insights, this report is an indispensable resource for investors, industry professionals, and strategic decision-makers seeking a clear understanding of this rapidly evolving market.
Livestock Monitoring Market Structure & Competitive Landscape
The global livestock monitoring market is characterized by a moderately concentrated landscape, with a few major players holding significant market share. The Herfindahl-Hirschman Index (HHI) is estimated at xx in 2025, indicating a moderately consolidated market. Innovation is a key driver, with companies constantly striving to improve sensor technology, data analytics, and software integration. Regulatory changes concerning animal welfare and data privacy are significantly impacting market dynamics. Product substitutes, such as traditional manual monitoring methods, pose a minor threat, but the increasing efficiency and cost-effectiveness of livestock monitoring solutions are driving market growth.
End-user segmentation is primarily driven by farm size and production type, with large-scale commercial farms accounting for a significant proportion of market demand. Mergers and acquisitions (M&A) activity has been moderate in recent years, with approximately xx M&A deals recorded between 2019 and 2024, mainly focused on consolidating market share and expanding technological capabilities. Key factors influencing market structure include:
- Technological advancements: Improved sensor accuracy, AI-driven analytics, and cloud-based data management are key innovations.
- Regulatory landscape: Varying regulations across different regions impacting data privacy and animal welfare standards.
- Economic factors: Fluctuations in livestock prices and farm profitability affecting investment in monitoring technologies.
- Competitive intensity: The market is witnessing increasing competition, driving innovation and price optimization.
Livestock Monitoring Market Trends & Opportunities
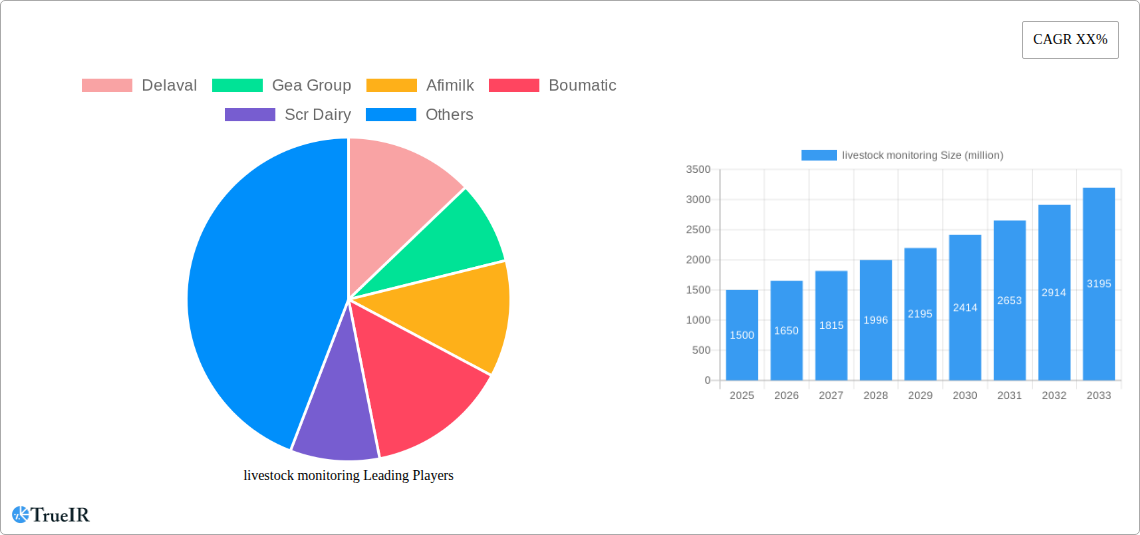
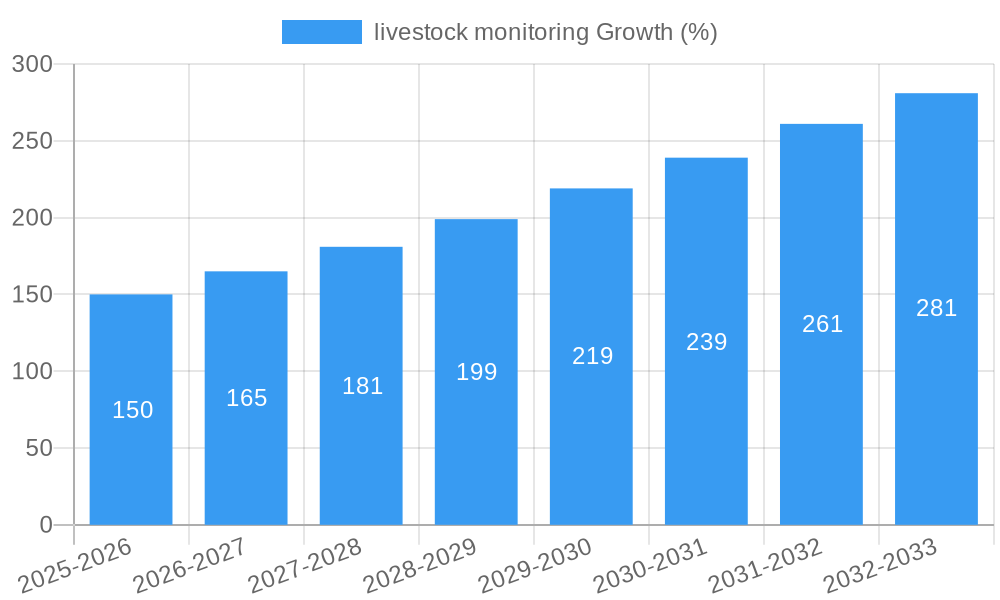
The global livestock monitoring market is experiencing robust growth, with a projected Compound Annual Growth Rate (CAGR) of xx% during the forecast period (2025-2033). The market size is estimated at $XX million in 2025 and is anticipated to reach $XX million by 2033. This growth is fueled by several key factors, including rising consumer demand for high-quality and sustainably produced livestock products, increasing adoption of precision agriculture techniques, and advancements in data analytics. Technological shifts are playing a crucial role, with the integration of IoT devices, cloud computing, and artificial intelligence enhancing monitoring capabilities and providing valuable data-driven insights.
Consumer preferences are shifting towards traceable and ethically sourced livestock products, demanding greater transparency and accountability in farming practices. This is driving the adoption of livestock monitoring systems that provide detailed information on animal health, welfare, and productivity. The competitive dynamics are intensifying, with major players investing heavily in R&D to develop innovative solutions and expand their market reach. Market penetration rates are expected to increase significantly, especially in developing economies, driven by rising incomes and increasing awareness of the benefits of advanced livestock management practices.
Dominant Markets & Segments in Livestock Monitoring
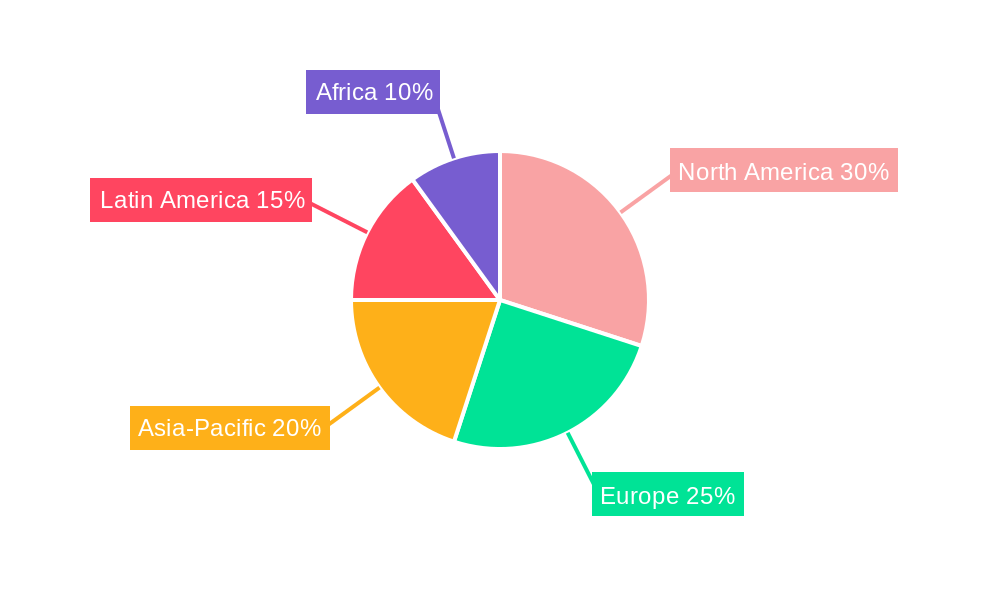
The North American livestock monitoring market currently holds a dominant position, driven by factors such as early adoption of technology, well-established infrastructure, and supportive government policies promoting precision agriculture. However, significant growth opportunities exist in the Asia-Pacific region, particularly in countries with large livestock populations and increasing demand for enhanced efficiency and productivity.
Key Growth Drivers:
- Developed Infrastructure: North America and Europe have well-established agricultural infrastructure, facilitating technology adoption.
- Government Support: Policies promoting precision agriculture and smart farming are boosting market growth.
- High Livestock Density: Regions with high livestock densities drive the need for efficient monitoring systems.
- Increasing Awareness: Growing awareness of animal welfare and sustainable farming practices is increasing adoption.
Market Dominance Analysis:
North America's dominance stems from the early adoption of advanced technologies and supportive regulatory frameworks. The region has a high concentration of technologically advanced farms and a strong research and development ecosystem. However, emerging economies are rapidly catching up, presenting significant expansion opportunities for livestock monitoring companies. The growth in these regions is driven by factors such as rising incomes, government initiatives to enhance agricultural productivity, and increased awareness among farmers about the economic benefits of precision livestock farming.
Livestock Monitoring Product Analysis
The livestock monitoring market encompasses a range of products, including wearable sensors, stationary monitoring systems, data analytics platforms, and management software. Technological advancements are focusing on improving sensor accuracy, extending battery life, and enhancing data analytics capabilities through the use of artificial intelligence and machine learning. Key competitive advantages include the provision of comprehensive data insights, user-friendly interfaces, and seamless integration with existing farm management systems. The market is seeing the rise of cloud-based solutions, enabling real-time data access and facilitating remote monitoring. The market fit is strong due to the increasing need for efficient and data-driven livestock management practices.
Key Drivers, Barriers & Challenges in Livestock Monitoring
Key Drivers:
The market is propelled by the growing need for efficient livestock management, increased demand for high-quality and traceable products, and technological advancements driving automation and data analysis. Government initiatives promoting precision agriculture and favorable regulatory environments also contribute significantly. The need for enhanced animal welfare and improved disease prevention further boosts the market.
Challenges and Restraints:
High initial investment costs, lack of digital literacy among farmers in certain regions, and concerns about data security and privacy pose significant barriers to market penetration. Interoperability issues between different monitoring systems and the complexity of integrating new technologies into existing farming operations also present challenges. Supply chain disruptions can impact the availability of components and increase costs. The impact of these restraints on market growth is estimated at approximately xx% reduction in the overall market size by 2033.
Growth Drivers in the Livestock Monitoring Market
The increasing adoption of precision agriculture techniques and the rising demand for efficient livestock management are key drivers of market growth. Technological advancements in sensor technology, data analytics, and cloud computing are enhancing the capabilities of livestock monitoring systems and providing valuable insights. Government support and favorable regulatory environments in certain regions are further encouraging the adoption of these technologies. Finally, the growing awareness of animal welfare and the need for sustainable farming practices are driving demand for effective livestock monitoring solutions.
Challenges Impacting Livestock Monitoring Growth
High upfront investment costs for farmers, especially smaller farms, represent a significant barrier to market adoption. Concerns around data privacy and security can deter farmers from adopting livestock monitoring solutions. Integration complexities with existing farm management systems and the lack of skilled workforce in some areas also pose challenges. Finally, inconsistent internet connectivity in rural areas can hinder the effectiveness of remote monitoring systems.
Key Players Shaping the Livestock Monitoring Market
- Delaval
- Gea Group
- Afimilk
- Boumatic
- Scr Dairy
- Dairymaster
- Lely Holding
- Sum-It Computer Systems
- Valley Agriculture Software
- Infovet
Significant Livestock Monitoring Industry Milestones
- 2020: Delaval launches its new cloud-based dairy management system.
- 2021: Gea Group acquires a leading precision livestock farming technology company.
- 2022: Afimilk introduces AI-powered analytics for improved disease detection.
- 2023: Significant investments in R&D by key players lead to improved sensor accuracy.
- 2024: New regulations regarding data privacy are introduced in several key markets.
Future Outlook for Livestock Monitoring Market
The livestock monitoring market is poised for continued robust growth, driven by ongoing technological innovations, increasing demand for efficient and sustainable livestock management, and supportive government policies. Strategic opportunities exist for companies to develop innovative solutions addressing specific challenges faced by farmers, such as improved data analytics, seamless integration with existing systems, and enhanced user-friendliness. The market's potential for growth is substantial, especially in developing economies.
livestock monitoring Segmentation
-
1. Application
- 1.1. Milk Harvesting
- 1.2. Feeding Management
- 1.3. Breeding Management
- 1.4. Behaviour Monitoring & Control
-
2. Types
- 2.1. Hardware
- 2.2. Software
- 2.3. Service
livestock monitoring Segmentation By Geography
-
1. North America
- 1.1. United States
- 1.2. Canada
- 1.3. Mexico
-
2. South America
- 2.1. Brazil
- 2.2. Argentina
- 2.3. Rest of South America
-
3. Europe
- 3.1. United Kingdom
- 3.2. Germany
- 3.3. France
- 3.4. Italy
- 3.5. Spain
- 3.6. Russia
- 3.7. Benelux
- 3.8. Nordics
- 3.9. Rest of Europe
-
4. Middle East & Africa
- 4.1. Turkey
- 4.2. Israel
- 4.3. GCC
- 4.4. North Africa
- 4.5. South Africa
- 4.6. Rest of Middle East & Africa
-
5. Asia Pacific
- 5.1. China
- 5.2. India
- 5.3. Japan
- 5.4. South Korea
- 5.5. ASEAN
- 5.6. Oceania
- 5.7. Rest of Asia Pacific
livestock monitoring REPORT HIGHLIGHTS
| Aspects | Details |
|---|---|
| Study Period | 2019-2033 |
| Base Year | 2024 |
| Estimated Year | 2025 |
| Forecast Period | 2025-2033 |
| Historical Period | 2019-2024 |
| Growth Rate | CAGR of XX% from 2019-2033 |
| Segmentation |
|
Table of Contents
- 1. Introduction
- 1.1. Research Scope
- 1.2. Market Segmentation
- 1.3. Research Methodology
- 1.4. Definitions and Assumptions
- 2. Executive Summary
- 2.1. Introduction
- 3. Market Dynamics
- 3.1. Introduction
- 3.2. Market Drivers
- 3.3. Market Restrains
- 3.4. Market Trends
- 4. Market Factor Analysis
- 4.1. Porters Five Forces
- 4.2. Supply/Value Chain
- 4.3. PESTEL analysis
- 4.4. Market Entropy
- 4.5. Patent/Trademark Analysis
- 5. Global livestock monitoring Analysis, Insights and Forecast, 2019-2031
- 5.1. Market Analysis, Insights and Forecast - by Application
- 5.1.1. Milk Harvesting
- 5.1.2. Feeding Management
- 5.1.3. Breeding Management
- 5.1.4. Behaviour Monitoring & Control
- 5.2. Market Analysis, Insights and Forecast - by Types
- 5.2.1. Hardware
- 5.2.2. Software
- 5.2.3. Service
- 5.3. Market Analysis, Insights and Forecast - by Region
- 5.3.1. North America
- 5.3.2. South America
- 5.3.3. Europe
- 5.3.4. Middle East & Africa
- 5.3.5. Asia Pacific
- 5.1. Market Analysis, Insights and Forecast - by Application
- 6. North America livestock monitoring Analysis, Insights and Forecast, 2019-2031
- 6.1. Market Analysis, Insights and Forecast - by Application
- 6.1.1. Milk Harvesting
- 6.1.2. Feeding Management
- 6.1.3. Breeding Management
- 6.1.4. Behaviour Monitoring & Control
- 6.2. Market Analysis, Insights and Forecast - by Types
- 6.2.1. Hardware
- 6.2.2. Software
- 6.2.3. Service
- 6.1. Market Analysis, Insights and Forecast - by Application
- 7. South America livestock monitoring Analysis, Insights and Forecast, 2019-2031
- 7.1. Market Analysis, Insights and Forecast - by Application
- 7.1.1. Milk Harvesting
- 7.1.2. Feeding Management
- 7.1.3. Breeding Management
- 7.1.4. Behaviour Monitoring & Control
- 7.2. Market Analysis, Insights and Forecast - by Types
- 7.2.1. Hardware
- 7.2.2. Software
- 7.2.3. Service
- 7.1. Market Analysis, Insights and Forecast - by Application
- 8. Europe livestock monitoring Analysis, Insights and Forecast, 2019-2031
- 8.1. Market Analysis, Insights and Forecast - by Application
- 8.1.1. Milk Harvesting
- 8.1.2. Feeding Management
- 8.1.3. Breeding Management
- 8.1.4. Behaviour Monitoring & Control
- 8.2. Market Analysis, Insights and Forecast - by Types
- 8.2.1. Hardware
- 8.2.2. Software
- 8.2.3. Service
- 8.1. Market Analysis, Insights and Forecast - by Application
- 9. Middle East & Africa livestock monitoring Analysis, Insights and Forecast, 2019-2031
- 9.1. Market Analysis, Insights and Forecast - by Application
- 9.1.1. Milk Harvesting
- 9.1.2. Feeding Management
- 9.1.3. Breeding Management
- 9.1.4. Behaviour Monitoring & Control
- 9.2. Market Analysis, Insights and Forecast - by Types
- 9.2.1. Hardware
- 9.2.2. Software
- 9.2.3. Service
- 9.1. Market Analysis, Insights and Forecast - by Application
- 10. Asia Pacific livestock monitoring Analysis, Insights and Forecast, 2019-2031
- 10.1. Market Analysis, Insights and Forecast - by Application
- 10.1.1. Milk Harvesting
- 10.1.2. Feeding Management
- 10.1.3. Breeding Management
- 10.1.4. Behaviour Monitoring & Control
- 10.2. Market Analysis, Insights and Forecast - by Types
- 10.2.1. Hardware
- 10.2.2. Software
- 10.2.3. Service
- 10.1. Market Analysis, Insights and Forecast - by Application
- 11. Competitive Analysis
- 11.1. Global Market Share Analysis 2024
- 11.2. Company Profiles
- 11.2.1 Delaval
- 11.2.1.1. Overview
- 11.2.1.2. Products
- 11.2.1.3. SWOT Analysis
- 11.2.1.4. Recent Developments
- 11.2.1.5. Financials (Based on Availability)
- 11.2.2 Gea Group
- 11.2.2.1. Overview
- 11.2.2.2. Products
- 11.2.2.3. SWOT Analysis
- 11.2.2.4. Recent Developments
- 11.2.2.5. Financials (Based on Availability)
- 11.2.3 Afimilk
- 11.2.3.1. Overview
- 11.2.3.2. Products
- 11.2.3.3. SWOT Analysis
- 11.2.3.4. Recent Developments
- 11.2.3.5. Financials (Based on Availability)
- 11.2.4 Boumatic
- 11.2.4.1. Overview
- 11.2.4.2. Products
- 11.2.4.3. SWOT Analysis
- 11.2.4.4. Recent Developments
- 11.2.4.5. Financials (Based on Availability)
- 11.2.5 Scr Dairy
- 11.2.5.1. Overview
- 11.2.5.2. Products
- 11.2.5.3. SWOT Analysis
- 11.2.5.4. Recent Developments
- 11.2.5.5. Financials (Based on Availability)
- 11.2.6 Dairymaster
- 11.2.6.1. Overview
- 11.2.6.2. Products
- 11.2.6.3. SWOT Analysis
- 11.2.6.4. Recent Developments
- 11.2.6.5. Financials (Based on Availability)
- 11.2.7 Lely Holding
- 11.2.7.1. Overview
- 11.2.7.2. Products
- 11.2.7.3. SWOT Analysis
- 11.2.7.4. Recent Developments
- 11.2.7.5. Financials (Based on Availability)
- 11.2.8 Sum-It Computer Systems
- 11.2.8.1. Overview
- 11.2.8.2. Products
- 11.2.8.3. SWOT Analysis
- 11.2.8.4. Recent Developments
- 11.2.8.5. Financials (Based on Availability)
- 11.2.9 Valley Agriculture Software
- 11.2.9.1. Overview
- 11.2.9.2. Products
- 11.2.9.3. SWOT Analysis
- 11.2.9.4. Recent Developments
- 11.2.9.5. Financials (Based on Availability)
- 11.2.10 Infovet
- 11.2.10.1. Overview
- 11.2.10.2. Products
- 11.2.10.3. SWOT Analysis
- 11.2.10.4. Recent Developments
- 11.2.10.5. Financials (Based on Availability)
- 11.2.1 Delaval
List of Figures
- Figure 1: Global livestock monitoring Revenue Breakdown (million, %) by Region 2024 & 2032
- Figure 2: Global livestock monitoring Volume Breakdown (K, %) by Region 2024 & 2032
- Figure 3: North America livestock monitoring Revenue (million), by Application 2024 & 2032
- Figure 4: North America livestock monitoring Volume (K), by Application 2024 & 2032
- Figure 5: North America livestock monitoring Revenue Share (%), by Application 2024 & 2032
- Figure 6: North America livestock monitoring Volume Share (%), by Application 2024 & 2032
- Figure 7: North America livestock monitoring Revenue (million), by Types 2024 & 2032
- Figure 8: North America livestock monitoring Volume (K), by Types 2024 & 2032
- Figure 9: North America livestock monitoring Revenue Share (%), by Types 2024 & 2032
- Figure 10: North America livestock monitoring Volume Share (%), by Types 2024 & 2032
- Figure 11: North America livestock monitoring Revenue (million), by Country 2024 & 2032
- Figure 12: North America livestock monitoring Volume (K), by Country 2024 & 2032
- Figure 13: North America livestock monitoring Revenue Share (%), by Country 2024 & 2032
- Figure 14: North America livestock monitoring Volume Share (%), by Country 2024 & 2032
- Figure 15: South America livestock monitoring Revenue (million), by Application 2024 & 2032
- Figure 16: South America livestock monitoring Volume (K), by Application 2024 & 2032
- Figure 17: South America livestock monitoring Revenue Share (%), by Application 2024 & 2032
- Figure 18: South America livestock monitoring Volume Share (%), by Application 2024 & 2032
- Figure 19: South America livestock monitoring Revenue (million), by Types 2024 & 2032
- Figure 20: South America livestock monitoring Volume (K), by Types 2024 & 2032
- Figure 21: South America livestock monitoring Revenue Share (%), by Types 2024 & 2032
- Figure 22: South America livestock monitoring Volume Share (%), by Types 2024 & 2032
- Figure 23: South America livestock monitoring Revenue (million), by Country 2024 & 2032
- Figure 24: South America livestock monitoring Volume (K), by Country 2024 & 2032
- Figure 25: South America livestock monitoring Revenue Share (%), by Country 2024 & 2032
- Figure 26: South America livestock monitoring Volume Share (%), by Country 2024 & 2032
- Figure 27: Europe livestock monitoring Revenue (million), by Application 2024 & 2032
- Figure 28: Europe livestock monitoring Volume (K), by Application 2024 & 2032
- Figure 29: Europe livestock monitoring Revenue Share (%), by Application 2024 & 2032
- Figure 30: Europe livestock monitoring Volume Share (%), by Application 2024 & 2032
- Figure 31: Europe livestock monitoring Revenue (million), by Types 2024 & 2032
- Figure 32: Europe livestock monitoring Volume (K), by Types 2024 & 2032
- Figure 33: Europe livestock monitoring Revenue Share (%), by Types 2024 & 2032
- Figure 34: Europe livestock monitoring Volume Share (%), by Types 2024 & 2032
- Figure 35: Europe livestock monitoring Revenue (million), by Country 2024 & 2032
- Figure 36: Europe livestock monitoring Volume (K), by Country 2024 & 2032
- Figure 37: Europe livestock monitoring Revenue Share (%), by Country 2024 & 2032
- Figure 38: Europe livestock monitoring Volume Share (%), by Country 2024 & 2032
- Figure 39: Middle East & Africa livestock monitoring Revenue (million), by Application 2024 & 2032
- Figure 40: Middle East & Africa livestock monitoring Volume (K), by Application 2024 & 2032
- Figure 41: Middle East & Africa livestock monitoring Revenue Share (%), by Application 2024 & 2032
- Figure 42: Middle East & Africa livestock monitoring Volume Share (%), by Application 2024 & 2032
- Figure 43: Middle East & Africa livestock monitoring Revenue (million), by Types 2024 & 2032
- Figure 44: Middle East & Africa livestock monitoring Volume (K), by Types 2024 & 2032
- Figure 45: Middle East & Africa livestock monitoring Revenue Share (%), by Types 2024 & 2032
- Figure 46: Middle East & Africa livestock monitoring Volume Share (%), by Types 2024 & 2032
- Figure 47: Middle East & Africa livestock monitoring Revenue (million), by Country 2024 & 2032
- Figure 48: Middle East & Africa livestock monitoring Volume (K), by Country 2024 & 2032
- Figure 49: Middle East & Africa livestock monitoring Revenue Share (%), by Country 2024 & 2032
- Figure 50: Middle East & Africa livestock monitoring Volume Share (%), by Country 2024 & 2032
- Figure 51: Asia Pacific livestock monitoring Revenue (million), by Application 2024 & 2032
- Figure 52: Asia Pacific livestock monitoring Volume (K), by Application 2024 & 2032
- Figure 53: Asia Pacific livestock monitoring Revenue Share (%), by Application 2024 & 2032
- Figure 54: Asia Pacific livestock monitoring Volume Share (%), by Application 2024 & 2032
- Figure 55: Asia Pacific livestock monitoring Revenue (million), by Types 2024 & 2032
- Figure 56: Asia Pacific livestock monitoring Volume (K), by Types 2024 & 2032
- Figure 57: Asia Pacific livestock monitoring Revenue Share (%), by Types 2024 & 2032
- Figure 58: Asia Pacific livestock monitoring Volume Share (%), by Types 2024 & 2032
- Figure 59: Asia Pacific livestock monitoring Revenue (million), by Country 2024 & 2032
- Figure 60: Asia Pacific livestock monitoring Volume (K), by Country 2024 & 2032
- Figure 61: Asia Pacific livestock monitoring Revenue Share (%), by Country 2024 & 2032
- Figure 62: Asia Pacific livestock monitoring Volume Share (%), by Country 2024 & 2032
List of Tables
- Table 1: Global livestock monitoring Revenue million Forecast, by Region 2019 & 2032
- Table 2: Global livestock monitoring Volume K Forecast, by Region 2019 & 2032
- Table 3: Global livestock monitoring Revenue million Forecast, by Application 2019 & 2032
- Table 4: Global livestock monitoring Volume K Forecast, by Application 2019 & 2032
- Table 5: Global livestock monitoring Revenue million Forecast, by Types 2019 & 2032
- Table 6: Global livestock monitoring Volume K Forecast, by Types 2019 & 2032
- Table 7: Global livestock monitoring Revenue million Forecast, by Region 2019 & 2032
- Table 8: Global livestock monitoring Volume K Forecast, by Region 2019 & 2032
- Table 9: Global livestock monitoring Revenue million Forecast, by Application 2019 & 2032
- Table 10: Global livestock monitoring Volume K Forecast, by Application 2019 & 2032
- Table 11: Global livestock monitoring Revenue million Forecast, by Types 2019 & 2032
- Table 12: Global livestock monitoring Volume K Forecast, by Types 2019 & 2032
- Table 13: Global livestock monitoring Revenue million Forecast, by Country 2019 & 2032
- Table 14: Global livestock monitoring Volume K Forecast, by Country 2019 & 2032
- Table 15: United States livestock monitoring Revenue (million) Forecast, by Application 2019 & 2032
- Table 16: United States livestock monitoring Volume (K) Forecast, by Application 2019 & 2032
- Table 17: Canada livestock monitoring Revenue (million) Forecast, by Application 2019 & 2032
- Table 18: Canada livestock monitoring Volume (K) Forecast, by Application 2019 & 2032
- Table 19: Mexico livestock monitoring Revenue (million) Forecast, by Application 2019 & 2032
- Table 20: Mexico livestock monitoring Volume (K) Forecast, by Application 2019 & 2032
- Table 21: Global livestock monitoring Revenue million Forecast, by Application 2019 & 2032
- Table 22: Global livestock monitoring Volume K Forecast, by Application 2019 & 2032
- Table 23: Global livestock monitoring Revenue million Forecast, by Types 2019 & 2032
- Table 24: Global livestock monitoring Volume K Forecast, by Types 2019 & 2032
- Table 25: Global livestock monitoring Revenue million Forecast, by Country 2019 & 2032
- Table 26: Global livestock monitoring Volume K Forecast, by Country 2019 & 2032
- Table 27: Brazil livestock monitoring Revenue (million) Forecast, by Application 2019 & 2032
- Table 28: Brazil livestock monitoring Volume (K) Forecast, by Application 2019 & 2032
- Table 29: Argentina livestock monitoring Revenue (million) Forecast, by Application 2019 & 2032
- Table 30: Argentina livestock monitoring Volume (K) Forecast, by Application 2019 & 2032
- Table 31: Rest of South America livestock monitoring Revenue (million) Forecast, by Application 2019 & 2032
- Table 32: Rest of South America livestock monitoring Volume (K) Forecast, by Application 2019 & 2032
- Table 33: Global livestock monitoring Revenue million Forecast, by Application 2019 & 2032
- Table 34: Global livestock monitoring Volume K Forecast, by Application 2019 & 2032
- Table 35: Global livestock monitoring Revenue million Forecast, by Types 2019 & 2032
- Table 36: Global livestock monitoring Volume K Forecast, by Types 2019 & 2032
- Table 37: Global livestock monitoring Revenue million Forecast, by Country 2019 & 2032
- Table 38: Global livestock monitoring Volume K Forecast, by Country 2019 & 2032
- Table 39: United Kingdom livestock monitoring Revenue (million) Forecast, by Application 2019 & 2032
- Table 40: United Kingdom livestock monitoring Volume (K) Forecast, by Application 2019 & 2032
- Table 41: Germany livestock monitoring Revenue (million) Forecast, by Application 2019 & 2032
- Table 42: Germany livestock monitoring Volume (K) Forecast, by Application 2019 & 2032
- Table 43: France livestock monitoring Revenue (million) Forecast, by Application 2019 & 2032
- Table 44: France livestock monitoring Volume (K) Forecast, by Application 2019 & 2032
- Table 45: Italy livestock monitoring Revenue (million) Forecast, by Application 2019 & 2032
- Table 46: Italy livestock monitoring Volume (K) Forecast, by Application 2019 & 2032
- Table 47: Spain livestock monitoring Revenue (million) Forecast, by Application 2019 & 2032
- Table 48: Spain livestock monitoring Volume (K) Forecast, by Application 2019 & 2032
- Table 49: Russia livestock monitoring Revenue (million) Forecast, by Application 2019 & 2032
- Table 50: Russia livestock monitoring Volume (K) Forecast, by Application 2019 & 2032
- Table 51: Benelux livestock monitoring Revenue (million) Forecast, by Application 2019 & 2032
- Table 52: Benelux livestock monitoring Volume (K) Forecast, by Application 2019 & 2032
- Table 53: Nordics livestock monitoring Revenue (million) Forecast, by Application 2019 & 2032
- Table 54: Nordics livestock monitoring Volume (K) Forecast, by Application 2019 & 2032
- Table 55: Rest of Europe livestock monitoring Revenue (million) Forecast, by Application 2019 & 2032
- Table 56: Rest of Europe livestock monitoring Volume (K) Forecast, by Application 2019 & 2032
- Table 57: Global livestock monitoring Revenue million Forecast, by Application 2019 & 2032
- Table 58: Global livestock monitoring Volume K Forecast, by Application 2019 & 2032
- Table 59: Global livestock monitoring Revenue million Forecast, by Types 2019 & 2032
- Table 60: Global livestock monitoring Volume K Forecast, by Types 2019 & 2032
- Table 61: Global livestock monitoring Revenue million Forecast, by Country 2019 & 2032
- Table 62: Global livestock monitoring Volume K Forecast, by Country 2019 & 2032
- Table 63: Turkey livestock monitoring Revenue (million) Forecast, by Application 2019 & 2032
- Table 64: Turkey livestock monitoring Volume (K) Forecast, by Application 2019 & 2032
- Table 65: Israel livestock monitoring Revenue (million) Forecast, by Application 2019 & 2032
- Table 66: Israel livestock monitoring Volume (K) Forecast, by Application 2019 & 2032
- Table 67: GCC livestock monitoring Revenue (million) Forecast, by Application 2019 & 2032
- Table 68: GCC livestock monitoring Volume (K) Forecast, by Application 2019 & 2032
- Table 69: North Africa livestock monitoring Revenue (million) Forecast, by Application 2019 & 2032
- Table 70: North Africa livestock monitoring Volume (K) Forecast, by Application 2019 & 2032
- Table 71: South Africa livestock monitoring Revenue (million) Forecast, by Application 2019 & 2032
- Table 72: South Africa livestock monitoring Volume (K) Forecast, by Application 2019 & 2032
- Table 73: Rest of Middle East & Africa livestock monitoring Revenue (million) Forecast, by Application 2019 & 2032
- Table 74: Rest of Middle East & Africa livestock monitoring Volume (K) Forecast, by Application 2019 & 2032
- Table 75: Global livestock monitoring Revenue million Forecast, by Application 2019 & 2032
- Table 76: Global livestock monitoring Volume K Forecast, by Application 2019 & 2032
- Table 77: Global livestock monitoring Revenue million Forecast, by Types 2019 & 2032
- Table 78: Global livestock monitoring Volume K Forecast, by Types 2019 & 2032
- Table 79: Global livestock monitoring Revenue million Forecast, by Country 2019 & 2032
- Table 80: Global livestock monitoring Volume K Forecast, by Country 2019 & 2032
- Table 81: China livestock monitoring Revenue (million) Forecast, by Application 2019 & 2032
- Table 82: China livestock monitoring Volume (K) Forecast, by Application 2019 & 2032
- Table 83: India livestock monitoring Revenue (million) Forecast, by Application 2019 & 2032
- Table 84: India livestock monitoring Volume (K) Forecast, by Application 2019 & 2032
- Table 85: Japan livestock monitoring Revenue (million) Forecast, by Application 2019 & 2032
- Table 86: Japan livestock monitoring Volume (K) Forecast, by Application 2019 & 2032
- Table 87: South Korea livestock monitoring Revenue (million) Forecast, by Application 2019 & 2032
- Table 88: South Korea livestock monitoring Volume (K) Forecast, by Application 2019 & 2032
- Table 89: ASEAN livestock monitoring Revenue (million) Forecast, by Application 2019 & 2032
- Table 90: ASEAN livestock monitoring Volume (K) Forecast, by Application 2019 & 2032
- Table 91: Oceania livestock monitoring Revenue (million) Forecast, by Application 2019 & 2032
- Table 92: Oceania livestock monitoring Volume (K) Forecast, by Application 2019 & 2032
- Table 93: Rest of Asia Pacific livestock monitoring Revenue (million) Forecast, by Application 2019 & 2032
- Table 94: Rest of Asia Pacific livestock monitoring Volume (K) Forecast, by Application 2019 & 2032
Frequently Asked Questions
1. What is the projected Compound Annual Growth Rate (CAGR) of the livestock monitoring?
The projected CAGR is approximately XX%.
2. Which companies are prominent players in the livestock monitoring?
Key companies in the market include Delaval, Gea Group, Afimilk, Boumatic, Scr Dairy, Dairymaster, Lely Holding, Sum-It Computer Systems, Valley Agriculture Software, Infovet.
3. What are the main segments of the livestock monitoring?
The market segments include Application, Types.
4. Can you provide details about the market size?
The market size is estimated to be USD XXX million as of 2022.
5. What are some drivers contributing to market growth?
N/A
6. What are the notable trends driving market growth?
N/A
7. Are there any restraints impacting market growth?
N/A
8. Can you provide examples of recent developments in the market?
N/A
9. What pricing options are available for accessing the report?
Pricing options include single-user, multi-user, and enterprise licenses priced at USD 4350.00, USD 6525.00, and USD 8700.00 respectively.
10. Is the market size provided in terms of value or volume?
The market size is provided in terms of value, measured in million and volume, measured in K.
11. Are there any specific market keywords associated with the report?
Yes, the market keyword associated with the report is "livestock monitoring," which aids in identifying and referencing the specific market segment covered.
12. How do I determine which pricing option suits my needs best?
The pricing options vary based on user requirements and access needs. Individual users may opt for single-user licenses, while businesses requiring broader access may choose multi-user or enterprise licenses for cost-effective access to the report.
13. Are there any additional resources or data provided in the livestock monitoring report?
While the report offers comprehensive insights, it's advisable to review the specific contents or supplementary materials provided to ascertain if additional resources or data are available.
14. How can I stay updated on further developments or reports in the livestock monitoring?
To stay informed about further developments, trends, and reports in the livestock monitoring, consider subscribing to industry newsletters, following relevant companies and organizations, or regularly checking reputable industry news sources and publications.
Methodology
Step 1 - Identification of Relevant Samples Size from Population Database


Step 2 - Approaches for Defining Global Market Size (Value, Volume* & Price*)

Note*: In applicable scenarios
Step 3 - Data Sources
Primary Research
- Web Analytics
- Survey Reports
- Research Institute
- Latest Research Reports
- Opinion Leaders
Secondary Research
- Annual Reports
- White Paper
- Latest Press Release
- Industry Association
- Paid Database
- Investor Presentations

Step 4 - Data Triangulation
Involves using different sources of information in order to increase the validity of a study
These sources are likely to be stakeholders in a program - participants, other researchers, program staff, other community members, and so on.
Then we put all data in single framework & apply various statistical tools to find out the dynamic on the market.
During the analysis stage, feedback from the stakeholder groups would be compared to determine areas of agreement as well as areas of divergence
