

Key Insights
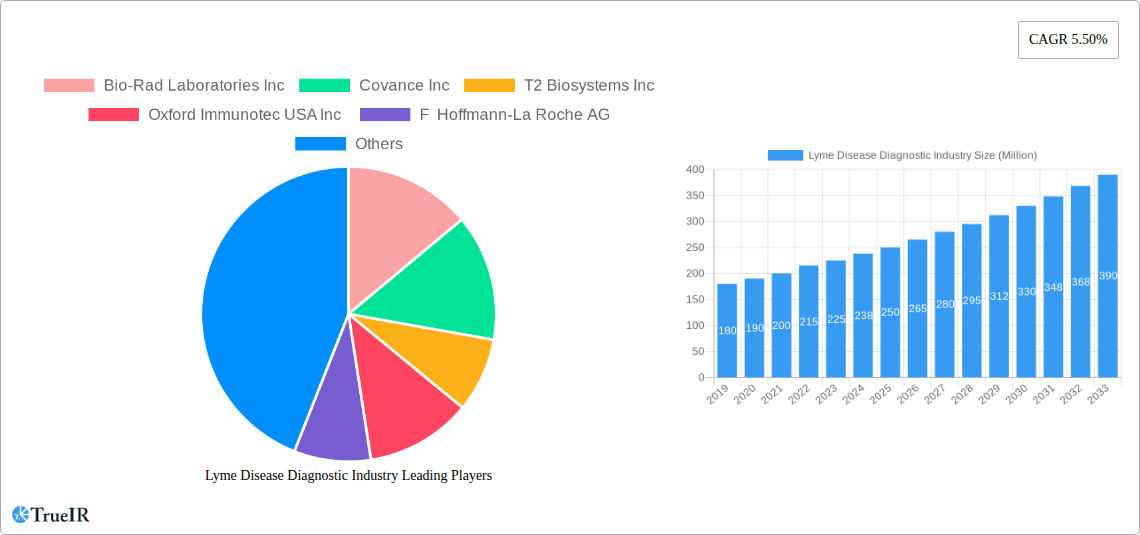
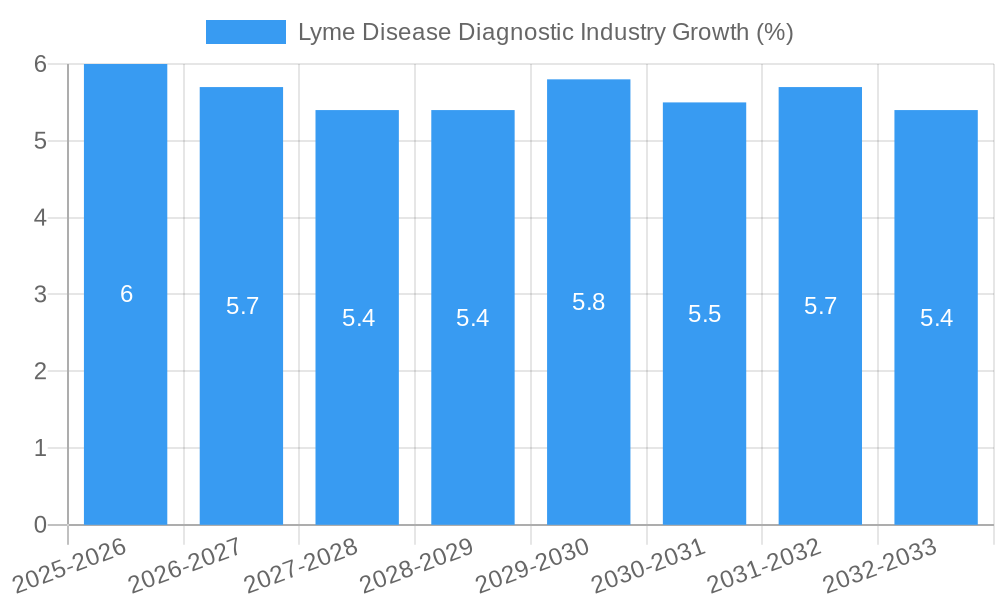
The global Lyme Disease Diagnostic Industry is poised for significant expansion, projected to reach approximately $250 million by 2025, driven by an estimated Compound Annual Growth Rate (CAGR) of 5.50% through 2033. This robust growth is primarily fueled by an increasing incidence of Lyme disease, attributed to factors such as climate change expanding tick habitats, increased outdoor recreational activities, and enhanced awareness among healthcare professionals and the public. The demand for accurate and timely diagnosis is paramount, as early detection significantly improves treatment outcomes and reduces the risk of long-term complications. Technological advancements in diagnostic methodologies are playing a crucial role, with a strong emphasis on developing more sensitive and specific tests that can differentiate between active infection and past exposure, as well as identify co-infections. The growing burden of tick-borne illnesses globally underscores the critical need for improved diagnostic tools, further propelling market growth.
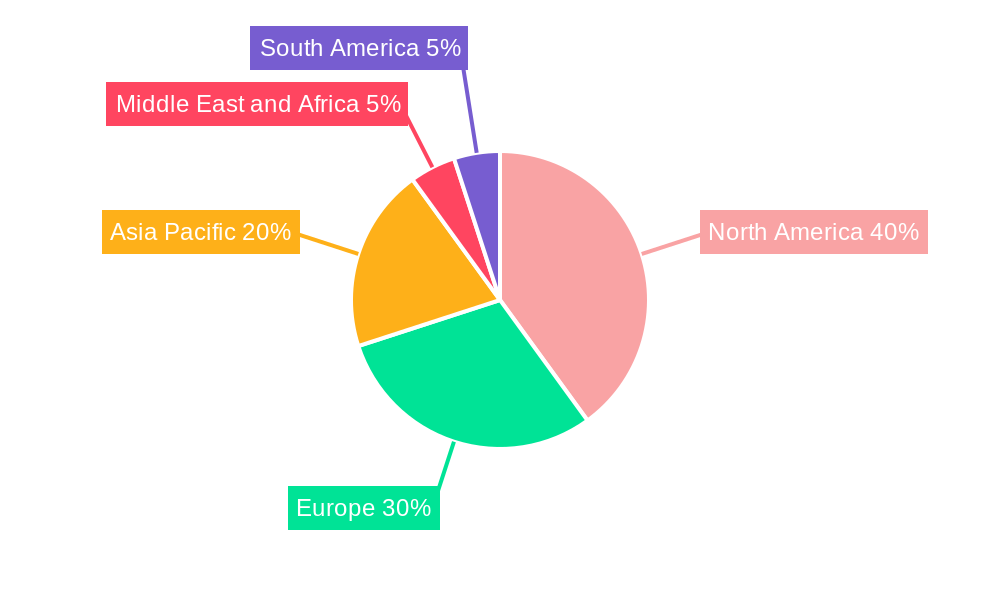
The market landscape is characterized by a diverse range of diagnostic technologies, with Nucleic Acid Tests (NATs) and advanced Serological Tests like ELISA and Western Blot leading the segment due to their increasing accuracy and reliability. Immunofluorescent Staining and Urine Antigen Testing are also gaining traction. End-users, predominantly Hospitals and Clinical Laboratories, are investing in these advanced diagnostic platforms to provide comprehensive patient care. Geographically, North America, particularly the United States, is a leading market owing to high Lyme disease prevalence and substantial investment in R&D and healthcare infrastructure. Europe also represents a significant market, with countries like Germany and the United Kingdom reporting substantial cases. The Asia Pacific region is anticipated to witness the fastest growth, driven by increasing awareness, improving healthcare access, and a rising incidence of tick-borne diseases. Key players like F Hoffmann-La Roche AG, Abbott, and Bio-Rad Laboratories Inc. are actively engaged in innovation and strategic partnerships to capture market share, further shaping the competitive dynamics of this vital industry.
Lyme Disease Diagnostic Industry Report: Unlocking Market Potential & Navigating Challenges (2025-2033)
This comprehensive report provides an in-depth analysis of the global Lyme disease diagnostic industry, a critical sector experiencing significant growth driven by increasing awareness, evolving diagnostic technologies, and unmet patient needs. Spanning the study period from 2019 to 2033, with a base and estimated year of 2025, this report offers actionable insights for stakeholders, including diagnostic manufacturers, healthcare providers, researchers, and investors. We delve into market structure, competitive landscape, emerging trends, dominant segments, product innovations, key growth drivers, significant challenges, and the pivotal roles of leading companies shaping the future of Lyme disease diagnosis.
Lyme Disease Diagnostic Industry Market Structure & Competitive Landscape
The Lyme disease diagnostic industry exhibits a moderately concentrated market structure, characterized by a blend of established global players and emerging innovators. Key innovation drivers include the continuous development of more accurate, faster, and less invasive diagnostic tests, alongside a growing demand for early and precise detection of Borrelia burgdorferi and other tick-borne pathogens. Regulatory impacts, particularly from agencies like the USFDA and EMA, play a crucial role in dictating market access and product approval pathways, influencing the pace of innovation and market entry. The threat of product substitutes, primarily advancements in other infectious disease diagnostics that might offer overlapping detection capabilities, is a factor, though Lyme disease's unique etiology demands specialized approaches. End-user segmentation, with hospitals and clinical laboratories forming the primary demand centers, dictates strategic sales and marketing efforts. Mergers and acquisitions (M&A) trends are observed as companies seek to expand their diagnostic portfolios, acquire novel technologies, and gain market share, contributing to market consolidation. For instance, an estimated 15-20 M&A activities have been recorded within the broader infectious disease diagnostic space annually over the historical period, with a projected increase of 10-15% in the forecast period. Concentration ratios, based on the top 5 market players' revenue share, stand at approximately 60-65% in the base year, with a projected slight decrease to 55-60% by 2033 due to the emergence of new players.
Lyme Disease Diagnostic Industry Market Trends & Opportunities
The Lyme disease diagnostic market is poised for substantial expansion, projected to reach an estimated market size of over 2,500 Million by the end of the forecast period. This growth is underpinned by a compound annual growth rate (CAGR) of approximately 9-11% during the forecast period (2025–2033). Several key trends are shaping this trajectory. Technological shifts are paramount, with a pronounced move away from traditional, often time-consuming, serological tests towards more rapid and direct detection methods. Nucleic acid testing (NAT) and advanced immunoassay techniques are gaining traction due to their superior sensitivity and specificity, particularly in early-stage Lyme disease detection. Consumer preferences are increasingly leaning towards patient-centric diagnostics, emphasizing ease of use, minimal invasiveness, and quicker turnaround times. This is driving innovation in point-of-care diagnostics and home-based testing solutions. Competitive dynamics are intensifying as companies vie for dominance through technological innovation, strategic partnerships, and global market penetration. Opportunities abound in developing diagnostics for co-infections, expanding diagnostic capabilities in underserved regions with high tick-borne disease prevalence, and creating integrated diagnostic platforms that can screen for multiple tick-borne illnesses simultaneously. The increasing prevalence of Lyme disease, linked to climate change and expanding tick habitats, further fuels market demand. Furthermore, the growing emphasis on proactive healthcare and early intervention strategies is creating a fertile ground for diagnostic solutions that can identify the disease at its earliest, most treatable stages, leading to improved patient outcomes and reduced long-term healthcare burdens. The market penetration rate of advanced diagnostic technologies is expected to surge from an estimated 40% in 2025 to over 65% by 2033.
Dominant Markets & Segments in Lyme Disease Diagnostic Industry
The Lyme disease diagnostic industry's dominance is multifaceted, with specific regions and diagnostic technologies leading the charge.
Geographic Dominance: North America, particularly the United States, and Europe are the leading markets for Lyme disease diagnostics. This dominance is attributed to:
- High Prevalence: These regions report a significant incidence of Lyme disease due to favorable ecological conditions for tick populations and higher reporting rates.
- Advanced Healthcare Infrastructure: Well-established healthcare systems and a high density of hospitals and clinical laboratories facilitate the adoption of advanced diagnostic technologies.
- Governmental & Research Initiatives: Substantial funding for research and public health campaigns aimed at raising awareness and improving diagnosis contributes to market growth.
- Regulatory Support: Favorable regulatory environments often accelerate the approval and adoption of new diagnostic tools. The global market is projected to exceed 1,500 Million in North America by 2033, with Europe following closely at over 800 Million.
Dominant Diagnostic Technology Segments:
- Serological Tests (ELISA, Western Blot): While historically dominant, these remain crucial for their established presence and cost-effectiveness, particularly for confirming later-stage infections. Their market share is projected to gradually decrease from approximately 45% in 2025 to 30% by 2033 as newer technologies gain prominence.
- Nucleic Acid Test (NAT): This segment is experiencing the most rapid growth due to its high specificity and ability to detect the pathogen directly. NAT is expected to command over 35% of the market share by 2033, driven by its utility in early diagnosis.
- Lymphocytic Transformation Test (LTT): This test, which assesses immune cell response to Lyme antigens, is gaining traction for its potential to diagnose early and chronic Lyme disease where serological tests may be negative. Its market share is expected to grow from approximately 10% in 2025 to 20% by 2033.
- Urine Antigen Testing and Immunofluorescent Staining: These segments hold a smaller but growing market share, offering specific applications and contributing to a more comprehensive diagnostic approach. Their combined market share is projected to reach 15% by 2033.
Dominant End-User Segment:
- Hospitals: These institutions represent a significant end-user segment, driven by their capacity for patient volume, integrated healthcare services, and access to advanced laboratory facilities.
- Clinical Laboratories: Independent and reference laboratories play a pivotal role in providing specialized diagnostic services and are key adopters of innovative technologies. Their market share is projected to remain robust, exceeding 50% of the overall market throughout the forecast period.
Lyme Disease Diagnostic Industry Product Analysis
Product innovation in the Lyme disease diagnostic industry is focused on enhancing accuracy, speed, and accessibility. Key advancements include multiplex assays capable of detecting multiple tick-borne pathogens simultaneously, improving the diagnostic yield for patients with complex presentations. The development of highly sensitive Nucleic Acid Tests (NAT) directly identifies bacterial DNA from blood or other bodily fluids, offering earlier and more definitive diagnoses than traditional antibody-based methods. Innovations in immunoassay platforms are leading to faster ELISA and Western Blot tests with improved specificity, reducing false positives. Furthermore, efforts are underway to develop point-of-care diagnostics that can provide rapid results in clinician offices or remote settings, streamlining patient management and treatment initiation. These product developments directly address the critical need for early and precise Lyme disease diagnosis, thereby improving patient outcomes and reducing the burden of chronic illness.
Key Drivers, Barriers & Challenges in Lyme Disease Diagnostic Industry
Key Drivers: The Lyme disease diagnostic industry is propelled by several critical factors:
- Rising Global Incidence: Increasing prevalence of Lyme disease, linked to climate change and expanding tick habitats, drives demand for accurate diagnostic tools.
- Technological Advancements: Development of sensitive and specific diagnostic technologies like NAT and advanced serological assays enables earlier and more reliable detection.
- Increased Awareness: Growing public and healthcare professional awareness regarding the severity and long-term consequences of untreated Lyme disease encourages proactive diagnosis.
- Governmental & Research Support: Significant investment in research and public health initiatives focused on tick-borne diseases fuels innovation and market growth.
Barriers & Challenges: Despite robust growth, the industry faces significant hurdles:
- Diagnostic Complexity: Early-stage Lyme disease can present with non-specific symptoms, making accurate diagnosis challenging, particularly with traditional methods.
- Regulatory Hurdles: Obtaining regulatory approval for new diagnostic tests can be a lengthy and expensive process, delaying market entry.
- Reimbursement Issues: Inconsistent and inadequate reimbursement policies for certain advanced diagnostic tests can impact their adoption by healthcare providers.
- Limited Standardization: Variability in testing protocols and interpretation across different laboratories can lead to diagnostic discrepancies.
- Supply Chain Vulnerabilities: Reliance on specific raw materials and reagents can create supply chain risks, as exemplified by recent global disruptions that impacted reagent availability for certain assays.
Growth Drivers in the Lyme Disease Diagnostic Industry Market
The Lyme disease diagnostic market's expansion is primarily fueled by the escalating global prevalence of the disease, directly linked to changing environmental conditions and expanding tick populations in endemic areas. Technological innovation plays a pivotal role, with continuous advancements in Nucleic Acid Testing (NAT) and multiplex assays offering unprecedented accuracy and speed in pathogen detection, enabling earlier diagnosis. Furthermore, heightened awareness among both the general public and healthcare professionals about the debilitating long-term effects of untreated Lyme disease is a significant catalyst, driving demand for reliable diagnostic solutions. Governmental and private research institutions are actively investing in understanding tick-borne diseases, fostering the development of novel diagnostic strategies. These drivers collectively create a robust environment for market growth.
Challenges Impacting Lyme Disease Diagnostic Industry Growth
The Lyme disease diagnostic industry grapples with several significant challenges that could impede its growth trajectory. The inherent complexity of early-stage Lyme disease symptoms, which often mimic other common illnesses, complicates accurate and timely diagnosis, particularly with traditional serological methods. Navigating the stringent and often lengthy regulatory approval processes for novel diagnostic technologies presents a substantial barrier to market entry. Furthermore, inconsistent reimbursement policies from insurance providers for certain advanced diagnostic tests can limit their widespread adoption by healthcare facilities. Supply chain vulnerabilities, including the availability of critical reagents and components, pose a persistent risk, as demonstrated by past global disruptions that impacted manufacturing and distribution. Finally, the ongoing need for improved diagnostic accuracy and reduced false positive/negative rates continues to be a critical area for development.
Key Players Shaping the Lyme Disease Diagnostic Industry Market
- Bio-Rad Laboratories Inc
- Covance Inc
- T2 Biosystems Inc
- Oxford Immunotec USA Inc
- F Hoffmann-La Roche AG
- Abbott
Significant Lyme Disease Diagnostic Industry Industry Milestones
- July 2022: T2 Biosystems' T2Lyme Panel received clearance from the United States Food and Drug Administration (USFDA). This development significantly enhances the accuracy of early Lyme disease diagnosis by directly identifying the bacteria from a patient's blood.
- April 2022: Valneva and Pfizer announced positive Phase 2 data for their Lyme disease vaccine candidate, VLA15. The companies planned to proceed with a three-dose primary vaccination series in a Phase 3 clinical trial, targeting adults and pediatric subjects aged 5 and above, subject to regulatory approval.
Future Outlook for Lyme Disease Diagnostic Industry Market
The future outlook for the Lyme disease diagnostic industry is exceptionally promising, driven by persistent market catalysts and strategic opportunities. The increasing incidence of Lyme disease globally, coupled with ongoing advancements in diagnostic technologies, particularly in direct pathogen detection and multiplex testing, will continue to fuel demand. Investments in research and development are expected to yield more rapid, sensitive, and specific diagnostic solutions, including point-of-care and home-based testing options. Furthermore, the growing emphasis on personalized medicine and early intervention strategies will create a sustained market for accurate diagnostic tools. Strategic collaborations between diagnostic manufacturers, research institutions, and healthcare providers will be crucial for market expansion, particularly in underserved regions. The anticipated development of effective Lyme disease vaccines will also indirectly stimulate diagnostic demand as vaccination campaigns often involve screening and monitoring protocols. The market is projected to witness sustained growth and innovation, with a strong focus on improving patient outcomes through early and precise diagnosis.
Lyme Disease Diagnostic Industry Segmentation
-
1. Diagnostic Technology
-
1.1. Serological Test
- 1.1.1. ELISA
- 1.1.2. Western Blot
- 1.2. Lymphocytic Transformation Test
- 1.3. Urine Antigen Testing
- 1.4. Immunofluorescent Staining
- 1.5. Nucleic acid Test
-
1.1. Serological Test
-
2. End User
- 2.1. Hospitals
-
2.2. Clinical Laboratories
- 2.2.1. Other End-Users
Lyme Disease Diagnostic Industry Segmentation By Geography
-
1. North America
- 1.1. United States
- 1.2. Canada
- 1.3. Mexico
-
2. Europe
- 2.1. Germany
- 2.2. United Kingdom
- 2.3. France
- 2.4. Italy
- 2.5. Spain
- 2.6. Rest of Europe
-
3. Asia Pacific
- 3.1. China
- 3.2. Japan
- 3.3. India
- 3.4. Australia
- 3.5. South Korea
- 3.6. Rest of Asia Pacific
-
4. Middle East and Africa
- 4.1. GCC
- 4.2. South Africa
- 4.3. Rest of Middle East and Africa
-
5. South America
- 5.1. Brazil
- 5.2. Argentina
- 5.3. Rest of South America
Lyme Disease Diagnostic Industry REPORT HIGHLIGHTS
| Aspects | Details |
|---|---|
| Study Period | 2019-2033 |
| Base Year | 2024 |
| Estimated Year | 2025 |
| Forecast Period | 2025-2033 |
| Historical Period | 2019-2024 |
| Growth Rate | CAGR of 5.50% from 2019-2033 |
| Segmentation |
|
Table of Contents
- 1. Introduction
- 1.1. Research Scope
- 1.2. Market Segmentation
- 1.3. Research Methodology
- 1.4. Definitions and Assumptions
- 2. Executive Summary
- 2.1. Introduction
- 3. Market Dynamics
- 3.1. Introduction
- 3.2. Market Drivers
- 3.2.1. Rise in Prevalence of Lyme Disease; Favorable Government Towards Healthcare Facilities; Emergence of New Lyme Diagnostic Tests
- 3.3. Market Restrains
- 3.3.1. Lack of Awareness Regarding the Disease
- 3.4. Market Trends
- 3.4.1. Serological Test Segment to Witness Significant Growth Over the Forecast Period in the Lyme Disease Diagnostic Market.
- 4. Market Factor Analysis
- 4.1. Porters Five Forces
- 4.2. Supply/Value Chain
- 4.3. PESTEL analysis
- 4.4. Market Entropy
- 4.5. Patent/Trademark Analysis
- 5. Global Lyme Disease Diagnostic Industry Analysis, Insights and Forecast, 2019-2031
- 5.1. Market Analysis, Insights and Forecast - by Diagnostic Technology
- 5.1.1. Serological Test
- 5.1.1.1. ELISA
- 5.1.1.2. Western Blot
- 5.1.2. Lymphocytic Transformation Test
- 5.1.3. Urine Antigen Testing
- 5.1.4. Immunofluorescent Staining
- 5.1.5. Nucleic acid Test
- 5.1.1. Serological Test
- 5.2. Market Analysis, Insights and Forecast - by End User
- 5.2.1. Hospitals
- 5.2.2. Clinical Laboratories
- 5.2.2.1. Other End-Users
- 5.3. Market Analysis, Insights and Forecast - by Region
- 5.3.1. North America
- 5.3.2. Europe
- 5.3.3. Asia Pacific
- 5.3.4. Middle East and Africa
- 5.3.5. South America
- 5.1. Market Analysis, Insights and Forecast - by Diagnostic Technology
- 6. North America Lyme Disease Diagnostic Industry Analysis, Insights and Forecast, 2019-2031
- 6.1. Market Analysis, Insights and Forecast - by Diagnostic Technology
- 6.1.1. Serological Test
- 6.1.1.1. ELISA
- 6.1.1.2. Western Blot
- 6.1.2. Lymphocytic Transformation Test
- 6.1.3. Urine Antigen Testing
- 6.1.4. Immunofluorescent Staining
- 6.1.5. Nucleic acid Test
- 6.1.1. Serological Test
- 6.2. Market Analysis, Insights and Forecast - by End User
- 6.2.1. Hospitals
- 6.2.2. Clinical Laboratories
- 6.2.2.1. Other End-Users
- 6.1. Market Analysis, Insights and Forecast - by Diagnostic Technology
- 7. Europe Lyme Disease Diagnostic Industry Analysis, Insights and Forecast, 2019-2031
- 7.1. Market Analysis, Insights and Forecast - by Diagnostic Technology
- 7.1.1. Serological Test
- 7.1.1.1. ELISA
- 7.1.1.2. Western Blot
- 7.1.2. Lymphocytic Transformation Test
- 7.1.3. Urine Antigen Testing
- 7.1.4. Immunofluorescent Staining
- 7.1.5. Nucleic acid Test
- 7.1.1. Serological Test
- 7.2. Market Analysis, Insights and Forecast - by End User
- 7.2.1. Hospitals
- 7.2.2. Clinical Laboratories
- 7.2.2.1. Other End-Users
- 7.1. Market Analysis, Insights and Forecast - by Diagnostic Technology
- 8. Asia Pacific Lyme Disease Diagnostic Industry Analysis, Insights and Forecast, 2019-2031
- 8.1. Market Analysis, Insights and Forecast - by Diagnostic Technology
- 8.1.1. Serological Test
- 8.1.1.1. ELISA
- 8.1.1.2. Western Blot
- 8.1.2. Lymphocytic Transformation Test
- 8.1.3. Urine Antigen Testing
- 8.1.4. Immunofluorescent Staining
- 8.1.5. Nucleic acid Test
- 8.1.1. Serological Test
- 8.2. Market Analysis, Insights and Forecast - by End User
- 8.2.1. Hospitals
- 8.2.2. Clinical Laboratories
- 8.2.2.1. Other End-Users
- 8.1. Market Analysis, Insights and Forecast - by Diagnostic Technology
- 9. Middle East and Africa Lyme Disease Diagnostic Industry Analysis, Insights and Forecast, 2019-2031
- 9.1. Market Analysis, Insights and Forecast - by Diagnostic Technology
- 9.1.1. Serological Test
- 9.1.1.1. ELISA
- 9.1.1.2. Western Blot
- 9.1.2. Lymphocytic Transformation Test
- 9.1.3. Urine Antigen Testing
- 9.1.4. Immunofluorescent Staining
- 9.1.5. Nucleic acid Test
- 9.1.1. Serological Test
- 9.2. Market Analysis, Insights and Forecast - by End User
- 9.2.1. Hospitals
- 9.2.2. Clinical Laboratories
- 9.2.2.1. Other End-Users
- 9.1. Market Analysis, Insights and Forecast - by Diagnostic Technology
- 10. South America Lyme Disease Diagnostic Industry Analysis, Insights and Forecast, 2019-2031
- 10.1. Market Analysis, Insights and Forecast - by Diagnostic Technology
- 10.1.1. Serological Test
- 10.1.1.1. ELISA
- 10.1.1.2. Western Blot
- 10.1.2. Lymphocytic Transformation Test
- 10.1.3. Urine Antigen Testing
- 10.1.4. Immunofluorescent Staining
- 10.1.5. Nucleic acid Test
- 10.1.1. Serological Test
- 10.2. Market Analysis, Insights and Forecast - by End User
- 10.2.1. Hospitals
- 10.2.2. Clinical Laboratories
- 10.2.2.1. Other End-Users
- 10.1. Market Analysis, Insights and Forecast - by Diagnostic Technology
- 11. North America Lyme Disease Diagnostic Industry Analysis, Insights and Forecast, 2019-2031
- 11.1. Market Analysis, Insights and Forecast - By Country/Sub-region
- 11.1.1 United States
- 11.1.2 Canada
- 11.1.3 Mexico
- 12. Europe Lyme Disease Diagnostic Industry Analysis, Insights and Forecast, 2019-2031
- 12.1. Market Analysis, Insights and Forecast - By Country/Sub-region
- 12.1.1 Germany
- 12.1.2 United Kingdom
- 12.1.3 France
- 12.1.4 Italy
- 12.1.5 Spain
- 12.1.6 Rest of Europe
- 13. Asia Pacific Lyme Disease Diagnostic Industry Analysis, Insights and Forecast, 2019-2031
- 13.1. Market Analysis, Insights and Forecast - By Country/Sub-region
- 13.1.1 China
- 13.1.2 Japan
- 13.1.3 India
- 13.1.4 Australia
- 13.1.5 South Korea
- 13.1.6 Rest of Asia Pacific
- 14. Middle East and Africa Lyme Disease Diagnostic Industry Analysis, Insights and Forecast, 2019-2031
- 14.1. Market Analysis, Insights and Forecast - By Country/Sub-region
- 14.1.1 GCC
- 14.1.2 South Africa
- 14.1.3 Rest of Middle East and Africa
- 15. South America Lyme Disease Diagnostic Industry Analysis, Insights and Forecast, 2019-2031
- 15.1. Market Analysis, Insights and Forecast - By Country/Sub-region
- 15.1.1 Brazil
- 15.1.2 Argentina
- 15.1.3 Rest of South America
- 16. Competitive Analysis
- 16.1. Global Market Share Analysis 2024
- 16.2. Company Profiles
- 16.2.1 Bio-Rad Laboratories Inc
- 16.2.1.1. Overview
- 16.2.1.2. Products
- 16.2.1.3. SWOT Analysis
- 16.2.1.4. Recent Developments
- 16.2.1.5. Financials (Based on Availability)
- 16.2.2 Covance Inc
- 16.2.2.1. Overview
- 16.2.2.2. Products
- 16.2.2.3. SWOT Analysis
- 16.2.2.4. Recent Developments
- 16.2.2.5. Financials (Based on Availability)
- 16.2.3 T2 Biosystems Inc
- 16.2.3.1. Overview
- 16.2.3.2. Products
- 16.2.3.3. SWOT Analysis
- 16.2.3.4. Recent Developments
- 16.2.3.5. Financials (Based on Availability)
- 16.2.4 Oxford Immunotec USA Inc
- 16.2.4.1. Overview
- 16.2.4.2. Products
- 16.2.4.3. SWOT Analysis
- 16.2.4.4. Recent Developments
- 16.2.4.5. Financials (Based on Availability)
- 16.2.5 F Hoffmann-La Roche AG
- 16.2.5.1. Overview
- 16.2.5.2. Products
- 16.2.5.3. SWOT Analysis
- 16.2.5.4. Recent Developments
- 16.2.5.5. Financials (Based on Availability)
- 16.2.6 Abbott
- 16.2.6.1. Overview
- 16.2.6.2. Products
- 16.2.6.3. SWOT Analysis
- 16.2.6.4. Recent Developments
- 16.2.6.5. Financials (Based on Availability)
- 16.2.1 Bio-Rad Laboratories Inc
List of Figures
- Figure 1: Global Lyme Disease Diagnostic Industry Revenue Breakdown (Million, %) by Region 2024 & 2032
- Figure 2: Global Lyme Disease Diagnostic Industry Volume Breakdown (K Unit, %) by Region 2024 & 2032
- Figure 3: North America Lyme Disease Diagnostic Industry Revenue (Million), by Country 2024 & 2032
- Figure 4: North America Lyme Disease Diagnostic Industry Volume (K Unit), by Country 2024 & 2032
- Figure 5: North America Lyme Disease Diagnostic Industry Revenue Share (%), by Country 2024 & 2032
- Figure 6: North America Lyme Disease Diagnostic Industry Volume Share (%), by Country 2024 & 2032
- Figure 7: Europe Lyme Disease Diagnostic Industry Revenue (Million), by Country 2024 & 2032
- Figure 8: Europe Lyme Disease Diagnostic Industry Volume (K Unit), by Country 2024 & 2032
- Figure 9: Europe Lyme Disease Diagnostic Industry Revenue Share (%), by Country 2024 & 2032
- Figure 10: Europe Lyme Disease Diagnostic Industry Volume Share (%), by Country 2024 & 2032
- Figure 11: Asia Pacific Lyme Disease Diagnostic Industry Revenue (Million), by Country 2024 & 2032
- Figure 12: Asia Pacific Lyme Disease Diagnostic Industry Volume (K Unit), by Country 2024 & 2032
- Figure 13: Asia Pacific Lyme Disease Diagnostic Industry Revenue Share (%), by Country 2024 & 2032
- Figure 14: Asia Pacific Lyme Disease Diagnostic Industry Volume Share (%), by Country 2024 & 2032
- Figure 15: Middle East and Africa Lyme Disease Diagnostic Industry Revenue (Million), by Country 2024 & 2032
- Figure 16: Middle East and Africa Lyme Disease Diagnostic Industry Volume (K Unit), by Country 2024 & 2032
- Figure 17: Middle East and Africa Lyme Disease Diagnostic Industry Revenue Share (%), by Country 2024 & 2032
- Figure 18: Middle East and Africa Lyme Disease Diagnostic Industry Volume Share (%), by Country 2024 & 2032
- Figure 19: South America Lyme Disease Diagnostic Industry Revenue (Million), by Country 2024 & 2032
- Figure 20: South America Lyme Disease Diagnostic Industry Volume (K Unit), by Country 2024 & 2032
- Figure 21: South America Lyme Disease Diagnostic Industry Revenue Share (%), by Country 2024 & 2032
- Figure 22: South America Lyme Disease Diagnostic Industry Volume Share (%), by Country 2024 & 2032
- Figure 23: North America Lyme Disease Diagnostic Industry Revenue (Million), by Diagnostic Technology 2024 & 2032
- Figure 24: North America Lyme Disease Diagnostic Industry Volume (K Unit), by Diagnostic Technology 2024 & 2032
- Figure 25: North America Lyme Disease Diagnostic Industry Revenue Share (%), by Diagnostic Technology 2024 & 2032
- Figure 26: North America Lyme Disease Diagnostic Industry Volume Share (%), by Diagnostic Technology 2024 & 2032
- Figure 27: North America Lyme Disease Diagnostic Industry Revenue (Million), by End User 2024 & 2032
- Figure 28: North America Lyme Disease Diagnostic Industry Volume (K Unit), by End User 2024 & 2032
- Figure 29: North America Lyme Disease Diagnostic Industry Revenue Share (%), by End User 2024 & 2032
- Figure 30: North America Lyme Disease Diagnostic Industry Volume Share (%), by End User 2024 & 2032
- Figure 31: North America Lyme Disease Diagnostic Industry Revenue (Million), by Country 2024 & 2032
- Figure 32: North America Lyme Disease Diagnostic Industry Volume (K Unit), by Country 2024 & 2032
- Figure 33: North America Lyme Disease Diagnostic Industry Revenue Share (%), by Country 2024 & 2032
- Figure 34: North America Lyme Disease Diagnostic Industry Volume Share (%), by Country 2024 & 2032
- Figure 35: Europe Lyme Disease Diagnostic Industry Revenue (Million), by Diagnostic Technology 2024 & 2032
- Figure 36: Europe Lyme Disease Diagnostic Industry Volume (K Unit), by Diagnostic Technology 2024 & 2032
- Figure 37: Europe Lyme Disease Diagnostic Industry Revenue Share (%), by Diagnostic Technology 2024 & 2032
- Figure 38: Europe Lyme Disease Diagnostic Industry Volume Share (%), by Diagnostic Technology 2024 & 2032
- Figure 39: Europe Lyme Disease Diagnostic Industry Revenue (Million), by End User 2024 & 2032
- Figure 40: Europe Lyme Disease Diagnostic Industry Volume (K Unit), by End User 2024 & 2032
- Figure 41: Europe Lyme Disease Diagnostic Industry Revenue Share (%), by End User 2024 & 2032
- Figure 42: Europe Lyme Disease Diagnostic Industry Volume Share (%), by End User 2024 & 2032
- Figure 43: Europe Lyme Disease Diagnostic Industry Revenue (Million), by Country 2024 & 2032
- Figure 44: Europe Lyme Disease Diagnostic Industry Volume (K Unit), by Country 2024 & 2032
- Figure 45: Europe Lyme Disease Diagnostic Industry Revenue Share (%), by Country 2024 & 2032
- Figure 46: Europe Lyme Disease Diagnostic Industry Volume Share (%), by Country 2024 & 2032
- Figure 47: Asia Pacific Lyme Disease Diagnostic Industry Revenue (Million), by Diagnostic Technology 2024 & 2032
- Figure 48: Asia Pacific Lyme Disease Diagnostic Industry Volume (K Unit), by Diagnostic Technology 2024 & 2032
- Figure 49: Asia Pacific Lyme Disease Diagnostic Industry Revenue Share (%), by Diagnostic Technology 2024 & 2032
- Figure 50: Asia Pacific Lyme Disease Diagnostic Industry Volume Share (%), by Diagnostic Technology 2024 & 2032
- Figure 51: Asia Pacific Lyme Disease Diagnostic Industry Revenue (Million), by End User 2024 & 2032
- Figure 52: Asia Pacific Lyme Disease Diagnostic Industry Volume (K Unit), by End User 2024 & 2032
- Figure 53: Asia Pacific Lyme Disease Diagnostic Industry Revenue Share (%), by End User 2024 & 2032
- Figure 54: Asia Pacific Lyme Disease Diagnostic Industry Volume Share (%), by End User 2024 & 2032
- Figure 55: Asia Pacific Lyme Disease Diagnostic Industry Revenue (Million), by Country 2024 & 2032
- Figure 56: Asia Pacific Lyme Disease Diagnostic Industry Volume (K Unit), by Country 2024 & 2032
- Figure 57: Asia Pacific Lyme Disease Diagnostic Industry Revenue Share (%), by Country 2024 & 2032
- Figure 58: Asia Pacific Lyme Disease Diagnostic Industry Volume Share (%), by Country 2024 & 2032
- Figure 59: Middle East and Africa Lyme Disease Diagnostic Industry Revenue (Million), by Diagnostic Technology 2024 & 2032
- Figure 60: Middle East and Africa Lyme Disease Diagnostic Industry Volume (K Unit), by Diagnostic Technology 2024 & 2032
- Figure 61: Middle East and Africa Lyme Disease Diagnostic Industry Revenue Share (%), by Diagnostic Technology 2024 & 2032
- Figure 62: Middle East and Africa Lyme Disease Diagnostic Industry Volume Share (%), by Diagnostic Technology 2024 & 2032
- Figure 63: Middle East and Africa Lyme Disease Diagnostic Industry Revenue (Million), by End User 2024 & 2032
- Figure 64: Middle East and Africa Lyme Disease Diagnostic Industry Volume (K Unit), by End User 2024 & 2032
- Figure 65: Middle East and Africa Lyme Disease Diagnostic Industry Revenue Share (%), by End User 2024 & 2032
- Figure 66: Middle East and Africa Lyme Disease Diagnostic Industry Volume Share (%), by End User 2024 & 2032
- Figure 67: Middle East and Africa Lyme Disease Diagnostic Industry Revenue (Million), by Country 2024 & 2032
- Figure 68: Middle East and Africa Lyme Disease Diagnostic Industry Volume (K Unit), by Country 2024 & 2032
- Figure 69: Middle East and Africa Lyme Disease Diagnostic Industry Revenue Share (%), by Country 2024 & 2032
- Figure 70: Middle East and Africa Lyme Disease Diagnostic Industry Volume Share (%), by Country 2024 & 2032
- Figure 71: South America Lyme Disease Diagnostic Industry Revenue (Million), by Diagnostic Technology 2024 & 2032
- Figure 72: South America Lyme Disease Diagnostic Industry Volume (K Unit), by Diagnostic Technology 2024 & 2032
- Figure 73: South America Lyme Disease Diagnostic Industry Revenue Share (%), by Diagnostic Technology 2024 & 2032
- Figure 74: South America Lyme Disease Diagnostic Industry Volume Share (%), by Diagnostic Technology 2024 & 2032
- Figure 75: South America Lyme Disease Diagnostic Industry Revenue (Million), by End User 2024 & 2032
- Figure 76: South America Lyme Disease Diagnostic Industry Volume (K Unit), by End User 2024 & 2032
- Figure 77: South America Lyme Disease Diagnostic Industry Revenue Share (%), by End User 2024 & 2032
- Figure 78: South America Lyme Disease Diagnostic Industry Volume Share (%), by End User 2024 & 2032
- Figure 79: South America Lyme Disease Diagnostic Industry Revenue (Million), by Country 2024 & 2032
- Figure 80: South America Lyme Disease Diagnostic Industry Volume (K Unit), by Country 2024 & 2032
- Figure 81: South America Lyme Disease Diagnostic Industry Revenue Share (%), by Country 2024 & 2032
- Figure 82: South America Lyme Disease Diagnostic Industry Volume Share (%), by Country 2024 & 2032
List of Tables
- Table 1: Global Lyme Disease Diagnostic Industry Revenue Million Forecast, by Region 2019 & 2032
- Table 2: Global Lyme Disease Diagnostic Industry Volume K Unit Forecast, by Region 2019 & 2032
- Table 3: Global Lyme Disease Diagnostic Industry Revenue Million Forecast, by Diagnostic Technology 2019 & 2032
- Table 4: Global Lyme Disease Diagnostic Industry Volume K Unit Forecast, by Diagnostic Technology 2019 & 2032
- Table 5: Global Lyme Disease Diagnostic Industry Revenue Million Forecast, by End User 2019 & 2032
- Table 6: Global Lyme Disease Diagnostic Industry Volume K Unit Forecast, by End User 2019 & 2032
- Table 7: Global Lyme Disease Diagnostic Industry Revenue Million Forecast, by Region 2019 & 2032
- Table 8: Global Lyme Disease Diagnostic Industry Volume K Unit Forecast, by Region 2019 & 2032
- Table 9: Global Lyme Disease Diagnostic Industry Revenue Million Forecast, by Country 2019 & 2032
- Table 10: Global Lyme Disease Diagnostic Industry Volume K Unit Forecast, by Country 2019 & 2032
- Table 11: United States Lyme Disease Diagnostic Industry Revenue (Million) Forecast, by Application 2019 & 2032
- Table 12: United States Lyme Disease Diagnostic Industry Volume (K Unit) Forecast, by Application 2019 & 2032
- Table 13: Canada Lyme Disease Diagnostic Industry Revenue (Million) Forecast, by Application 2019 & 2032
- Table 14: Canada Lyme Disease Diagnostic Industry Volume (K Unit) Forecast, by Application 2019 & 2032
- Table 15: Mexico Lyme Disease Diagnostic Industry Revenue (Million) Forecast, by Application 2019 & 2032
- Table 16: Mexico Lyme Disease Diagnostic Industry Volume (K Unit) Forecast, by Application 2019 & 2032
- Table 17: Global Lyme Disease Diagnostic Industry Revenue Million Forecast, by Country 2019 & 2032
- Table 18: Global Lyme Disease Diagnostic Industry Volume K Unit Forecast, by Country 2019 & 2032
- Table 19: Germany Lyme Disease Diagnostic Industry Revenue (Million) Forecast, by Application 2019 & 2032
- Table 20: Germany Lyme Disease Diagnostic Industry Volume (K Unit) Forecast, by Application 2019 & 2032
- Table 21: United Kingdom Lyme Disease Diagnostic Industry Revenue (Million) Forecast, by Application 2019 & 2032
- Table 22: United Kingdom Lyme Disease Diagnostic Industry Volume (K Unit) Forecast, by Application 2019 & 2032
- Table 23: France Lyme Disease Diagnostic Industry Revenue (Million) Forecast, by Application 2019 & 2032
- Table 24: France Lyme Disease Diagnostic Industry Volume (K Unit) Forecast, by Application 2019 & 2032
- Table 25: Italy Lyme Disease Diagnostic Industry Revenue (Million) Forecast, by Application 2019 & 2032
- Table 26: Italy Lyme Disease Diagnostic Industry Volume (K Unit) Forecast, by Application 2019 & 2032
- Table 27: Spain Lyme Disease Diagnostic Industry Revenue (Million) Forecast, by Application 2019 & 2032
- Table 28: Spain Lyme Disease Diagnostic Industry Volume (K Unit) Forecast, by Application 2019 & 2032
- Table 29: Rest of Europe Lyme Disease Diagnostic Industry Revenue (Million) Forecast, by Application 2019 & 2032
- Table 30: Rest of Europe Lyme Disease Diagnostic Industry Volume (K Unit) Forecast, by Application 2019 & 2032
- Table 31: Global Lyme Disease Diagnostic Industry Revenue Million Forecast, by Country 2019 & 2032
- Table 32: Global Lyme Disease Diagnostic Industry Volume K Unit Forecast, by Country 2019 & 2032
- Table 33: China Lyme Disease Diagnostic Industry Revenue (Million) Forecast, by Application 2019 & 2032
- Table 34: China Lyme Disease Diagnostic Industry Volume (K Unit) Forecast, by Application 2019 & 2032
- Table 35: Japan Lyme Disease Diagnostic Industry Revenue (Million) Forecast, by Application 2019 & 2032
- Table 36: Japan Lyme Disease Diagnostic Industry Volume (K Unit) Forecast, by Application 2019 & 2032
- Table 37: India Lyme Disease Diagnostic Industry Revenue (Million) Forecast, by Application 2019 & 2032
- Table 38: India Lyme Disease Diagnostic Industry Volume (K Unit) Forecast, by Application 2019 & 2032
- Table 39: Australia Lyme Disease Diagnostic Industry Revenue (Million) Forecast, by Application 2019 & 2032
- Table 40: Australia Lyme Disease Diagnostic Industry Volume (K Unit) Forecast, by Application 2019 & 2032
- Table 41: South Korea Lyme Disease Diagnostic Industry Revenue (Million) Forecast, by Application 2019 & 2032
- Table 42: South Korea Lyme Disease Diagnostic Industry Volume (K Unit) Forecast, by Application 2019 & 2032
- Table 43: Rest of Asia Pacific Lyme Disease Diagnostic Industry Revenue (Million) Forecast, by Application 2019 & 2032
- Table 44: Rest of Asia Pacific Lyme Disease Diagnostic Industry Volume (K Unit) Forecast, by Application 2019 & 2032
- Table 45: Global Lyme Disease Diagnostic Industry Revenue Million Forecast, by Country 2019 & 2032
- Table 46: Global Lyme Disease Diagnostic Industry Volume K Unit Forecast, by Country 2019 & 2032
- Table 47: GCC Lyme Disease Diagnostic Industry Revenue (Million) Forecast, by Application 2019 & 2032
- Table 48: GCC Lyme Disease Diagnostic Industry Volume (K Unit) Forecast, by Application 2019 & 2032
- Table 49: South Africa Lyme Disease Diagnostic Industry Revenue (Million) Forecast, by Application 2019 & 2032
- Table 50: South Africa Lyme Disease Diagnostic Industry Volume (K Unit) Forecast, by Application 2019 & 2032
- Table 51: Rest of Middle East and Africa Lyme Disease Diagnostic Industry Revenue (Million) Forecast, by Application 2019 & 2032
- Table 52: Rest of Middle East and Africa Lyme Disease Diagnostic Industry Volume (K Unit) Forecast, by Application 2019 & 2032
- Table 53: Global Lyme Disease Diagnostic Industry Revenue Million Forecast, by Country 2019 & 2032
- Table 54: Global Lyme Disease Diagnostic Industry Volume K Unit Forecast, by Country 2019 & 2032
- Table 55: Brazil Lyme Disease Diagnostic Industry Revenue (Million) Forecast, by Application 2019 & 2032
- Table 56: Brazil Lyme Disease Diagnostic Industry Volume (K Unit) Forecast, by Application 2019 & 2032
- Table 57: Argentina Lyme Disease Diagnostic Industry Revenue (Million) Forecast, by Application 2019 & 2032
- Table 58: Argentina Lyme Disease Diagnostic Industry Volume (K Unit) Forecast, by Application 2019 & 2032
- Table 59: Rest of South America Lyme Disease Diagnostic Industry Revenue (Million) Forecast, by Application 2019 & 2032
- Table 60: Rest of South America Lyme Disease Diagnostic Industry Volume (K Unit) Forecast, by Application 2019 & 2032
- Table 61: Global Lyme Disease Diagnostic Industry Revenue Million Forecast, by Diagnostic Technology 2019 & 2032
- Table 62: Global Lyme Disease Diagnostic Industry Volume K Unit Forecast, by Diagnostic Technology 2019 & 2032
- Table 63: Global Lyme Disease Diagnostic Industry Revenue Million Forecast, by End User 2019 & 2032
- Table 64: Global Lyme Disease Diagnostic Industry Volume K Unit Forecast, by End User 2019 & 2032
- Table 65: Global Lyme Disease Diagnostic Industry Revenue Million Forecast, by Country 2019 & 2032
- Table 66: Global Lyme Disease Diagnostic Industry Volume K Unit Forecast, by Country 2019 & 2032
- Table 67: United States Lyme Disease Diagnostic Industry Revenue (Million) Forecast, by Application 2019 & 2032
- Table 68: United States Lyme Disease Diagnostic Industry Volume (K Unit) Forecast, by Application 2019 & 2032
- Table 69: Canada Lyme Disease Diagnostic Industry Revenue (Million) Forecast, by Application 2019 & 2032
- Table 70: Canada Lyme Disease Diagnostic Industry Volume (K Unit) Forecast, by Application 2019 & 2032
- Table 71: Mexico Lyme Disease Diagnostic Industry Revenue (Million) Forecast, by Application 2019 & 2032
- Table 72: Mexico Lyme Disease Diagnostic Industry Volume (K Unit) Forecast, by Application 2019 & 2032
- Table 73: Global Lyme Disease Diagnostic Industry Revenue Million Forecast, by Diagnostic Technology 2019 & 2032
- Table 74: Global Lyme Disease Diagnostic Industry Volume K Unit Forecast, by Diagnostic Technology 2019 & 2032
- Table 75: Global Lyme Disease Diagnostic Industry Revenue Million Forecast, by End User 2019 & 2032
- Table 76: Global Lyme Disease Diagnostic Industry Volume K Unit Forecast, by End User 2019 & 2032
- Table 77: Global Lyme Disease Diagnostic Industry Revenue Million Forecast, by Country 2019 & 2032
- Table 78: Global Lyme Disease Diagnostic Industry Volume K Unit Forecast, by Country 2019 & 2032
- Table 79: Germany Lyme Disease Diagnostic Industry Revenue (Million) Forecast, by Application 2019 & 2032
- Table 80: Germany Lyme Disease Diagnostic Industry Volume (K Unit) Forecast, by Application 2019 & 2032
- Table 81: United Kingdom Lyme Disease Diagnostic Industry Revenue (Million) Forecast, by Application 2019 & 2032
- Table 82: United Kingdom Lyme Disease Diagnostic Industry Volume (K Unit) Forecast, by Application 2019 & 2032
- Table 83: France Lyme Disease Diagnostic Industry Revenue (Million) Forecast, by Application 2019 & 2032
- Table 84: France Lyme Disease Diagnostic Industry Volume (K Unit) Forecast, by Application 2019 & 2032
- Table 85: Italy Lyme Disease Diagnostic Industry Revenue (Million) Forecast, by Application 2019 & 2032
- Table 86: Italy Lyme Disease Diagnostic Industry Volume (K Unit) Forecast, by Application 2019 & 2032
- Table 87: Spain Lyme Disease Diagnostic Industry Revenue (Million) Forecast, by Application 2019 & 2032
- Table 88: Spain Lyme Disease Diagnostic Industry Volume (K Unit) Forecast, by Application 2019 & 2032
- Table 89: Rest of Europe Lyme Disease Diagnostic Industry Revenue (Million) Forecast, by Application 2019 & 2032
- Table 90: Rest of Europe Lyme Disease Diagnostic Industry Volume (K Unit) Forecast, by Application 2019 & 2032
- Table 91: Global Lyme Disease Diagnostic Industry Revenue Million Forecast, by Diagnostic Technology 2019 & 2032
- Table 92: Global Lyme Disease Diagnostic Industry Volume K Unit Forecast, by Diagnostic Technology 2019 & 2032
- Table 93: Global Lyme Disease Diagnostic Industry Revenue Million Forecast, by End User 2019 & 2032
- Table 94: Global Lyme Disease Diagnostic Industry Volume K Unit Forecast, by End User 2019 & 2032
- Table 95: Global Lyme Disease Diagnostic Industry Revenue Million Forecast, by Country 2019 & 2032
- Table 96: Global Lyme Disease Diagnostic Industry Volume K Unit Forecast, by Country 2019 & 2032
- Table 97: China Lyme Disease Diagnostic Industry Revenue (Million) Forecast, by Application 2019 & 2032
- Table 98: China Lyme Disease Diagnostic Industry Volume (K Unit) Forecast, by Application 2019 & 2032
- Table 99: Japan Lyme Disease Diagnostic Industry Revenue (Million) Forecast, by Application 2019 & 2032
- Table 100: Japan Lyme Disease Diagnostic Industry Volume (K Unit) Forecast, by Application 2019 & 2032
- Table 101: India Lyme Disease Diagnostic Industry Revenue (Million) Forecast, by Application 2019 & 2032
- Table 102: India Lyme Disease Diagnostic Industry Volume (K Unit) Forecast, by Application 2019 & 2032
- Table 103: Australia Lyme Disease Diagnostic Industry Revenue (Million) Forecast, by Application 2019 & 2032
- Table 104: Australia Lyme Disease Diagnostic Industry Volume (K Unit) Forecast, by Application 2019 & 2032
- Table 105: South Korea Lyme Disease Diagnostic Industry Revenue (Million) Forecast, by Application 2019 & 2032
- Table 106: South Korea Lyme Disease Diagnostic Industry Volume (K Unit) Forecast, by Application 2019 & 2032
- Table 107: Rest of Asia Pacific Lyme Disease Diagnostic Industry Revenue (Million) Forecast, by Application 2019 & 2032
- Table 108: Rest of Asia Pacific Lyme Disease Diagnostic Industry Volume (K Unit) Forecast, by Application 2019 & 2032
- Table 109: Global Lyme Disease Diagnostic Industry Revenue Million Forecast, by Diagnostic Technology 2019 & 2032
- Table 110: Global Lyme Disease Diagnostic Industry Volume K Unit Forecast, by Diagnostic Technology 2019 & 2032
- Table 111: Global Lyme Disease Diagnostic Industry Revenue Million Forecast, by End User 2019 & 2032
- Table 112: Global Lyme Disease Diagnostic Industry Volume K Unit Forecast, by End User 2019 & 2032
- Table 113: Global Lyme Disease Diagnostic Industry Revenue Million Forecast, by Country 2019 & 2032
- Table 114: Global Lyme Disease Diagnostic Industry Volume K Unit Forecast, by Country 2019 & 2032
- Table 115: GCC Lyme Disease Diagnostic Industry Revenue (Million) Forecast, by Application 2019 & 2032
- Table 116: GCC Lyme Disease Diagnostic Industry Volume (K Unit) Forecast, by Application 2019 & 2032
- Table 117: South Africa Lyme Disease Diagnostic Industry Revenue (Million) Forecast, by Application 2019 & 2032
- Table 118: South Africa Lyme Disease Diagnostic Industry Volume (K Unit) Forecast, by Application 2019 & 2032
- Table 119: Rest of Middle East and Africa Lyme Disease Diagnostic Industry Revenue (Million) Forecast, by Application 2019 & 2032
- Table 120: Rest of Middle East and Africa Lyme Disease Diagnostic Industry Volume (K Unit) Forecast, by Application 2019 & 2032
- Table 121: Global Lyme Disease Diagnostic Industry Revenue Million Forecast, by Diagnostic Technology 2019 & 2032
- Table 122: Global Lyme Disease Diagnostic Industry Volume K Unit Forecast, by Diagnostic Technology 2019 & 2032
- Table 123: Global Lyme Disease Diagnostic Industry Revenue Million Forecast, by End User 2019 & 2032
- Table 124: Global Lyme Disease Diagnostic Industry Volume K Unit Forecast, by End User 2019 & 2032
- Table 125: Global Lyme Disease Diagnostic Industry Revenue Million Forecast, by Country 2019 & 2032
- Table 126: Global Lyme Disease Diagnostic Industry Volume K Unit Forecast, by Country 2019 & 2032
- Table 127: Brazil Lyme Disease Diagnostic Industry Revenue (Million) Forecast, by Application 2019 & 2032
- Table 128: Brazil Lyme Disease Diagnostic Industry Volume (K Unit) Forecast, by Application 2019 & 2032
- Table 129: Argentina Lyme Disease Diagnostic Industry Revenue (Million) Forecast, by Application 2019 & 2032
- Table 130: Argentina Lyme Disease Diagnostic Industry Volume (K Unit) Forecast, by Application 2019 & 2032
- Table 131: Rest of South America Lyme Disease Diagnostic Industry Revenue (Million) Forecast, by Application 2019 & 2032
- Table 132: Rest of South America Lyme Disease Diagnostic Industry Volume (K Unit) Forecast, by Application 2019 & 2032
Frequently Asked Questions
1. What is the projected Compound Annual Growth Rate (CAGR) of the Lyme Disease Diagnostic Industry?
The projected CAGR is approximately 5.50%.
2. Which companies are prominent players in the Lyme Disease Diagnostic Industry?
Key companies in the market include Bio-Rad Laboratories Inc, Covance Inc, T2 Biosystems Inc, Oxford Immunotec USA Inc , F Hoffmann-La Roche AG, Abbott.
3. What are the main segments of the Lyme Disease Diagnostic Industry?
The market segments include Diagnostic Technology, End User.
4. Can you provide details about the market size?
The market size is estimated to be USD XX Million as of 2022.
5. What are some drivers contributing to market growth?
Rise in Prevalence of Lyme Disease; Favorable Government Towards Healthcare Facilities; Emergence of New Lyme Diagnostic Tests.
6. What are the notable trends driving market growth?
Serological Test Segment to Witness Significant Growth Over the Forecast Period in the Lyme Disease Diagnostic Market..
7. Are there any restraints impacting market growth?
Lack of Awareness Regarding the Disease.
8. Can you provide examples of recent developments in the market?
In July 2022, T2Biosystems, T2Lyme Panel was granted by the United States Food and Drug Administration (USFDA). The T2Lyme Panel is designed to provide greater accuracy in the diagnosis of early Lyme disease, which may help improve care and lead to better patient outcomes. The T2Lyme Panel identifies the bacteria that cause Lyme disease directly from a patient's blood.
9. What pricing options are available for accessing the report?
Pricing options include single-user, multi-user, and enterprise licenses priced at USD 4750, USD 5250, and USD 8750 respectively.
10. Is the market size provided in terms of value or volume?
The market size is provided in terms of value, measured in Million and volume, measured in K Unit.
11. Are there any specific market keywords associated with the report?
Yes, the market keyword associated with the report is "Lyme Disease Diagnostic Industry," which aids in identifying and referencing the specific market segment covered.
12. How do I determine which pricing option suits my needs best?
The pricing options vary based on user requirements and access needs. Individual users may opt for single-user licenses, while businesses requiring broader access may choose multi-user or enterprise licenses for cost-effective access to the report.
13. Are there any additional resources or data provided in the Lyme Disease Diagnostic Industry report?
While the report offers comprehensive insights, it's advisable to review the specific contents or supplementary materials provided to ascertain if additional resources or data are available.
14. How can I stay updated on further developments or reports in the Lyme Disease Diagnostic Industry?
To stay informed about further developments, trends, and reports in the Lyme Disease Diagnostic Industry, consider subscribing to industry newsletters, following relevant companies and organizations, or regularly checking reputable industry news sources and publications.
Methodology
Step 1 - Identification of Relevant Samples Size from Population Database


Step 2 - Approaches for Defining Global Market Size (Value, Volume* & Price*)

Note*: In applicable scenarios
Step 3 - Data Sources
Primary Research
- Web Analytics
- Survey Reports
- Research Institute
- Latest Research Reports
- Opinion Leaders
Secondary Research
- Annual Reports
- White Paper
- Latest Press Release
- Industry Association
- Paid Database
- Investor Presentations

Step 4 - Data Triangulation
Involves using different sources of information in order to increase the validity of a study
These sources are likely to be stakeholders in a program - participants, other researchers, program staff, other community members, and so on.
Then we put all data in single framework & apply various statistical tools to find out the dynamic on the market.
During the analysis stage, feedback from the stakeholder groups would be compared to determine areas of agreement as well as areas of divergence
