

Key Insights
The global mass spectrometry market, valued at $6.77 billion in 2025, is projected to experience robust growth, driven by a compound annual growth rate (CAGR) of 6.25% from 2025 to 2033. This expansion is fueled by several key factors. Firstly, the increasing prevalence of chronic diseases globally necessitates advanced diagnostic tools, significantly boosting the demand for mass spectrometry in pharmaceutical and biotechnology research and development. Secondly, the growing need for precise and rapid drug discovery and development is propelling the adoption of high-throughput mass spectrometry techniques. Thirdly, advancements in mass spectrometry technology, such as the development of miniaturized and portable instruments, are expanding its applications across various industries including environmental monitoring and food safety testing. The segmental analysis reveals that hybrid mass spectrometry holds a significant market share due to its enhanced capabilities and versatility. Within applications, the pharmaceuticals industry currently dominates, followed by the biotechnology and chemical sectors. Geographically, North America and Europe are currently the leading markets, but the Asia-Pacific region is expected to witness substantial growth owing to rapid economic development and increasing healthcare investments.
The competitive landscape is characterized by a mix of established players and emerging companies. Key players like Thermo Fisher Scientific, Agilent Technologies, and Waters Corporation maintain strong market positions through continuous innovation and strategic acquisitions. However, the market is dynamic with new entrants focusing on niche applications and improved cost-effectiveness. Future growth will likely be influenced by ongoing technological advancements focusing on improved sensitivity, resolution, and speed, along with wider adoption of mass spectrometry in emerging economies. Regulatory approvals and stringent quality control measures will also continue to shape market dynamics. The market is expected to see increased consolidation and strategic collaborations as companies strive to expand their market reach and enhance their product portfolios.

Mass Spectrometry Market Report: A Comprehensive Analysis (2019-2033)
This dynamic report provides an in-depth analysis of the Mass Spectrometry Market, offering valuable insights for industry stakeholders, investors, and researchers. The study covers the period 2019-2033, with a focus on the forecast period 2025-2033, utilizing 2025 as the base year. The report analyzes market trends, competitive dynamics, technological advancements, and regulatory impacts, providing a comprehensive overview of this rapidly evolving market, projected to reach xx Million by 2033.
Mass Spectrometry Market Market Structure & Competitive Landscape
The Mass Spectrometry market exhibits a moderately concentrated structure, with key players like Thermo Fisher Scientific, Agilent Technologies, and Waters Corporation holding significant market share. The market's competitive landscape is characterized by intense innovation, driven by the need for higher sensitivity, speed, and miniaturization in mass spectrometry instruments. Regulatory frameworks, particularly concerning safety and environmental standards, significantly impact market growth. Product substitutes, such as chromatography techniques, present competitive pressures. The market is segmented by technology (Hybrid Mass Spectrometry, FTMS, TOF, ICP-MS), application (Pharmaceuticals, Biotechnology, Chemical, Other), and end-user. M&A activity has been moderate in recent years, with xx number of deals recorded between 2019 and 2024, primarily focused on expanding product portfolios and geographic reach. The Herfindahl-Hirschman Index (HHI) for the market is estimated at xx, indicating a moderately concentrated market structure.
- Market Concentration: Moderately concentrated, with top 5 players holding approximately xx% market share.
- Innovation Drivers: Demand for higher sensitivity, resolution, speed, and miniaturization.
- Regulatory Impacts: Stringent safety and environmental regulations influence instrument design and usage.
- Product Substitutes: Chromatography techniques provide alternative analytical methods.
- End-User Segmentation: Pharmaceuticals, Biotechnology, Chemical, and other industries drive market demand.
- M&A Trends: Moderate activity, primarily focused on portfolio expansion and geographic reach.
Mass Spectrometry Market Market Trends & Opportunities
The global Mass Spectrometry market is experiencing significant growth, driven by factors such as the increasing adoption of mass spectrometry in various industries, advancements in technology, and rising demand for high-throughput analysis. The market is projected to register a CAGR of xx% during the forecast period (2025-2033), reaching a market value of xx Million by 2033. Technological advancements, such as the development of hybrid mass spectrometers and miniaturized instruments, are enhancing analytical capabilities and expanding market applications. Growing consumer preference for faster, more accurate, and cost-effective analytical solutions drives market growth. The pharmaceutical and biotechnology industries remain key drivers, followed by the chemical and environmental sectors. Competitive dynamics are intense, with major players focusing on innovation, strategic partnerships, and geographic expansion. Market penetration rates vary across regions and applications, with higher penetration observed in developed economies and established applications.

Dominant Markets & Segments in Mass Spectrometry Market
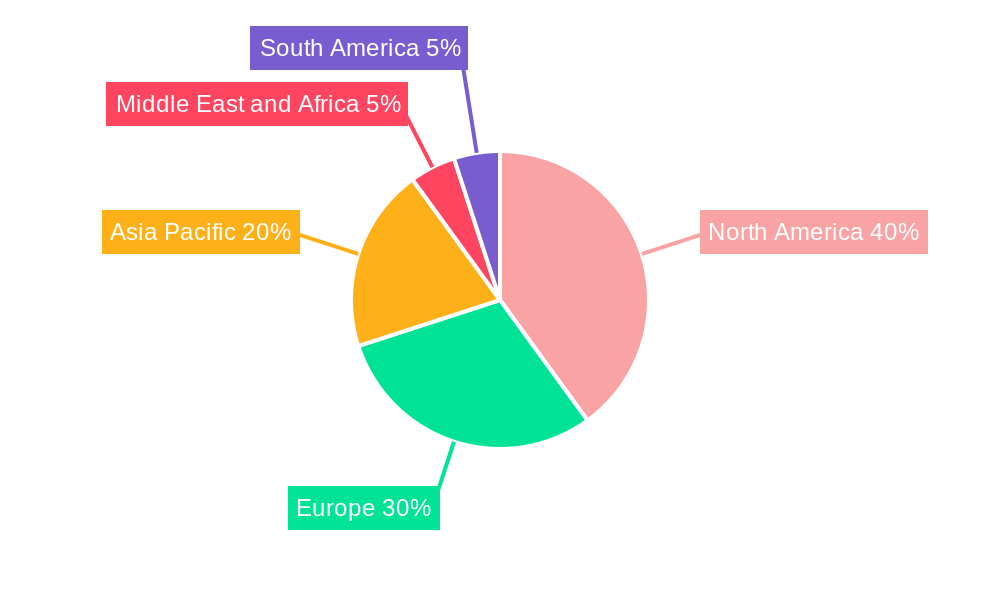
The North American region currently holds the largest market share, driven by robust research infrastructure and high technological advancements. Within the technology segments, Hybrid Mass Spectrometry is the dominant technology, exhibiting the highest growth rate due to its versatility and superior analytical performance. The Pharmaceuticals Industry is the leading application segment, owing to the extensive use of mass spectrometry in drug discovery, development, and quality control. Key growth drivers for this segment include:
- Robust R&D investments: Continuous research and development in pharmaceuticals drive demand for sophisticated analytical tools.
- Stringent regulatory requirements: Stringent regulatory compliance necessitates accurate and reliable analytical data.
- Growing adoption of personalized medicine: Personalized medicine relies heavily on mass spectrometry for targeted therapeutic approaches.
Other significant growth drivers include the increasing demand for high-throughput screening in the biotechnology industry and the growing need for precise chemical analysis in various applications. The Chemical Industry is another key segment with significant growth potential.
Mass Spectrometry Market Product Analysis
Recent product innovations in mass spectrometry focus on enhancing sensitivity, speed, and ease of use. The introduction of compact and highly sensitive benchtop systems such as Waters Corporation's Xevo TQ Absolute demonstrates a significant shift towards improved user-friendliness and reduced operational costs. These advancements enable wider accessibility across various industries, increasing the adoption rate. Miniaturization and improved software are key competitive advantages, driving market penetration.
Key Drivers, Barriers & Challenges in Mass Spectrometry Market
Key Drivers:
Technological advancements such as the development of hybrid mass spectrometry, improved software, and miniaturization are key drivers. The growing demand for high-throughput analysis across diverse industries, coupled with increased R&D spending, especially in the pharmaceutical and biotechnology sectors, fuels the market. Favorable government regulations promoting scientific research and development also play a crucial role.
Challenges and Restraints:
High instrument costs and sophisticated operational requirements limit market penetration in certain sectors. Supply chain disruptions can impact instrument availability and cost, while stringent regulatory approval processes and competitive pressures pose challenges for market players. The complexity of the technology and the need for specialized expertise also act as barriers to entry for new market players. Furthermore, the existence of alternative analytical techniques creates competition.
Growth Drivers in the Mass Spectrometry Market Market
Technological innovations, particularly in miniaturization and increased sensitivity, fuel market expansion. Growing demand from pharmaceutical and biotechnology sectors, driven by drug discovery and personalized medicine, is a major driver. Favorable regulatory environments that support research and development in various regions further contribute to market growth.
Challenges Impacting Mass Spectrometry Market Growth
High capital investment required for acquiring and maintaining mass spectrometers is a significant barrier. Stringent regulatory approvals can create delays in product launches, while intense competition amongst established players limits profitability. Fluctuations in raw material prices also impact the market.
Key Players Shaping the Mass Spectrometry Market Market
- Waters Corporation
- JEOL Ltd
- Hitachi Ltd
- MKS Instruments
- Danaher Corporation
- LECO Corporation
- PerkinElmer Inc
- Thermo Fisher Scientific
- Bruker Corporation
- Agilent Technologies
- Shimadzu Corporation
Significant Mass Spectrometry Market Industry Milestones
- June 2022: Shimadzu Scientific Instruments launched the LCMS-2050, a compact, high-speed, and high-sensitivity liquid chromatography quadrupole mass spectrometer. This launch expanded access to high-performance mass spectrometry.
- March 2022: Waters Corporation launched the Xevo TQ Absolute system, a highly sensitive and compact tandem mass spectrometer. This significantly improved sensitivity and reduced operational costs, boosting market adoption.
Future Outlook for Mass Spectrometry Market Market
The Mass Spectrometry market is poised for continued growth, driven by ongoing technological advancements, expanding applications, and increasing demand from diverse industries. Strategic collaborations, mergers and acquisitions, and investments in R&D will further shape market dynamics. The market presents significant opportunities for players offering innovative solutions and catering to the growing needs of various end-user segments. The development of portable and user-friendly systems will further fuel market penetration.
Mass Spectrometry Market Segmentation
-
1. Technology
-
1.1. Hybrid Mass Spectrometry
- 1.1.1. Triple Quadrupole (Tandem)
- 1.1.2. Quadrupole TOF (Q-TOF)
- 1.1.3. FTMS (Fourier Transform Mass Spectrometry)
-
1.2. Single Mass Spectrometry
- 1.2.1. ION Trap
- 1.2.2. Time-of-Flight (TOF)
- 1.3. Inductiv
-
1.1. Hybrid Mass Spectrometry
-
2. Application
- 2.1. Pharmaceuticals Industry
- 2.2. Biotechnology Industry
- 2.3. Chemical Industry
- 2.4. Other Application
Mass Spectrometry Market Segmentation By Geography
-
1. North America
- 1.1. United States
- 1.2. Canada
- 1.3. Mexico
-
2. Europe
- 2.1. Germany
- 2.2. United Kingdom
- 2.3. France
- 2.4. Italy
- 2.5. Spain
- 2.6. Rest of Europe
-
3. Asia Pacific
- 3.1. China
- 3.2. Japan
- 3.3. India
- 3.4. Australia
- 3.5. South Korea
- 3.6. Rest of Asia Pacific
-
4. Middle East and Africa
- 4.1. GCC
- 4.2. South Africa
- 4.3. Rest of Middle East and Africa
-
5. South America
- 5.1. Brazil
- 5.2. Argentina
- 5.3. Rest of South America
Mass Spectrometry Market REPORT HIGHLIGHTS
| Aspects | Details |
|---|---|
| Study Period | 2019-2033 |
| Base Year | 2024 |
| Estimated Year | 2025 |
| Forecast Period | 2025-2033 |
| Historical Period | 2019-2024 |
| Growth Rate | CAGR of 6.25% from 2019-2033 |
| Segmentation |
|
Table of Contents
- 1. Introduction
- 1.1. Research Scope
- 1.2. Market Segmentation
- 1.3. Research Methodology
- 1.4. Definitions and Assumptions
- 2. Executive Summary
- 2.1. Introduction
- 3. Market Dynamics
- 3.1. Introduction
- 3.2. Market Drivers
- 3.2.1. Technological Advancements; Growing Concerns Over Food Safety; Increasing R&D Expenditure by Private and Government Research Organizations
- 3.3. Market Restrains
- 3.3.1. High Costs of Instruments; Lack of Skilled Professionals
- 3.4. Market Trends
- 3.4.1. The Triple Quadrupole (Tandem) Segment is Expected to Hold a Significant Market Share
- 4. Market Factor Analysis
- 4.1. Porters Five Forces
- 4.2. Supply/Value Chain
- 4.3. PESTEL analysis
- 4.4. Market Entropy
- 4.5. Patent/Trademark Analysis
- 5. Global Mass Spectrometry Market Analysis, Insights and Forecast, 2019-2031
- 5.1. Market Analysis, Insights and Forecast - by Technology
- 5.1.1. Hybrid Mass Spectrometry
- 5.1.1.1. Triple Quadrupole (Tandem)
- 5.1.1.2. Quadrupole TOF (Q-TOF)
- 5.1.1.3. FTMS (Fourier Transform Mass Spectrometry)
- 5.1.2. Single Mass Spectrometry
- 5.1.2.1. ION Trap
- 5.1.2.2. Time-of-Flight (TOF)
- 5.1.3. Inductiv
- 5.1.1. Hybrid Mass Spectrometry
- 5.2. Market Analysis, Insights and Forecast - by Application
- 5.2.1. Pharmaceuticals Industry
- 5.2.2. Biotechnology Industry
- 5.2.3. Chemical Industry
- 5.2.4. Other Application
- 5.3. Market Analysis, Insights and Forecast - by Region
- 5.3.1. North America
- 5.3.2. Europe
- 5.3.3. Asia Pacific
- 5.3.4. Middle East and Africa
- 5.3.5. South America
- 5.1. Market Analysis, Insights and Forecast - by Technology
- 6. North America Mass Spectrometry Market Analysis, Insights and Forecast, 2019-2031
- 6.1. Market Analysis, Insights and Forecast - by Technology
- 6.1.1. Hybrid Mass Spectrometry
- 6.1.1.1. Triple Quadrupole (Tandem)
- 6.1.1.2. Quadrupole TOF (Q-TOF)
- 6.1.1.3. FTMS (Fourier Transform Mass Spectrometry)
- 6.1.2. Single Mass Spectrometry
- 6.1.2.1. ION Trap
- 6.1.2.2. Time-of-Flight (TOF)
- 6.1.3. Inductiv
- 6.1.1. Hybrid Mass Spectrometry
- 6.2. Market Analysis, Insights and Forecast - by Application
- 6.2.1. Pharmaceuticals Industry
- 6.2.2. Biotechnology Industry
- 6.2.3. Chemical Industry
- 6.2.4. Other Application
- 6.1. Market Analysis, Insights and Forecast - by Technology
- 7. Europe Mass Spectrometry Market Analysis, Insights and Forecast, 2019-2031
- 7.1. Market Analysis, Insights and Forecast - by Technology
- 7.1.1. Hybrid Mass Spectrometry
- 7.1.1.1. Triple Quadrupole (Tandem)
- 7.1.1.2. Quadrupole TOF (Q-TOF)
- 7.1.1.3. FTMS (Fourier Transform Mass Spectrometry)
- 7.1.2. Single Mass Spectrometry
- 7.1.2.1. ION Trap
- 7.1.2.2. Time-of-Flight (TOF)
- 7.1.3. Inductiv
- 7.1.1. Hybrid Mass Spectrometry
- 7.2. Market Analysis, Insights and Forecast - by Application
- 7.2.1. Pharmaceuticals Industry
- 7.2.2. Biotechnology Industry
- 7.2.3. Chemical Industry
- 7.2.4. Other Application
- 7.1. Market Analysis, Insights and Forecast - by Technology
- 8. Asia Pacific Mass Spectrometry Market Analysis, Insights and Forecast, 2019-2031
- 8.1. Market Analysis, Insights and Forecast - by Technology
- 8.1.1. Hybrid Mass Spectrometry
- 8.1.1.1. Triple Quadrupole (Tandem)
- 8.1.1.2. Quadrupole TOF (Q-TOF)
- 8.1.1.3. FTMS (Fourier Transform Mass Spectrometry)
- 8.1.2. Single Mass Spectrometry
- 8.1.2.1. ION Trap
- 8.1.2.2. Time-of-Flight (TOF)
- 8.1.3. Inductiv
- 8.1.1. Hybrid Mass Spectrometry
- 8.2. Market Analysis, Insights and Forecast - by Application
- 8.2.1. Pharmaceuticals Industry
- 8.2.2. Biotechnology Industry
- 8.2.3. Chemical Industry
- 8.2.4. Other Application
- 8.1. Market Analysis, Insights and Forecast - by Technology
- 9. Middle East and Africa Mass Spectrometry Market Analysis, Insights and Forecast, 2019-2031
- 9.1. Market Analysis, Insights and Forecast - by Technology
- 9.1.1. Hybrid Mass Spectrometry
- 9.1.1.1. Triple Quadrupole (Tandem)
- 9.1.1.2. Quadrupole TOF (Q-TOF)
- 9.1.1.3. FTMS (Fourier Transform Mass Spectrometry)
- 9.1.2. Single Mass Spectrometry
- 9.1.2.1. ION Trap
- 9.1.2.2. Time-of-Flight (TOF)
- 9.1.3. Inductiv
- 9.1.1. Hybrid Mass Spectrometry
- 9.2. Market Analysis, Insights and Forecast - by Application
- 9.2.1. Pharmaceuticals Industry
- 9.2.2. Biotechnology Industry
- 9.2.3. Chemical Industry
- 9.2.4. Other Application
- 9.1. Market Analysis, Insights and Forecast - by Technology
- 10. South America Mass Spectrometry Market Analysis, Insights and Forecast, 2019-2031
- 10.1. Market Analysis, Insights and Forecast - by Technology
- 10.1.1. Hybrid Mass Spectrometry
- 10.1.1.1. Triple Quadrupole (Tandem)
- 10.1.1.2. Quadrupole TOF (Q-TOF)
- 10.1.1.3. FTMS (Fourier Transform Mass Spectrometry)
- 10.1.2. Single Mass Spectrometry
- 10.1.2.1. ION Trap
- 10.1.2.2. Time-of-Flight (TOF)
- 10.1.3. Inductiv
- 10.1.1. Hybrid Mass Spectrometry
- 10.2. Market Analysis, Insights and Forecast - by Application
- 10.2.1. Pharmaceuticals Industry
- 10.2.2. Biotechnology Industry
- 10.2.3. Chemical Industry
- 10.2.4. Other Application
- 10.1. Market Analysis, Insights and Forecast - by Technology
- 11. North America Mass Spectrometry Market Analysis, Insights and Forecast, 2019-2031
- 11.1. Market Analysis, Insights and Forecast - By Country/Sub-region
- 11.1.1 United States
- 11.1.2 Canada
- 11.1.3 Mexico
- 12. Europe Mass Spectrometry Market Analysis, Insights and Forecast, 2019-2031
- 12.1. Market Analysis, Insights and Forecast - By Country/Sub-region
- 12.1.1 Germany
- 12.1.2 United Kingdom
- 12.1.3 France
- 12.1.4 Italy
- 12.1.5 Spain
- 12.1.6 Rest of Europe
- 13. Asia Pacific Mass Spectrometry Market Analysis, Insights and Forecast, 2019-2031
- 13.1. Market Analysis, Insights and Forecast - By Country/Sub-region
- 13.1.1 China
- 13.1.2 Japan
- 13.1.3 India
- 13.1.4 Australia
- 13.1.5 South Korea
- 13.1.6 Rest of Asia Pacific
- 14. Middle East and Africa Mass Spectrometry Market Analysis, Insights and Forecast, 2019-2031
- 14.1. Market Analysis, Insights and Forecast - By Country/Sub-region
- 14.1.1 GCC
- 14.1.2 South Africa
- 14.1.3 Rest of Middle East and Africa
- 15. South America Mass Spectrometry Market Analysis, Insights and Forecast, 2019-2031
- 15.1. Market Analysis, Insights and Forecast - By Country/Sub-region
- 15.1.1 Brazil
- 15.1.2 Argentina
- 15.1.3 Rest of South America
- 16. Competitive Analysis
- 16.1. Global Market Share Analysis 2024
- 16.2. Company Profiles
- 16.2.1 Waters Corporation
- 16.2.1.1. Overview
- 16.2.1.2. Products
- 16.2.1.3. SWOT Analysis
- 16.2.1.4. Recent Developments
- 16.2.1.5. Financials (Based on Availability)
- 16.2.2 JEOL Ltd
- 16.2.2.1. Overview
- 16.2.2.2. Products
- 16.2.2.3. SWOT Analysis
- 16.2.2.4. Recent Developments
- 16.2.2.5. Financials (Based on Availability)
- 16.2.3 Hitachi Ltd
- 16.2.3.1. Overview
- 16.2.3.2. Products
- 16.2.3.3. SWOT Analysis
- 16.2.3.4. Recent Developments
- 16.2.3.5. Financials (Based on Availability)
- 16.2.4 MKS Instruments
- 16.2.4.1. Overview
- 16.2.4.2. Products
- 16.2.4.3. SWOT Analysis
- 16.2.4.4. Recent Developments
- 16.2.4.5. Financials (Based on Availability)
- 16.2.5 Danaher Corporation
- 16.2.5.1. Overview
- 16.2.5.2. Products
- 16.2.5.3. SWOT Analysis
- 16.2.5.4. Recent Developments
- 16.2.5.5. Financials (Based on Availability)
- 16.2.6 LECO Corporation
- 16.2.6.1. Overview
- 16.2.6.2. Products
- 16.2.6.3. SWOT Analysis
- 16.2.6.4. Recent Developments
- 16.2.6.5. Financials (Based on Availability)
- 16.2.7 PerkinElmer Inc
- 16.2.7.1. Overview
- 16.2.7.2. Products
- 16.2.7.3. SWOT Analysis
- 16.2.7.4. Recent Developments
- 16.2.7.5. Financials (Based on Availability)
- 16.2.8 Thermo Fisher Scientific
- 16.2.8.1. Overview
- 16.2.8.2. Products
- 16.2.8.3. SWOT Analysis
- 16.2.8.4. Recent Developments
- 16.2.8.5. Financials (Based on Availability)
- 16.2.9 Bruker Corporation
- 16.2.9.1. Overview
- 16.2.9.2. Products
- 16.2.9.3. SWOT Analysis
- 16.2.9.4. Recent Developments
- 16.2.9.5. Financials (Based on Availability)
- 16.2.10 Agilent Technologies
- 16.2.10.1. Overview
- 16.2.10.2. Products
- 16.2.10.3. SWOT Analysis
- 16.2.10.4. Recent Developments
- 16.2.10.5. Financials (Based on Availability)
- 16.2.11 Shimadzu Corporation
- 16.2.11.1. Overview
- 16.2.11.2. Products
- 16.2.11.3. SWOT Analysis
- 16.2.11.4. Recent Developments
- 16.2.11.5. Financials (Based on Availability)
- 16.2.1 Waters Corporation
List of Figures
- Figure 1: Global Mass Spectrometry Market Revenue Breakdown (Million, %) by Region 2024 & 2032
- Figure 2: Global Mass Spectrometry Market Volume Breakdown (K Unit, %) by Region 2024 & 2032
- Figure 3: North America Mass Spectrometry Market Revenue (Million), by Country 2024 & 2032
- Figure 4: North America Mass Spectrometry Market Volume (K Unit), by Country 2024 & 2032
- Figure 5: North America Mass Spectrometry Market Revenue Share (%), by Country 2024 & 2032
- Figure 6: North America Mass Spectrometry Market Volume Share (%), by Country 2024 & 2032
- Figure 7: Europe Mass Spectrometry Market Revenue (Million), by Country 2024 & 2032
- Figure 8: Europe Mass Spectrometry Market Volume (K Unit), by Country 2024 & 2032
- Figure 9: Europe Mass Spectrometry Market Revenue Share (%), by Country 2024 & 2032
- Figure 10: Europe Mass Spectrometry Market Volume Share (%), by Country 2024 & 2032
- Figure 11: Asia Pacific Mass Spectrometry Market Revenue (Million), by Country 2024 & 2032
- Figure 12: Asia Pacific Mass Spectrometry Market Volume (K Unit), by Country 2024 & 2032
- Figure 13: Asia Pacific Mass Spectrometry Market Revenue Share (%), by Country 2024 & 2032
- Figure 14: Asia Pacific Mass Spectrometry Market Volume Share (%), by Country 2024 & 2032
- Figure 15: Middle East and Africa Mass Spectrometry Market Revenue (Million), by Country 2024 & 2032
- Figure 16: Middle East and Africa Mass Spectrometry Market Volume (K Unit), by Country 2024 & 2032
- Figure 17: Middle East and Africa Mass Spectrometry Market Revenue Share (%), by Country 2024 & 2032
- Figure 18: Middle East and Africa Mass Spectrometry Market Volume Share (%), by Country 2024 & 2032
- Figure 19: South America Mass Spectrometry Market Revenue (Million), by Country 2024 & 2032
- Figure 20: South America Mass Spectrometry Market Volume (K Unit), by Country 2024 & 2032
- Figure 21: South America Mass Spectrometry Market Revenue Share (%), by Country 2024 & 2032
- Figure 22: South America Mass Spectrometry Market Volume Share (%), by Country 2024 & 2032
- Figure 23: North America Mass Spectrometry Market Revenue (Million), by Technology 2024 & 2032
- Figure 24: North America Mass Spectrometry Market Volume (K Unit), by Technology 2024 & 2032
- Figure 25: North America Mass Spectrometry Market Revenue Share (%), by Technology 2024 & 2032
- Figure 26: North America Mass Spectrometry Market Volume Share (%), by Technology 2024 & 2032
- Figure 27: North America Mass Spectrometry Market Revenue (Million), by Application 2024 & 2032
- Figure 28: North America Mass Spectrometry Market Volume (K Unit), by Application 2024 & 2032
- Figure 29: North America Mass Spectrometry Market Revenue Share (%), by Application 2024 & 2032
- Figure 30: North America Mass Spectrometry Market Volume Share (%), by Application 2024 & 2032
- Figure 31: North America Mass Spectrometry Market Revenue (Million), by Country 2024 & 2032
- Figure 32: North America Mass Spectrometry Market Volume (K Unit), by Country 2024 & 2032
- Figure 33: North America Mass Spectrometry Market Revenue Share (%), by Country 2024 & 2032
- Figure 34: North America Mass Spectrometry Market Volume Share (%), by Country 2024 & 2032
- Figure 35: Europe Mass Spectrometry Market Revenue (Million), by Technology 2024 & 2032
- Figure 36: Europe Mass Spectrometry Market Volume (K Unit), by Technology 2024 & 2032
- Figure 37: Europe Mass Spectrometry Market Revenue Share (%), by Technology 2024 & 2032
- Figure 38: Europe Mass Spectrometry Market Volume Share (%), by Technology 2024 & 2032
- Figure 39: Europe Mass Spectrometry Market Revenue (Million), by Application 2024 & 2032
- Figure 40: Europe Mass Spectrometry Market Volume (K Unit), by Application 2024 & 2032
- Figure 41: Europe Mass Spectrometry Market Revenue Share (%), by Application 2024 & 2032
- Figure 42: Europe Mass Spectrometry Market Volume Share (%), by Application 2024 & 2032
- Figure 43: Europe Mass Spectrometry Market Revenue (Million), by Country 2024 & 2032
- Figure 44: Europe Mass Spectrometry Market Volume (K Unit), by Country 2024 & 2032
- Figure 45: Europe Mass Spectrometry Market Revenue Share (%), by Country 2024 & 2032
- Figure 46: Europe Mass Spectrometry Market Volume Share (%), by Country 2024 & 2032
- Figure 47: Asia Pacific Mass Spectrometry Market Revenue (Million), by Technology 2024 & 2032
- Figure 48: Asia Pacific Mass Spectrometry Market Volume (K Unit), by Technology 2024 & 2032
- Figure 49: Asia Pacific Mass Spectrometry Market Revenue Share (%), by Technology 2024 & 2032
- Figure 50: Asia Pacific Mass Spectrometry Market Volume Share (%), by Technology 2024 & 2032
- Figure 51: Asia Pacific Mass Spectrometry Market Revenue (Million), by Application 2024 & 2032
- Figure 52: Asia Pacific Mass Spectrometry Market Volume (K Unit), by Application 2024 & 2032
- Figure 53: Asia Pacific Mass Spectrometry Market Revenue Share (%), by Application 2024 & 2032
- Figure 54: Asia Pacific Mass Spectrometry Market Volume Share (%), by Application 2024 & 2032
- Figure 55: Asia Pacific Mass Spectrometry Market Revenue (Million), by Country 2024 & 2032
- Figure 56: Asia Pacific Mass Spectrometry Market Volume (K Unit), by Country 2024 & 2032
- Figure 57: Asia Pacific Mass Spectrometry Market Revenue Share (%), by Country 2024 & 2032
- Figure 58: Asia Pacific Mass Spectrometry Market Volume Share (%), by Country 2024 & 2032
- Figure 59: Middle East and Africa Mass Spectrometry Market Revenue (Million), by Technology 2024 & 2032
- Figure 60: Middle East and Africa Mass Spectrometry Market Volume (K Unit), by Technology 2024 & 2032
- Figure 61: Middle East and Africa Mass Spectrometry Market Revenue Share (%), by Technology 2024 & 2032
- Figure 62: Middle East and Africa Mass Spectrometry Market Volume Share (%), by Technology 2024 & 2032
- Figure 63: Middle East and Africa Mass Spectrometry Market Revenue (Million), by Application 2024 & 2032
- Figure 64: Middle East and Africa Mass Spectrometry Market Volume (K Unit), by Application 2024 & 2032
- Figure 65: Middle East and Africa Mass Spectrometry Market Revenue Share (%), by Application 2024 & 2032
- Figure 66: Middle East and Africa Mass Spectrometry Market Volume Share (%), by Application 2024 & 2032
- Figure 67: Middle East and Africa Mass Spectrometry Market Revenue (Million), by Country 2024 & 2032
- Figure 68: Middle East and Africa Mass Spectrometry Market Volume (K Unit), by Country 2024 & 2032
- Figure 69: Middle East and Africa Mass Spectrometry Market Revenue Share (%), by Country 2024 & 2032
- Figure 70: Middle East and Africa Mass Spectrometry Market Volume Share (%), by Country 2024 & 2032
- Figure 71: South America Mass Spectrometry Market Revenue (Million), by Technology 2024 & 2032
- Figure 72: South America Mass Spectrometry Market Volume (K Unit), by Technology 2024 & 2032
- Figure 73: South America Mass Spectrometry Market Revenue Share (%), by Technology 2024 & 2032
- Figure 74: South America Mass Spectrometry Market Volume Share (%), by Technology 2024 & 2032
- Figure 75: South America Mass Spectrometry Market Revenue (Million), by Application 2024 & 2032
- Figure 76: South America Mass Spectrometry Market Volume (K Unit), by Application 2024 & 2032
- Figure 77: South America Mass Spectrometry Market Revenue Share (%), by Application 2024 & 2032
- Figure 78: South America Mass Spectrometry Market Volume Share (%), by Application 2024 & 2032
- Figure 79: South America Mass Spectrometry Market Revenue (Million), by Country 2024 & 2032
- Figure 80: South America Mass Spectrometry Market Volume (K Unit), by Country 2024 & 2032
- Figure 81: South America Mass Spectrometry Market Revenue Share (%), by Country 2024 & 2032
- Figure 82: South America Mass Spectrometry Market Volume Share (%), by Country 2024 & 2032
List of Tables
- Table 1: Global Mass Spectrometry Market Revenue Million Forecast, by Region 2019 & 2032
- Table 2: Global Mass Spectrometry Market Volume K Unit Forecast, by Region 2019 & 2032
- Table 3: Global Mass Spectrometry Market Revenue Million Forecast, by Technology 2019 & 2032
- Table 4: Global Mass Spectrometry Market Volume K Unit Forecast, by Technology 2019 & 2032
- Table 5: Global Mass Spectrometry Market Revenue Million Forecast, by Application 2019 & 2032
- Table 6: Global Mass Spectrometry Market Volume K Unit Forecast, by Application 2019 & 2032
- Table 7: Global Mass Spectrometry Market Revenue Million Forecast, by Region 2019 & 2032
- Table 8: Global Mass Spectrometry Market Volume K Unit Forecast, by Region 2019 & 2032
- Table 9: Global Mass Spectrometry Market Revenue Million Forecast, by Country 2019 & 2032
- Table 10: Global Mass Spectrometry Market Volume K Unit Forecast, by Country 2019 & 2032
- Table 11: United States Mass Spectrometry Market Revenue (Million) Forecast, by Application 2019 & 2032
- Table 12: United States Mass Spectrometry Market Volume (K Unit) Forecast, by Application 2019 & 2032
- Table 13: Canada Mass Spectrometry Market Revenue (Million) Forecast, by Application 2019 & 2032
- Table 14: Canada Mass Spectrometry Market Volume (K Unit) Forecast, by Application 2019 & 2032
- Table 15: Mexico Mass Spectrometry Market Revenue (Million) Forecast, by Application 2019 & 2032
- Table 16: Mexico Mass Spectrometry Market Volume (K Unit) Forecast, by Application 2019 & 2032
- Table 17: Global Mass Spectrometry Market Revenue Million Forecast, by Country 2019 & 2032
- Table 18: Global Mass Spectrometry Market Volume K Unit Forecast, by Country 2019 & 2032
- Table 19: Germany Mass Spectrometry Market Revenue (Million) Forecast, by Application 2019 & 2032
- Table 20: Germany Mass Spectrometry Market Volume (K Unit) Forecast, by Application 2019 & 2032
- Table 21: United Kingdom Mass Spectrometry Market Revenue (Million) Forecast, by Application 2019 & 2032
- Table 22: United Kingdom Mass Spectrometry Market Volume (K Unit) Forecast, by Application 2019 & 2032
- Table 23: France Mass Spectrometry Market Revenue (Million) Forecast, by Application 2019 & 2032
- Table 24: France Mass Spectrometry Market Volume (K Unit) Forecast, by Application 2019 & 2032
- Table 25: Italy Mass Spectrometry Market Revenue (Million) Forecast, by Application 2019 & 2032
- Table 26: Italy Mass Spectrometry Market Volume (K Unit) Forecast, by Application 2019 & 2032
- Table 27: Spain Mass Spectrometry Market Revenue (Million) Forecast, by Application 2019 & 2032
- Table 28: Spain Mass Spectrometry Market Volume (K Unit) Forecast, by Application 2019 & 2032
- Table 29: Rest of Europe Mass Spectrometry Market Revenue (Million) Forecast, by Application 2019 & 2032
- Table 30: Rest of Europe Mass Spectrometry Market Volume (K Unit) Forecast, by Application 2019 & 2032
- Table 31: Global Mass Spectrometry Market Revenue Million Forecast, by Country 2019 & 2032
- Table 32: Global Mass Spectrometry Market Volume K Unit Forecast, by Country 2019 & 2032
- Table 33: China Mass Spectrometry Market Revenue (Million) Forecast, by Application 2019 & 2032
- Table 34: China Mass Spectrometry Market Volume (K Unit) Forecast, by Application 2019 & 2032
- Table 35: Japan Mass Spectrometry Market Revenue (Million) Forecast, by Application 2019 & 2032
- Table 36: Japan Mass Spectrometry Market Volume (K Unit) Forecast, by Application 2019 & 2032
- Table 37: India Mass Spectrometry Market Revenue (Million) Forecast, by Application 2019 & 2032
- Table 38: India Mass Spectrometry Market Volume (K Unit) Forecast, by Application 2019 & 2032
- Table 39: Australia Mass Spectrometry Market Revenue (Million) Forecast, by Application 2019 & 2032
- Table 40: Australia Mass Spectrometry Market Volume (K Unit) Forecast, by Application 2019 & 2032
- Table 41: South Korea Mass Spectrometry Market Revenue (Million) Forecast, by Application 2019 & 2032
- Table 42: South Korea Mass Spectrometry Market Volume (K Unit) Forecast, by Application 2019 & 2032
- Table 43: Rest of Asia Pacific Mass Spectrometry Market Revenue (Million) Forecast, by Application 2019 & 2032
- Table 44: Rest of Asia Pacific Mass Spectrometry Market Volume (K Unit) Forecast, by Application 2019 & 2032
- Table 45: Global Mass Spectrometry Market Revenue Million Forecast, by Country 2019 & 2032
- Table 46: Global Mass Spectrometry Market Volume K Unit Forecast, by Country 2019 & 2032
- Table 47: GCC Mass Spectrometry Market Revenue (Million) Forecast, by Application 2019 & 2032
- Table 48: GCC Mass Spectrometry Market Volume (K Unit) Forecast, by Application 2019 & 2032
- Table 49: South Africa Mass Spectrometry Market Revenue (Million) Forecast, by Application 2019 & 2032
- Table 50: South Africa Mass Spectrometry Market Volume (K Unit) Forecast, by Application 2019 & 2032
- Table 51: Rest of Middle East and Africa Mass Spectrometry Market Revenue (Million) Forecast, by Application 2019 & 2032
- Table 52: Rest of Middle East and Africa Mass Spectrometry Market Volume (K Unit) Forecast, by Application 2019 & 2032
- Table 53: Global Mass Spectrometry Market Revenue Million Forecast, by Country 2019 & 2032
- Table 54: Global Mass Spectrometry Market Volume K Unit Forecast, by Country 2019 & 2032
- Table 55: Brazil Mass Spectrometry Market Revenue (Million) Forecast, by Application 2019 & 2032
- Table 56: Brazil Mass Spectrometry Market Volume (K Unit) Forecast, by Application 2019 & 2032
- Table 57: Argentina Mass Spectrometry Market Revenue (Million) Forecast, by Application 2019 & 2032
- Table 58: Argentina Mass Spectrometry Market Volume (K Unit) Forecast, by Application 2019 & 2032
- Table 59: Rest of South America Mass Spectrometry Market Revenue (Million) Forecast, by Application 2019 & 2032
- Table 60: Rest of South America Mass Spectrometry Market Volume (K Unit) Forecast, by Application 2019 & 2032
- Table 61: Global Mass Spectrometry Market Revenue Million Forecast, by Technology 2019 & 2032
- Table 62: Global Mass Spectrometry Market Volume K Unit Forecast, by Technology 2019 & 2032
- Table 63: Global Mass Spectrometry Market Revenue Million Forecast, by Application 2019 & 2032
- Table 64: Global Mass Spectrometry Market Volume K Unit Forecast, by Application 2019 & 2032
- Table 65: Global Mass Spectrometry Market Revenue Million Forecast, by Country 2019 & 2032
- Table 66: Global Mass Spectrometry Market Volume K Unit Forecast, by Country 2019 & 2032
- Table 67: United States Mass Spectrometry Market Revenue (Million) Forecast, by Application 2019 & 2032
- Table 68: United States Mass Spectrometry Market Volume (K Unit) Forecast, by Application 2019 & 2032
- Table 69: Canada Mass Spectrometry Market Revenue (Million) Forecast, by Application 2019 & 2032
- Table 70: Canada Mass Spectrometry Market Volume (K Unit) Forecast, by Application 2019 & 2032
- Table 71: Mexico Mass Spectrometry Market Revenue (Million) Forecast, by Application 2019 & 2032
- Table 72: Mexico Mass Spectrometry Market Volume (K Unit) Forecast, by Application 2019 & 2032
- Table 73: Global Mass Spectrometry Market Revenue Million Forecast, by Technology 2019 & 2032
- Table 74: Global Mass Spectrometry Market Volume K Unit Forecast, by Technology 2019 & 2032
- Table 75: Global Mass Spectrometry Market Revenue Million Forecast, by Application 2019 & 2032
- Table 76: Global Mass Spectrometry Market Volume K Unit Forecast, by Application 2019 & 2032
- Table 77: Global Mass Spectrometry Market Revenue Million Forecast, by Country 2019 & 2032
- Table 78: Global Mass Spectrometry Market Volume K Unit Forecast, by Country 2019 & 2032
- Table 79: Germany Mass Spectrometry Market Revenue (Million) Forecast, by Application 2019 & 2032
- Table 80: Germany Mass Spectrometry Market Volume (K Unit) Forecast, by Application 2019 & 2032
- Table 81: United Kingdom Mass Spectrometry Market Revenue (Million) Forecast, by Application 2019 & 2032
- Table 82: United Kingdom Mass Spectrometry Market Volume (K Unit) Forecast, by Application 2019 & 2032
- Table 83: France Mass Spectrometry Market Revenue (Million) Forecast, by Application 2019 & 2032
- Table 84: France Mass Spectrometry Market Volume (K Unit) Forecast, by Application 2019 & 2032
- Table 85: Italy Mass Spectrometry Market Revenue (Million) Forecast, by Application 2019 & 2032
- Table 86: Italy Mass Spectrometry Market Volume (K Unit) Forecast, by Application 2019 & 2032
- Table 87: Spain Mass Spectrometry Market Revenue (Million) Forecast, by Application 2019 & 2032
- Table 88: Spain Mass Spectrometry Market Volume (K Unit) Forecast, by Application 2019 & 2032
- Table 89: Rest of Europe Mass Spectrometry Market Revenue (Million) Forecast, by Application 2019 & 2032
- Table 90: Rest of Europe Mass Spectrometry Market Volume (K Unit) Forecast, by Application 2019 & 2032
- Table 91: Global Mass Spectrometry Market Revenue Million Forecast, by Technology 2019 & 2032
- Table 92: Global Mass Spectrometry Market Volume K Unit Forecast, by Technology 2019 & 2032
- Table 93: Global Mass Spectrometry Market Revenue Million Forecast, by Application 2019 & 2032
- Table 94: Global Mass Spectrometry Market Volume K Unit Forecast, by Application 2019 & 2032
- Table 95: Global Mass Spectrometry Market Revenue Million Forecast, by Country 2019 & 2032
- Table 96: Global Mass Spectrometry Market Volume K Unit Forecast, by Country 2019 & 2032
- Table 97: China Mass Spectrometry Market Revenue (Million) Forecast, by Application 2019 & 2032
- Table 98: China Mass Spectrometry Market Volume (K Unit) Forecast, by Application 2019 & 2032
- Table 99: Japan Mass Spectrometry Market Revenue (Million) Forecast, by Application 2019 & 2032
- Table 100: Japan Mass Spectrometry Market Volume (K Unit) Forecast, by Application 2019 & 2032
- Table 101: India Mass Spectrometry Market Revenue (Million) Forecast, by Application 2019 & 2032
- Table 102: India Mass Spectrometry Market Volume (K Unit) Forecast, by Application 2019 & 2032
- Table 103: Australia Mass Spectrometry Market Revenue (Million) Forecast, by Application 2019 & 2032
- Table 104: Australia Mass Spectrometry Market Volume (K Unit) Forecast, by Application 2019 & 2032
- Table 105: South Korea Mass Spectrometry Market Revenue (Million) Forecast, by Application 2019 & 2032
- Table 106: South Korea Mass Spectrometry Market Volume (K Unit) Forecast, by Application 2019 & 2032
- Table 107: Rest of Asia Pacific Mass Spectrometry Market Revenue (Million) Forecast, by Application 2019 & 2032
- Table 108: Rest of Asia Pacific Mass Spectrometry Market Volume (K Unit) Forecast, by Application 2019 & 2032
- Table 109: Global Mass Spectrometry Market Revenue Million Forecast, by Technology 2019 & 2032
- Table 110: Global Mass Spectrometry Market Volume K Unit Forecast, by Technology 2019 & 2032
- Table 111: Global Mass Spectrometry Market Revenue Million Forecast, by Application 2019 & 2032
- Table 112: Global Mass Spectrometry Market Volume K Unit Forecast, by Application 2019 & 2032
- Table 113: Global Mass Spectrometry Market Revenue Million Forecast, by Country 2019 & 2032
- Table 114: Global Mass Spectrometry Market Volume K Unit Forecast, by Country 2019 & 2032
- Table 115: GCC Mass Spectrometry Market Revenue (Million) Forecast, by Application 2019 & 2032
- Table 116: GCC Mass Spectrometry Market Volume (K Unit) Forecast, by Application 2019 & 2032
- Table 117: South Africa Mass Spectrometry Market Revenue (Million) Forecast, by Application 2019 & 2032
- Table 118: South Africa Mass Spectrometry Market Volume (K Unit) Forecast, by Application 2019 & 2032
- Table 119: Rest of Middle East and Africa Mass Spectrometry Market Revenue (Million) Forecast, by Application 2019 & 2032
- Table 120: Rest of Middle East and Africa Mass Spectrometry Market Volume (K Unit) Forecast, by Application 2019 & 2032
- Table 121: Global Mass Spectrometry Market Revenue Million Forecast, by Technology 2019 & 2032
- Table 122: Global Mass Spectrometry Market Volume K Unit Forecast, by Technology 2019 & 2032
- Table 123: Global Mass Spectrometry Market Revenue Million Forecast, by Application 2019 & 2032
- Table 124: Global Mass Spectrometry Market Volume K Unit Forecast, by Application 2019 & 2032
- Table 125: Global Mass Spectrometry Market Revenue Million Forecast, by Country 2019 & 2032
- Table 126: Global Mass Spectrometry Market Volume K Unit Forecast, by Country 2019 & 2032
- Table 127: Brazil Mass Spectrometry Market Revenue (Million) Forecast, by Application 2019 & 2032
- Table 128: Brazil Mass Spectrometry Market Volume (K Unit) Forecast, by Application 2019 & 2032
- Table 129: Argentina Mass Spectrometry Market Revenue (Million) Forecast, by Application 2019 & 2032
- Table 130: Argentina Mass Spectrometry Market Volume (K Unit) Forecast, by Application 2019 & 2032
- Table 131: Rest of South America Mass Spectrometry Market Revenue (Million) Forecast, by Application 2019 & 2032
- Table 132: Rest of South America Mass Spectrometry Market Volume (K Unit) Forecast, by Application 2019 & 2032
Frequently Asked Questions
1. What is the projected Compound Annual Growth Rate (CAGR) of the Mass Spectrometry Market?
The projected CAGR is approximately 6.25%.
2. Which companies are prominent players in the Mass Spectrometry Market?
Key companies in the market include Waters Corporation, JEOL Ltd, Hitachi Ltd, MKS Instruments, Danaher Corporation, LECO Corporation, PerkinElmer Inc, Thermo Fisher Scientific, Bruker Corporation, Agilent Technologies, Shimadzu Corporation.
3. What are the main segments of the Mass Spectrometry Market?
The market segments include Technology, Application.
4. Can you provide details about the market size?
The market size is estimated to be USD 6.77 Million as of 2022.
5. What are some drivers contributing to market growth?
Technological Advancements; Growing Concerns Over Food Safety; Increasing R&D Expenditure by Private and Government Research Organizations.
6. What are the notable trends driving market growth?
The Triple Quadrupole (Tandem) Segment is Expected to Hold a Significant Market Share.
7. Are there any restraints impacting market growth?
High Costs of Instruments; Lack of Skilled Professionals.
8. Can you provide examples of recent developments in the market?
In June 2022, Shimadzu Scientific Instruments launched the LCMS-2050 liquid chromatography quadrupole mass spectrometer that features a significantly reduced size, while providing high-speed and high-sensitivity analysis.
9. What pricing options are available for accessing the report?
Pricing options include single-user, multi-user, and enterprise licenses priced at USD 4750, USD 5250, and USD 8750 respectively.
10. Is the market size provided in terms of value or volume?
The market size is provided in terms of value, measured in Million and volume, measured in K Unit.
11. Are there any specific market keywords associated with the report?
Yes, the market keyword associated with the report is "Mass Spectrometry Market," which aids in identifying and referencing the specific market segment covered.
12. How do I determine which pricing option suits my needs best?
The pricing options vary based on user requirements and access needs. Individual users may opt for single-user licenses, while businesses requiring broader access may choose multi-user or enterprise licenses for cost-effective access to the report.
13. Are there any additional resources or data provided in the Mass Spectrometry Market report?
While the report offers comprehensive insights, it's advisable to review the specific contents or supplementary materials provided to ascertain if additional resources or data are available.
14. How can I stay updated on further developments or reports in the Mass Spectrometry Market?
To stay informed about further developments, trends, and reports in the Mass Spectrometry Market, consider subscribing to industry newsletters, following relevant companies and organizations, or regularly checking reputable industry news sources and publications.
Methodology
Step 1 - Identification of Relevant Samples Size from Population Database


Step 2 - Approaches for Defining Global Market Size (Value, Volume* & Price*)

Note*: In applicable scenarios
Step 3 - Data Sources
Primary Research
- Web Analytics
- Survey Reports
- Research Institute
- Latest Research Reports
- Opinion Leaders
Secondary Research
- Annual Reports
- White Paper
- Latest Press Release
- Industry Association
- Paid Database
- Investor Presentations

Step 4 - Data Triangulation
Involves using different sources of information in order to increase the validity of a study
These sources are likely to be stakeholders in a program - participants, other researchers, program staff, other community members, and so on.
Then we put all data in single framework & apply various statistical tools to find out the dynamic on the market.
During the analysis stage, feedback from the stakeholder groups would be compared to determine areas of agreement as well as areas of divergence
