

Key Insights
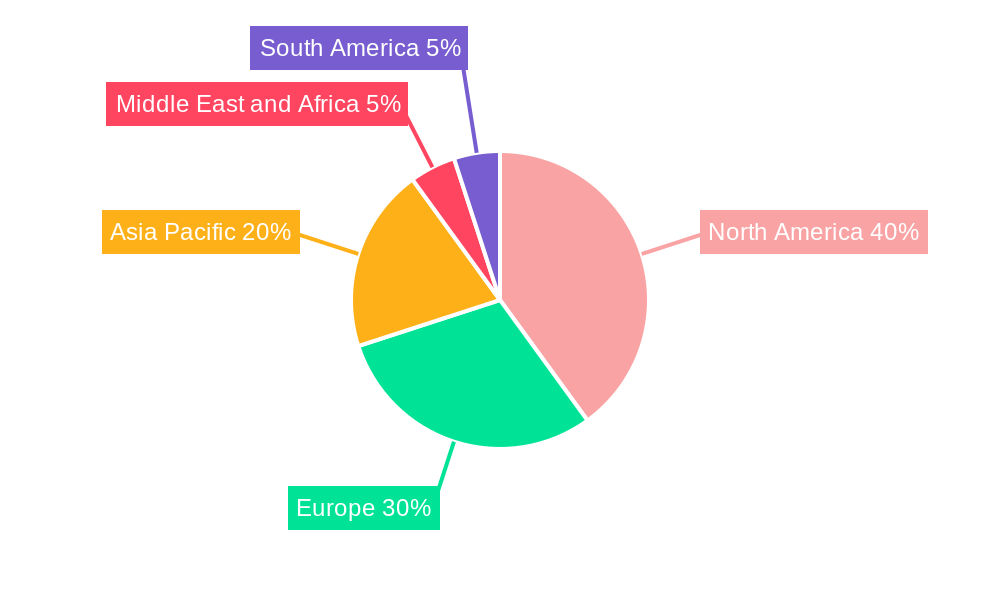
The global medical dynamometer market, valued at $501.02 million in 2025, is projected to experience robust growth, driven by a compound annual growth rate (CAGR) of 6.54% from 2025 to 2033. This expansion is fueled by several key factors. The rising prevalence of musculoskeletal disorders, neurological conditions, and cardiovascular diseases necessitates accurate and reliable muscle strength assessment, increasing demand for dynamometers in hospitals, rehabilitation centers, and other healthcare settings. Technological advancements leading to the development of more sophisticated, portable, and user-friendly devices are further boosting market growth. Moreover, the growing emphasis on preventative healthcare and personalized medicine is driving adoption of dynamometers for early diagnosis and effective treatment planning. The market is segmented by usage (hospitals/clinics, rehabilitation centers, others), product type (chest, hand, push-pull, squeeze dynamometers, and other devices), and application (orthopedic, neurology, cardiology, medical trauma, and others). North America currently holds a significant market share due to advanced healthcare infrastructure and high adoption rates. However, Asia-Pacific is anticipated to witness substantial growth in the coming years due to rising healthcare expenditure and increasing awareness about the benefits of early disease detection and management.
Competition in the medical dynamometer market is relatively fragmented, with key players such as North Coast Medical, KERN and SOHN GmbH, Marsden Weighing Group, JTECH Medical Industries Inc, Biodex Medical Systems Inc, and Lafayette Instrument actively engaged in product innovation and market expansion. The market faces certain restraints, including the high initial cost of advanced dynamometers and the availability of alternative diagnostic methods. However, the long-term benefits of accurate muscle strength assessment, coupled with ongoing technological improvements and the increasing prevalence of chronic diseases, are expected to overcome these challenges, ensuring sustained market growth throughout the forecast period. The continued focus on improving patient outcomes and the rising demand for effective rehabilitation therapies will further fuel the adoption of medical dynamometers globally.
Medical Dynamometer Market: A Comprehensive Report (2019-2033)
This dynamic report provides an in-depth analysis of the global Medical Dynamometer Market, offering invaluable insights for stakeholders across the healthcare industry. Leveraging extensive market research and data analysis spanning the period 2019-2033 (historical period: 2019-2024, base year: 2025, estimated year: 2025, forecast period: 2025-2033), this report dissects market trends, competitive landscapes, and future growth potential. The report utilizes high-impact keywords like "hand dynamometer," "chest dynamometer," "rehabilitation centers," and "orthopedic applications" to ensure optimal search engine visibility. The total market size is projected to reach xx Million by 2033, exhibiting a CAGR of xx% during the forecast period.

Medical Dynamometer Market Market Structure & Competitive Landscape
The Medical Dynamometer Market exhibits a moderately concentrated structure, with a Herfindahl-Hirschman Index (HHI) estimated at xx in 2025. Key players, including North Coast Medical, KERN and SOHN GmbH, Marsden Weighing Group, JTECH Medical Industries Inc, Biodex Medical Systems Inc, Lafayette Instrument, Fabrication Enterprises, and Charder Electronic Co Ltd, compete primarily on product features, pricing, and distribution networks. The market is driven by continuous innovation in sensor technology, miniaturization, and wireless connectivity. Regulatory approvals (e.g., FDA clearances) significantly impact market entry and product adoption. Substitutes for medical dynamometers are limited, mainly involving manual strength assessments which are less precise and objective.
- Market Concentration: HHI of xx in 2025 indicates moderate concentration.
- Innovation Drivers: Advancements in sensor technology, wireless connectivity, and data analytics.
- Regulatory Impacts: FDA clearances and other regional regulatory approvals shape market access.
- Product Substitutes: Limited substitutes, primarily manual assessments, offering lower accuracy.
- End-User Segmentation: Hospitals/clinics, rehabilitation centers, and research institutions.
- M&A Trends: xx Mergers and acquisitions occurred between 2019 and 2024, primarily focused on expanding product portfolios and geographical reach.
Medical Dynamometer Market Market Trends & Opportunities
The Medical Dynamometer Market is experiencing robust growth, driven by increasing prevalence of musculoskeletal disorders, expanding geriatric population, rising demand for precise diagnostic tools, and growing adoption of rehabilitation therapies. Technological advancements, including the integration of digital technologies and AI-powered diagnostics, are creating opportunities for improved accuracy and personalized treatment plans. Consumer preference shifts towards user-friendly, portable, and wireless devices further propel market expansion. Competitive dynamics involve strategic partnerships, product diversification, and global market expansion initiatives by leading players. The market penetration rate for digital dynamometers is estimated at xx% in 2025, expected to increase to xx% by 2033.

Dominant Markets & Segments in Medical Dynamometer Market
The North American region holds the largest market share, followed by Europe. Within the segments:
- By Usage: Hospitals/clinics dominate, driven by higher volumes of patient assessments and established healthcare infrastructure. Rehabilitation centers demonstrate significant growth potential due to increased focus on functional rehabilitation programs.
- By Product: Hand dynamometers maintain the highest market share due to their wide application across various medical specialties. However, the demand for specialized devices like chest dynamometers and push-pull dynamometers is steadily growing.
- By Application: Orthopedic applications continue to lead due to the high prevalence of musculoskeletal disorders and injuries requiring muscle strength assessment. Neurological and cardiology applications are also showing significant growth, reflecting the evolving diagnostic needs in these fields.
Key Growth Drivers:
- Developed Healthcare Infrastructure: In North America and Europe.
- Rising Prevalence of Chronic Diseases: Leading to increased demand for diagnostic and therapeutic tools.
- Government Initiatives Promoting Rehabilitation: Funding research and development and wider access to treatment.
Medical Dynamometer Market Product Analysis
Recent innovations in medical dynamometers include advanced sensor technology, improved data accuracy, wireless connectivity, and user-friendly interfaces. The integration of AI and machine learning algorithms enables more precise strength assessments and personalized rehabilitation programs. These advancements provide competitive advantages by enhancing diagnostic accuracy, streamlining workflows, and improving patient outcomes. Market fit is driven by the need for accurate, reliable, and efficient muscle strength assessment across various medical specialties.
Key Drivers, Barriers & Challenges in Medical Dynamometer Market
Key Drivers:
The rising prevalence of chronic diseases, increasing geriatric population, and technological advancements driving the demand for advanced diagnostic tools are key drivers. Government initiatives and increased healthcare spending further contribute to market growth.
Challenges and Restraints:
High initial investment costs for advanced dynamometers and stringent regulatory approvals can hinder market penetration. Competition from established players and the emergence of new entrants poses challenges. Supply chain disruptions and fluctuations in raw material prices also impact profitability. An estimated xx% reduction in market growth is projected due to supply chain constraints in 2026.
Growth Drivers in the Medical Dynamometer Market Market
Technological advancements, favorable regulatory landscape in certain regions, rising healthcare expenditure, and increasing prevalence of chronic diseases are major growth drivers. The growing adoption of minimally invasive surgical procedures and personalized medicine further contributes to market expansion.
Challenges Impacting Medical Dynamometer Market Growth
Stringent regulatory approvals, high production costs, and intense competition from established players and new market entrants pose significant challenges. Supply chain disruptions and the increasing cost of raw materials also impact market dynamics.
Key Players Shaping the Medical Dynamometer Market Market
- North Coast Medical
- KERN and SOHN GmbH
- Marsden Weighing Group
- JTECH Medical Industries Inc
- Biodex Medical Systems Inc
- Lafayette Instrument
- Fabrication Enterprises
- Charder Electronic Co Ltd
Significant Medical Dynamometer Market Industry Milestones
- 2021: North Coast Medical launched a new wireless hand dynamometer with advanced data analytics capabilities.
- 2022: Biodex Medical Systems Inc acquired a smaller competitor, expanding its product portfolio.
- 2023: New FDA guidelines on medical device safety were implemented, impacting the market.
- 2024: A major industry conference focused on advances in rehabilitation technologies was held, highlighting new dynamometer applications.
Future Outlook for Medical Dynamometer Market Market
The Medical Dynamometer Market is poised for continued expansion driven by technological innovations, rising healthcare expenditure, and a growing focus on preventative and rehabilitative care. The increasing demand for personalized medicine and the integration of AI in diagnostics will create significant growth opportunities. Strategic partnerships, product diversification, and expansion into emerging markets are crucial for sustained success in this dynamic sector.
Medical Dynamometer Market Segmentation
-
1. Product
- 1.1. Chest Dynamometer
- 1.2. Hand Dynamometer
- 1.3. Push Pull Dynamometer
- 1.4. Squeeze Dynamometer
- 1.5. Other Devices
-
2. Application
- 2.1. Orthopedic
- 2.2. Neurology
- 2.3. Cardiology
- 2.4. Medical Trauma
- 2.5. Others
-
3. Usage
- 3.1. Hospitals/Clinics
- 3.2. Rehabilitation Centers
- 3.3. Others
Medical Dynamometer Market Segmentation By Geography
-
1. North America
- 1.1. United States
- 1.2. Canada
- 1.3. Mexico
-
2. Europe
- 2.1. Germany
- 2.2. United Kingdom
- 2.3. France
- 2.4. Italy
- 2.5. Spain
- 2.6. Rest of Europe
-
3. Asia Pacific
- 3.1. China
- 3.2. Japan
- 3.3. India
- 3.4. Australia
- 3.5. South Korea
- 3.6. Rest of Asia Pacific
-
4. Middle East and Africa
- 4.1. GCC
- 4.2. South Africa
- 4.3. Rest of Middle East and Africa
-
5. South America
- 5.1. Brazil
- 5.2. Argentina
- 5.3. Rest of South America
Medical Dynamometer Market REPORT HIGHLIGHTS
| Aspects | Details |
|---|---|
| Study Period | 2019-2033 |
| Base Year | 2024 |
| Estimated Year | 2025 |
| Forecast Period | 2025-2033 |
| Historical Period | 2019-2024 |
| Growth Rate | CAGR of 6.54% from 2019-2033 |
| Segmentation |
|
Table of Contents
- 1. Introduction
- 1.1. Research Scope
- 1.2. Market Segmentation
- 1.3. Research Methodology
- 1.4. Definitions and Assumptions
- 2. Executive Summary
- 2.1. Introduction
- 3. Market Dynamics
- 3.1. Introduction
- 3.2. Market Drivers
- 3.2.1. ; Rising Incidence of Osteoporosis; Increasing Sport Related Injuries and Disorders
- 3.3. Market Restrains
- 3.3.1. ; High Cost of Devices
- 3.4. Market Trends
- 3.4.1. Hand Dynamometer is Expected to Hold the Largest Market Share in the Medical Dynamometer Market
- 4. Market Factor Analysis
- 4.1. Porters Five Forces
- 4.2. Supply/Value Chain
- 4.3. PESTEL analysis
- 4.4. Market Entropy
- 4.5. Patent/Trademark Analysis
- 5. Global Medical Dynamometer Market Analysis, Insights and Forecast, 2019-2031
- 5.1. Market Analysis, Insights and Forecast - by Product
- 5.1.1. Chest Dynamometer
- 5.1.2. Hand Dynamometer
- 5.1.3. Push Pull Dynamometer
- 5.1.4. Squeeze Dynamometer
- 5.1.5. Other Devices
- 5.2. Market Analysis, Insights and Forecast - by Application
- 5.2.1. Orthopedic
- 5.2.2. Neurology
- 5.2.3. Cardiology
- 5.2.4. Medical Trauma
- 5.2.5. Others
- 5.3. Market Analysis, Insights and Forecast - by Usage
- 5.3.1. Hospitals/Clinics
- 5.3.2. Rehabilitation Centers
- 5.3.3. Others
- 5.4. Market Analysis, Insights and Forecast - by Region
- 5.4.1. North America
- 5.4.2. Europe
- 5.4.3. Asia Pacific
- 5.4.4. Middle East and Africa
- 5.4.5. South America
- 5.1. Market Analysis, Insights and Forecast - by Product
- 6. North America Medical Dynamometer Market Analysis, Insights and Forecast, 2019-2031
- 6.1. Market Analysis, Insights and Forecast - by Product
- 6.1.1. Chest Dynamometer
- 6.1.2. Hand Dynamometer
- 6.1.3. Push Pull Dynamometer
- 6.1.4. Squeeze Dynamometer
- 6.1.5. Other Devices
- 6.2. Market Analysis, Insights and Forecast - by Application
- 6.2.1. Orthopedic
- 6.2.2. Neurology
- 6.2.3. Cardiology
- 6.2.4. Medical Trauma
- 6.2.5. Others
- 6.3. Market Analysis, Insights and Forecast - by Usage
- 6.3.1. Hospitals/Clinics
- 6.3.2. Rehabilitation Centers
- 6.3.3. Others
- 6.1. Market Analysis, Insights and Forecast - by Product
- 7. Europe Medical Dynamometer Market Analysis, Insights and Forecast, 2019-2031
- 7.1. Market Analysis, Insights and Forecast - by Product
- 7.1.1. Chest Dynamometer
- 7.1.2. Hand Dynamometer
- 7.1.3. Push Pull Dynamometer
- 7.1.4. Squeeze Dynamometer
- 7.1.5. Other Devices
- 7.2. Market Analysis, Insights and Forecast - by Application
- 7.2.1. Orthopedic
- 7.2.2. Neurology
- 7.2.3. Cardiology
- 7.2.4. Medical Trauma
- 7.2.5. Others
- 7.3. Market Analysis, Insights and Forecast - by Usage
- 7.3.1. Hospitals/Clinics
- 7.3.2. Rehabilitation Centers
- 7.3.3. Others
- 7.1. Market Analysis, Insights and Forecast - by Product
- 8. Asia Pacific Medical Dynamometer Market Analysis, Insights and Forecast, 2019-2031
- 8.1. Market Analysis, Insights and Forecast - by Product
- 8.1.1. Chest Dynamometer
- 8.1.2. Hand Dynamometer
- 8.1.3. Push Pull Dynamometer
- 8.1.4. Squeeze Dynamometer
- 8.1.5. Other Devices
- 8.2. Market Analysis, Insights and Forecast - by Application
- 8.2.1. Orthopedic
- 8.2.2. Neurology
- 8.2.3. Cardiology
- 8.2.4. Medical Trauma
- 8.2.5. Others
- 8.3. Market Analysis, Insights and Forecast - by Usage
- 8.3.1. Hospitals/Clinics
- 8.3.2. Rehabilitation Centers
- 8.3.3. Others
- 8.1. Market Analysis, Insights and Forecast - by Product
- 9. Middle East and Africa Medical Dynamometer Market Analysis, Insights and Forecast, 2019-2031
- 9.1. Market Analysis, Insights and Forecast - by Product
- 9.1.1. Chest Dynamometer
- 9.1.2. Hand Dynamometer
- 9.1.3. Push Pull Dynamometer
- 9.1.4. Squeeze Dynamometer
- 9.1.5. Other Devices
- 9.2. Market Analysis, Insights and Forecast - by Application
- 9.2.1. Orthopedic
- 9.2.2. Neurology
- 9.2.3. Cardiology
- 9.2.4. Medical Trauma
- 9.2.5. Others
- 9.3. Market Analysis, Insights and Forecast - by Usage
- 9.3.1. Hospitals/Clinics
- 9.3.2. Rehabilitation Centers
- 9.3.3. Others
- 9.1. Market Analysis, Insights and Forecast - by Product
- 10. South America Medical Dynamometer Market Analysis, Insights and Forecast, 2019-2031
- 10.1. Market Analysis, Insights and Forecast - by Product
- 10.1.1. Chest Dynamometer
- 10.1.2. Hand Dynamometer
- 10.1.3. Push Pull Dynamometer
- 10.1.4. Squeeze Dynamometer
- 10.1.5. Other Devices
- 10.2. Market Analysis, Insights and Forecast - by Application
- 10.2.1. Orthopedic
- 10.2.2. Neurology
- 10.2.3. Cardiology
- 10.2.4. Medical Trauma
- 10.2.5. Others
- 10.3. Market Analysis, Insights and Forecast - by Usage
- 10.3.1. Hospitals/Clinics
- 10.3.2. Rehabilitation Centers
- 10.3.3. Others
- 10.1. Market Analysis, Insights and Forecast - by Product
- 11. North America Medical Dynamometer Market Analysis, Insights and Forecast, 2019-2031
- 11.1. Market Analysis, Insights and Forecast - By Country/Sub-region
- 11.1.1 United States
- 11.1.2 Canada
- 11.1.3 Mexico
- 12. Europe Medical Dynamometer Market Analysis, Insights and Forecast, 2019-2031
- 12.1. Market Analysis, Insights and Forecast - By Country/Sub-region
- 12.1.1 Germany
- 12.1.2 United Kingdom
- 12.1.3 France
- 12.1.4 Italy
- 12.1.5 Spain
- 12.1.6 Rest of Europe
- 13. Asia Pacific Medical Dynamometer Market Analysis, Insights and Forecast, 2019-2031
- 13.1. Market Analysis, Insights and Forecast - By Country/Sub-region
- 13.1.1 China
- 13.1.2 Japan
- 13.1.3 India
- 13.1.4 Australia
- 13.1.5 South Korea
- 13.1.6 Rest of Asia Pacific
- 14. Middle East and Africa Medical Dynamometer Market Analysis, Insights and Forecast, 2019-2031
- 14.1. Market Analysis, Insights and Forecast - By Country/Sub-region
- 14.1.1 GCC
- 14.1.2 South Africa
- 14.1.3 Rest of Middle East and Africa
- 15. South America Medical Dynamometer Market Analysis, Insights and Forecast, 2019-2031
- 15.1. Market Analysis, Insights and Forecast - By Country/Sub-region
- 15.1.1 Brazil
- 15.1.2 Argentina
- 15.1.3 Rest of South America
- 16. Competitive Analysis
- 16.1. Global Market Share Analysis 2024
- 16.2. Company Profiles
- 16.2.1 North Coast Medical
- 16.2.1.1. Overview
- 16.2.1.2. Products
- 16.2.1.3. SWOT Analysis
- 16.2.1.4. Recent Developments
- 16.2.1.5. Financials (Based on Availability)
- 16.2.2 KERN and SOHN GmbH
- 16.2.2.1. Overview
- 16.2.2.2. Products
- 16.2.2.3. SWOT Analysis
- 16.2.2.4. Recent Developments
- 16.2.2.5. Financials (Based on Availability)
- 16.2.3 Marsden Weighing Group
- 16.2.3.1. Overview
- 16.2.3.2. Products
- 16.2.3.3. SWOT Analysis
- 16.2.3.4. Recent Developments
- 16.2.3.5. Financials (Based on Availability)
- 16.2.4 JTECH Medical Industries Inc
- 16.2.4.1. Overview
- 16.2.4.2. Products
- 16.2.4.3. SWOT Analysis
- 16.2.4.4. Recent Developments
- 16.2.4.5. Financials (Based on Availability)
- 16.2.5 Biodex Medical Systems Inc
- 16.2.5.1. Overview
- 16.2.5.2. Products
- 16.2.5.3. SWOT Analysis
- 16.2.5.4. Recent Developments
- 16.2.5.5. Financials (Based on Availability)
- 16.2.6 Lafayette Instrument*List Not Exhaustive
- 16.2.6.1. Overview
- 16.2.6.2. Products
- 16.2.6.3. SWOT Analysis
- 16.2.6.4. Recent Developments
- 16.2.6.5. Financials (Based on Availability)
- 16.2.7 Fabrication Enterprises
- 16.2.7.1. Overview
- 16.2.7.2. Products
- 16.2.7.3. SWOT Analysis
- 16.2.7.4. Recent Developments
- 16.2.7.5. Financials (Based on Availability)
- 16.2.8 Charder Electronic Co Ltd
- 16.2.8.1. Overview
- 16.2.8.2. Products
- 16.2.8.3. SWOT Analysis
- 16.2.8.4. Recent Developments
- 16.2.8.5. Financials (Based on Availability)
- 16.2.1 North Coast Medical
List of Figures
- Figure 1: Global Medical Dynamometer Market Revenue Breakdown (Million, %) by Region 2024 & 2032
- Figure 2: North America Medical Dynamometer Market Revenue (Million), by Country 2024 & 2032
- Figure 3: North America Medical Dynamometer Market Revenue Share (%), by Country 2024 & 2032
- Figure 4: Europe Medical Dynamometer Market Revenue (Million), by Country 2024 & 2032
- Figure 5: Europe Medical Dynamometer Market Revenue Share (%), by Country 2024 & 2032
- Figure 6: Asia Pacific Medical Dynamometer Market Revenue (Million), by Country 2024 & 2032
- Figure 7: Asia Pacific Medical Dynamometer Market Revenue Share (%), by Country 2024 & 2032
- Figure 8: Middle East and Africa Medical Dynamometer Market Revenue (Million), by Country 2024 & 2032
- Figure 9: Middle East and Africa Medical Dynamometer Market Revenue Share (%), by Country 2024 & 2032
- Figure 10: South America Medical Dynamometer Market Revenue (Million), by Country 2024 & 2032
- Figure 11: South America Medical Dynamometer Market Revenue Share (%), by Country 2024 & 2032
- Figure 12: North America Medical Dynamometer Market Revenue (Million), by Product 2024 & 2032
- Figure 13: North America Medical Dynamometer Market Revenue Share (%), by Product 2024 & 2032
- Figure 14: North America Medical Dynamometer Market Revenue (Million), by Application 2024 & 2032
- Figure 15: North America Medical Dynamometer Market Revenue Share (%), by Application 2024 & 2032
- Figure 16: North America Medical Dynamometer Market Revenue (Million), by Usage 2024 & 2032
- Figure 17: North America Medical Dynamometer Market Revenue Share (%), by Usage 2024 & 2032
- Figure 18: North America Medical Dynamometer Market Revenue (Million), by Country 2024 & 2032
- Figure 19: North America Medical Dynamometer Market Revenue Share (%), by Country 2024 & 2032
- Figure 20: Europe Medical Dynamometer Market Revenue (Million), by Product 2024 & 2032
- Figure 21: Europe Medical Dynamometer Market Revenue Share (%), by Product 2024 & 2032
- Figure 22: Europe Medical Dynamometer Market Revenue (Million), by Application 2024 & 2032
- Figure 23: Europe Medical Dynamometer Market Revenue Share (%), by Application 2024 & 2032
- Figure 24: Europe Medical Dynamometer Market Revenue (Million), by Usage 2024 & 2032
- Figure 25: Europe Medical Dynamometer Market Revenue Share (%), by Usage 2024 & 2032
- Figure 26: Europe Medical Dynamometer Market Revenue (Million), by Country 2024 & 2032
- Figure 27: Europe Medical Dynamometer Market Revenue Share (%), by Country 2024 & 2032
- Figure 28: Asia Pacific Medical Dynamometer Market Revenue (Million), by Product 2024 & 2032
- Figure 29: Asia Pacific Medical Dynamometer Market Revenue Share (%), by Product 2024 & 2032
- Figure 30: Asia Pacific Medical Dynamometer Market Revenue (Million), by Application 2024 & 2032
- Figure 31: Asia Pacific Medical Dynamometer Market Revenue Share (%), by Application 2024 & 2032
- Figure 32: Asia Pacific Medical Dynamometer Market Revenue (Million), by Usage 2024 & 2032
- Figure 33: Asia Pacific Medical Dynamometer Market Revenue Share (%), by Usage 2024 & 2032
- Figure 34: Asia Pacific Medical Dynamometer Market Revenue (Million), by Country 2024 & 2032
- Figure 35: Asia Pacific Medical Dynamometer Market Revenue Share (%), by Country 2024 & 2032
- Figure 36: Middle East and Africa Medical Dynamometer Market Revenue (Million), by Product 2024 & 2032
- Figure 37: Middle East and Africa Medical Dynamometer Market Revenue Share (%), by Product 2024 & 2032
- Figure 38: Middle East and Africa Medical Dynamometer Market Revenue (Million), by Application 2024 & 2032
- Figure 39: Middle East and Africa Medical Dynamometer Market Revenue Share (%), by Application 2024 & 2032
- Figure 40: Middle East and Africa Medical Dynamometer Market Revenue (Million), by Usage 2024 & 2032
- Figure 41: Middle East and Africa Medical Dynamometer Market Revenue Share (%), by Usage 2024 & 2032
- Figure 42: Middle East and Africa Medical Dynamometer Market Revenue (Million), by Country 2024 & 2032
- Figure 43: Middle East and Africa Medical Dynamometer Market Revenue Share (%), by Country 2024 & 2032
- Figure 44: South America Medical Dynamometer Market Revenue (Million), by Product 2024 & 2032
- Figure 45: South America Medical Dynamometer Market Revenue Share (%), by Product 2024 & 2032
- Figure 46: South America Medical Dynamometer Market Revenue (Million), by Application 2024 & 2032
- Figure 47: South America Medical Dynamometer Market Revenue Share (%), by Application 2024 & 2032
- Figure 48: South America Medical Dynamometer Market Revenue (Million), by Usage 2024 & 2032
- Figure 49: South America Medical Dynamometer Market Revenue Share (%), by Usage 2024 & 2032
- Figure 50: South America Medical Dynamometer Market Revenue (Million), by Country 2024 & 2032
- Figure 51: South America Medical Dynamometer Market Revenue Share (%), by Country 2024 & 2032
List of Tables
- Table 1: Global Medical Dynamometer Market Revenue Million Forecast, by Region 2019 & 2032
- Table 2: Global Medical Dynamometer Market Revenue Million Forecast, by Product 2019 & 2032
- Table 3: Global Medical Dynamometer Market Revenue Million Forecast, by Application 2019 & 2032
- Table 4: Global Medical Dynamometer Market Revenue Million Forecast, by Usage 2019 & 2032
- Table 5: Global Medical Dynamometer Market Revenue Million Forecast, by Region 2019 & 2032
- Table 6: Global Medical Dynamometer Market Revenue Million Forecast, by Country 2019 & 2032
- Table 7: United States Medical Dynamometer Market Revenue (Million) Forecast, by Application 2019 & 2032
- Table 8: Canada Medical Dynamometer Market Revenue (Million) Forecast, by Application 2019 & 2032
- Table 9: Mexico Medical Dynamometer Market Revenue (Million) Forecast, by Application 2019 & 2032
- Table 10: Global Medical Dynamometer Market Revenue Million Forecast, by Country 2019 & 2032
- Table 11: Germany Medical Dynamometer Market Revenue (Million) Forecast, by Application 2019 & 2032
- Table 12: United Kingdom Medical Dynamometer Market Revenue (Million) Forecast, by Application 2019 & 2032
- Table 13: France Medical Dynamometer Market Revenue (Million) Forecast, by Application 2019 & 2032
- Table 14: Italy Medical Dynamometer Market Revenue (Million) Forecast, by Application 2019 & 2032
- Table 15: Spain Medical Dynamometer Market Revenue (Million) Forecast, by Application 2019 & 2032
- Table 16: Rest of Europe Medical Dynamometer Market Revenue (Million) Forecast, by Application 2019 & 2032
- Table 17: Global Medical Dynamometer Market Revenue Million Forecast, by Country 2019 & 2032
- Table 18: China Medical Dynamometer Market Revenue (Million) Forecast, by Application 2019 & 2032
- Table 19: Japan Medical Dynamometer Market Revenue (Million) Forecast, by Application 2019 & 2032
- Table 20: India Medical Dynamometer Market Revenue (Million) Forecast, by Application 2019 & 2032
- Table 21: Australia Medical Dynamometer Market Revenue (Million) Forecast, by Application 2019 & 2032
- Table 22: South Korea Medical Dynamometer Market Revenue (Million) Forecast, by Application 2019 & 2032
- Table 23: Rest of Asia Pacific Medical Dynamometer Market Revenue (Million) Forecast, by Application 2019 & 2032
- Table 24: Global Medical Dynamometer Market Revenue Million Forecast, by Country 2019 & 2032
- Table 25: GCC Medical Dynamometer Market Revenue (Million) Forecast, by Application 2019 & 2032
- Table 26: South Africa Medical Dynamometer Market Revenue (Million) Forecast, by Application 2019 & 2032
- Table 27: Rest of Middle East and Africa Medical Dynamometer Market Revenue (Million) Forecast, by Application 2019 & 2032
- Table 28: Global Medical Dynamometer Market Revenue Million Forecast, by Country 2019 & 2032
- Table 29: Brazil Medical Dynamometer Market Revenue (Million) Forecast, by Application 2019 & 2032
- Table 30: Argentina Medical Dynamometer Market Revenue (Million) Forecast, by Application 2019 & 2032
- Table 31: Rest of South America Medical Dynamometer Market Revenue (Million) Forecast, by Application 2019 & 2032
- Table 32: Global Medical Dynamometer Market Revenue Million Forecast, by Product 2019 & 2032
- Table 33: Global Medical Dynamometer Market Revenue Million Forecast, by Application 2019 & 2032
- Table 34: Global Medical Dynamometer Market Revenue Million Forecast, by Usage 2019 & 2032
- Table 35: Global Medical Dynamometer Market Revenue Million Forecast, by Country 2019 & 2032
- Table 36: United States Medical Dynamometer Market Revenue (Million) Forecast, by Application 2019 & 2032
- Table 37: Canada Medical Dynamometer Market Revenue (Million) Forecast, by Application 2019 & 2032
- Table 38: Mexico Medical Dynamometer Market Revenue (Million) Forecast, by Application 2019 & 2032
- Table 39: Global Medical Dynamometer Market Revenue Million Forecast, by Product 2019 & 2032
- Table 40: Global Medical Dynamometer Market Revenue Million Forecast, by Application 2019 & 2032
- Table 41: Global Medical Dynamometer Market Revenue Million Forecast, by Usage 2019 & 2032
- Table 42: Global Medical Dynamometer Market Revenue Million Forecast, by Country 2019 & 2032
- Table 43: Germany Medical Dynamometer Market Revenue (Million) Forecast, by Application 2019 & 2032
- Table 44: United Kingdom Medical Dynamometer Market Revenue (Million) Forecast, by Application 2019 & 2032
- Table 45: France Medical Dynamometer Market Revenue (Million) Forecast, by Application 2019 & 2032
- Table 46: Italy Medical Dynamometer Market Revenue (Million) Forecast, by Application 2019 & 2032
- Table 47: Spain Medical Dynamometer Market Revenue (Million) Forecast, by Application 2019 & 2032
- Table 48: Rest of Europe Medical Dynamometer Market Revenue (Million) Forecast, by Application 2019 & 2032
- Table 49: Global Medical Dynamometer Market Revenue Million Forecast, by Product 2019 & 2032
- Table 50: Global Medical Dynamometer Market Revenue Million Forecast, by Application 2019 & 2032
- Table 51: Global Medical Dynamometer Market Revenue Million Forecast, by Usage 2019 & 2032
- Table 52: Global Medical Dynamometer Market Revenue Million Forecast, by Country 2019 & 2032
- Table 53: China Medical Dynamometer Market Revenue (Million) Forecast, by Application 2019 & 2032
- Table 54: Japan Medical Dynamometer Market Revenue (Million) Forecast, by Application 2019 & 2032
- Table 55: India Medical Dynamometer Market Revenue (Million) Forecast, by Application 2019 & 2032
- Table 56: Australia Medical Dynamometer Market Revenue (Million) Forecast, by Application 2019 & 2032
- Table 57: South Korea Medical Dynamometer Market Revenue (Million) Forecast, by Application 2019 & 2032
- Table 58: Rest of Asia Pacific Medical Dynamometer Market Revenue (Million) Forecast, by Application 2019 & 2032
- Table 59: Global Medical Dynamometer Market Revenue Million Forecast, by Product 2019 & 2032
- Table 60: Global Medical Dynamometer Market Revenue Million Forecast, by Application 2019 & 2032
- Table 61: Global Medical Dynamometer Market Revenue Million Forecast, by Usage 2019 & 2032
- Table 62: Global Medical Dynamometer Market Revenue Million Forecast, by Country 2019 & 2032
- Table 63: GCC Medical Dynamometer Market Revenue (Million) Forecast, by Application 2019 & 2032
- Table 64: South Africa Medical Dynamometer Market Revenue (Million) Forecast, by Application 2019 & 2032
- Table 65: Rest of Middle East and Africa Medical Dynamometer Market Revenue (Million) Forecast, by Application 2019 & 2032
- Table 66: Global Medical Dynamometer Market Revenue Million Forecast, by Product 2019 & 2032
- Table 67: Global Medical Dynamometer Market Revenue Million Forecast, by Application 2019 & 2032
- Table 68: Global Medical Dynamometer Market Revenue Million Forecast, by Usage 2019 & 2032
- Table 69: Global Medical Dynamometer Market Revenue Million Forecast, by Country 2019 & 2032
- Table 70: Brazil Medical Dynamometer Market Revenue (Million) Forecast, by Application 2019 & 2032
- Table 71: Argentina Medical Dynamometer Market Revenue (Million) Forecast, by Application 2019 & 2032
- Table 72: Rest of South America Medical Dynamometer Market Revenue (Million) Forecast, by Application 2019 & 2032
Frequently Asked Questions
1. What is the projected Compound Annual Growth Rate (CAGR) of the Medical Dynamometer Market?
The projected CAGR is approximately 6.54%.
2. Which companies are prominent players in the Medical Dynamometer Market?
Key companies in the market include North Coast Medical, KERN and SOHN GmbH, Marsden Weighing Group, JTECH Medical Industries Inc, Biodex Medical Systems Inc, Lafayette Instrument*List Not Exhaustive, Fabrication Enterprises, Charder Electronic Co Ltd.
3. What are the main segments of the Medical Dynamometer Market?
The market segments include Product, Application, Usage.
4. Can you provide details about the market size?
The market size is estimated to be USD 501.02 Million as of 2022.
5. What are some drivers contributing to market growth?
; Rising Incidence of Osteoporosis; Increasing Sport Related Injuries and Disorders.
6. What are the notable trends driving market growth?
Hand Dynamometer is Expected to Hold the Largest Market Share in the Medical Dynamometer Market.
7. Are there any restraints impacting market growth?
; High Cost of Devices.
8. Can you provide examples of recent developments in the market?
N/A
9. What pricing options are available for accessing the report?
Pricing options include single-user, multi-user, and enterprise licenses priced at USD 4750, USD 5250, and USD 8750 respectively.
10. Is the market size provided in terms of value or volume?
The market size is provided in terms of value, measured in Million.
11. Are there any specific market keywords associated with the report?
Yes, the market keyword associated with the report is "Medical Dynamometer Market," which aids in identifying and referencing the specific market segment covered.
12. How do I determine which pricing option suits my needs best?
The pricing options vary based on user requirements and access needs. Individual users may opt for single-user licenses, while businesses requiring broader access may choose multi-user or enterprise licenses for cost-effective access to the report.
13. Are there any additional resources or data provided in the Medical Dynamometer Market report?
While the report offers comprehensive insights, it's advisable to review the specific contents or supplementary materials provided to ascertain if additional resources or data are available.
14. How can I stay updated on further developments or reports in the Medical Dynamometer Market?
To stay informed about further developments, trends, and reports in the Medical Dynamometer Market, consider subscribing to industry newsletters, following relevant companies and organizations, or regularly checking reputable industry news sources and publications.
Methodology
Step 1 - Identification of Relevant Samples Size from Population Database


Step 2 - Approaches for Defining Global Market Size (Value, Volume* & Price*)

Note*: In applicable scenarios
Step 3 - Data Sources
Primary Research
- Web Analytics
- Survey Reports
- Research Institute
- Latest Research Reports
- Opinion Leaders
Secondary Research
- Annual Reports
- White Paper
- Latest Press Release
- Industry Association
- Paid Database
- Investor Presentations

Step 4 - Data Triangulation
Involves using different sources of information in order to increase the validity of a study
These sources are likely to be stakeholders in a program - participants, other researchers, program staff, other community members, and so on.
Then we put all data in single framework & apply various statistical tools to find out the dynamic on the market.
During the analysis stage, feedback from the stakeholder groups would be compared to determine areas of agreement as well as areas of divergence
