

Key Insights
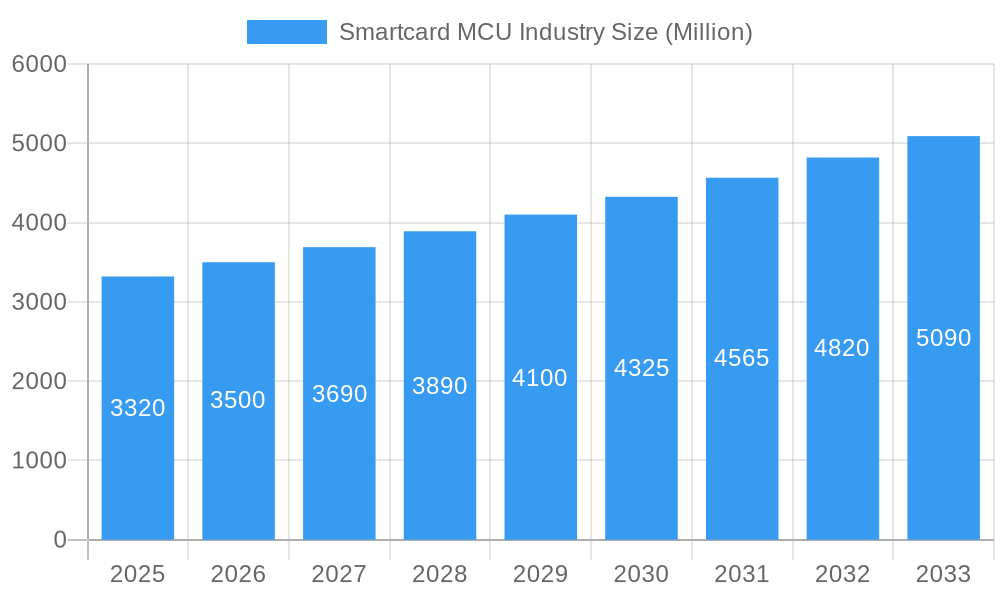
The global smartcard microcontroller unit (MCU) market is experiencing robust growth, projected to reach \$3.32 billion in 2025 and maintain a Compound Annual Growth Rate (CAGR) of 5.29% from 2025 to 2033. This expansion is driven by several key factors. The increasing adoption of contactless payment systems and digital identity solutions fuels demand for secure and reliable smartcard MCUs. Furthermore, the growth of the Internet of Things (IoT) and the expanding need for secure authentication in various applications, such as access control and transportation, are significant contributors. Government initiatives promoting digitalization and the rising adoption of e-governance solutions across various sectors further propel market growth. The market is segmented by product type (8-bit, 16-bit, and 32-bit MCUs), functionality (transaction processing, communication, security and access control), and end-user industries (BFSI, telecommunications, government, healthcare, education, retail, and transportation). The 32-bit MCU segment is expected to witness the fastest growth due to its enhanced processing capabilities and security features. The BFSI and telecommunications sectors are currently the largest consumers of smartcard MCUs, but other industries are rapidly adopting this technology. Competitive pressures among leading manufacturers, including Giesecke+Devrient, Infineon Technologies, Microchip Technology, NXP Semiconductors, Samsung Electronics, STMicroelectronics, Renesas Electronics, Idemia Group, and Thales Group, further stimulate innovation and market expansion.
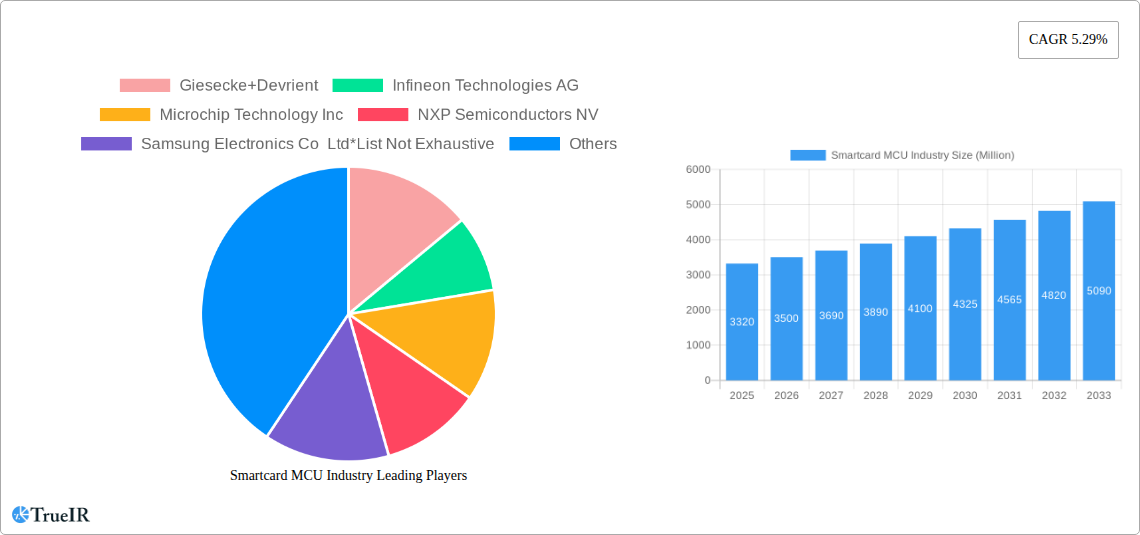
Smartcard MCU Industry Market Size (In Billion)
While the market presents significant opportunities, challenges remain. The relatively high cost of advanced smartcard MCUs could hinder adoption in price-sensitive markets. Furthermore, concerns about data security and privacy continue to pose a risk. Nevertheless, ongoing technological advancements, particularly in areas such as secure element technology and improved power efficiency, are expected to mitigate these challenges. The market is predicted to see continued growth across all regions, with Asia Pacific potentially showing the most significant expansion given its large and rapidly developing economies. The forecast period (2025-2033) promises sustained growth, driven by continuous technological improvements and expanding application areas, positioning smartcard MCUs as a vital component of the digital economy.
Smartcard MCU Industry Company Market Share
Smartcard MCU Industry Market Report: 2019-2033
This comprehensive report provides a detailed analysis of the Smartcard MCU industry, offering invaluable insights for businesses, investors, and researchers. With a focus on market trends, competitive dynamics, and future growth prospects, this report covers the period from 2019 to 2033, with a base year of 2025. The study encompasses a detailed examination of key players like Giesecke+Devrient, Infineon Technologies AG, Microchip Technology Inc, NXP Semiconductors NV, Samsung Electronics Co Ltd, STMicroelectronics, Zilog Inc, Renesas Electronics Corporation, Idemia Group, and Thales group, and explores the various segments driving market expansion. The report projects a market value exceeding xx Million by 2033.
Smartcard MCU Industry Market Structure & Competitive Landscape
The Smartcard MCU market exhibits a moderately consolidated structure, with a few major players holding significant market share. The Herfindahl-Hirschman Index (HHI) is estimated to be around xx, indicating moderate concentration. Innovation plays a crucial role, with companies continuously investing in developing advanced security features, energy-efficient designs, and enhanced communication capabilities. Regulatory frameworks, particularly those related to data security and privacy, significantly influence market dynamics. Product substitutes, such as software-based security solutions, pose a competitive threat, though hardware-based MCUs still hold a significant advantage in terms of security and performance.
The market is segmented by product (8-bit, 16-bit, 32-bit MCUs), functionality (transaction, communication, security and access control), and end-user industry (BFSI, telecommunications, government, healthcare, education, retail, transportation, and others). Mergers and acquisitions (M&A) activity has been moderate in recent years, with xx deals recorded between 2019 and 2024, driven primarily by the need to expand product portfolios and geographic reach. Future M&A activity is predicted to increase in line with market growth.
- Market Concentration: Moderate (HHI: xx)
- Innovation Drivers: Enhanced security, energy efficiency, advanced communication protocols.
- Regulatory Impacts: Stringent data security and privacy regulations.
- Product Substitutes: Software-based security solutions.
- M&A Trends: Moderate activity (xx deals between 2019-2024), expected to increase.
Smartcard MCU Industry Market Trends & Opportunities
The Smartcard MCU market is experiencing robust and sustained growth, propelled by the escalating global demand for secure transactions, robust digital identity solutions, and enhanced data protection across a diverse spectrum of industries. Projections indicate the market size will reach an estimated [Insert Specific Value] Million by 2025 and is further forecasted to expand to [Insert Specific Value] Million by 2033, demonstrating a compelling Compound Annual Growth Rate (CAGR) of approximately [Insert Specific Percentage]% during the forecast period (2025-2033). This upward trajectory is underpinned by several critical factors, including the accelerating adoption of contactless payment systems for enhanced convenience and security, the exponential proliferation of Internet of Things (IoT) devices necessitating secure embedded solutions, and the pervasive need for foolproof authentication mechanisms in an increasingly interconnected world.
Pioneering technological advancements, such as the seamless integration of Near-Field Communication (NFC) capabilities and the implementation of sophisticated, multi-layered encryption algorithms, are acting as significant catalysts for market expansion. Furthermore, evolving consumer preferences for secure, user-friendly, and convenient digital solutions are profoundly influencing market dynamics and driving demand for advanced smartcard microcontrollers. The competitive landscape is characterized by a vigorous rivalry between well-established industry leaders and agile new entrants, fostering an environment of continuous innovation. Market penetration rates exhibit considerable variation across different geographical regions and industry segments, with mature markets generally displaying higher adoption rates compared to nascent economies, presenting unique opportunities for strategic market entry and expansion. The pronounced shift towards more powerful and feature-rich 32-bit MCUs is opening up substantial new avenues for vendors capable of delivering advanced functionalities, enhanced processing power, and superior security features.
Dominant Markets & Segments in Smartcard MCU Industry
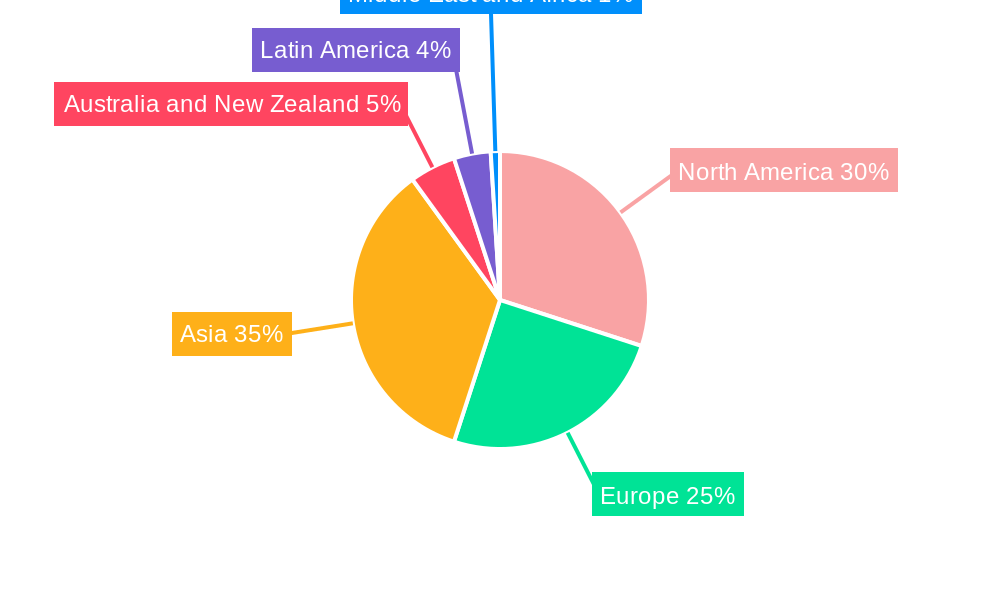
The Smartcard MCU market exhibits significant geographical diversity. Currently, North America and Europe stand as leading regions in terms of market share, largely due to their well-established digital infrastructure and high adoption rates of secure technologies. However, the Asia-Pacific region is poised for the most rapid expansion throughout the forecast period. This accelerated growth is primarily attributed to the burgeoning telecommunications sector and the robust development of the Banking, Financial Services, and Insurance (BFSI) sectors within these economies, coupled with increasing government initiatives promoting digital transformation.
-
By Product: While the 16-bit MCU segment currently commands the largest market share, followed closely by 8-bit MCUs, the 32-bit MCU segment is projected to experience the most substantial growth. This surge is driven by the escalating demand for higher processing power, advanced security features, and greater integration capabilities required for next-generation applications.
-
By Functionality: Security and access control functionalities represent the dominant segment within the market, reflecting a global prioritization of data protection and identity verification. Transaction and communication functionalities follow as key application areas. The remarkable growth observed in security-focused applications is a direct response to heightened concerns surrounding data breaches, evolving cyber threats, and the need for highly reliable authentication systems.
-
By End-user Industry: The BFSI sector continues to be the leading end-user industry for smartcard MCUs, driven by the critical need for secure payment processing and financial transactions. The telecommunications sector also holds a substantial market share. Emerging sectors such as government (for digital IDs and e-governance), healthcare (for patient data security), and transportation (for ticketing and access control) are demonstrating robust growth prospects, signaling diversification of market applications.
-
Key Growth Drivers:
- Continuous expansion and modernization of digital payment infrastructure globally.
- Proactive government initiatives and mandates promoting the development and adoption of secure digital identity solutions.
- The widespread and increasing adoption of contactless technologies across various consumer and enterprise applications.
- Heightened and persistent security concerns across an ever-wider array of industries and applications, demanding more sophisticated protective measures.
Smartcard MCU Industry Product Analysis
The Smartcard MCU market is characterized by a wide range of products, offering diverse functionalities and performance levels. Recent innovations include the integration of NFC capabilities, advanced encryption algorithms, and improved power efficiency. These advancements cater to the increasing demand for secure and reliable solutions in various applications, offering competitive advantages to vendors offering innovative products tailored to specific market needs. The market is witnessing a shift towards 32-bit MCUs offering enhanced processing power and improved security features compared to 8-bit and 16-bit MCUs.
Key Drivers, Barriers & Challenges in Smartcard MCU Industry
Key Drivers: The pervasive and increasing adoption of digital technologies across virtually all sectors of the economy serves as a primary engine for the Smartcard MCU market. This is complemented by a growing imperative for robust secure authentication and comprehensive data protection, essential in an era of digital transformation. Furthermore, evolving government regulations and policies that actively promote digitalization and enhance cybersecurity frameworks are significantly fueling market growth. Concurrently, continuous technological advancements, particularly the development of more powerful, energy-efficient, and highly secure MCUs, are consistently contributing to market expansion and enabling new application possibilities.
Key Challenges: The market faces several significant hurdles. The increasing prevalence and sophistication of software-based security solutions present a competitive challenge, offering alternative approaches to data protection. The inherent complexity involved in integrating new and advanced technologies into existing systems can lead to longer development cycles and increased costs. Disruptions within global supply chains, affecting the availability and pricing of components, pose a persistent challenge. Moreover, stringent and evolving regulatory requirements across different regions necessitate continuous compliance efforts and can impact time-to-market for new products. These collective challenges can impede market expansion by escalating production expenses, limiting the availability of critical components, and extending the time required to bring innovative solutions to market.
Growth Drivers in the Smartcard MCU Industry Market
Several pivotal factors are accelerating growth within the Smartcard MCU Industry Market. Chief among these are ongoing technological advancements, most notably the introduction and widespread adoption of 32-bit MCUs. These newer processors offer significantly improved processing power, enhanced security features, and greater energy efficiency, making them ideal for demanding applications. The accelerating adoption of contactless payment systems, driven by consumer demand for convenience and speed, is a major contributor. Furthermore, the expanding ecosystem of Internet of Things (IoT) applications, which inherently require secure and embedded processing capabilities, presents a substantial growth avenue. Government regulations and initiatives that actively promote the development and implementation of secure digital identity solutions are playing a crucial role. Finally, the persistent and increasing global demand for secure authentication mechanisms across all industries is a fundamental driver of market expansion.
Challenges Impacting Smartcard MCU Industry Growth
Supply chain disruptions, particularly in the procurement of crucial components, pose a significant challenge. Stringent regulatory requirements regarding data security and privacy add complexity and cost to product development and certification. Intense competition among established players and the emergence of new entrants exert considerable pressure on profit margins.
Key Players Shaping the Smartcard MCU Industry Market
- Giesecke+Devrient
- Infineon Technologies AG
- Microchip Technology Inc
- NXP Semiconductors NV
- Samsung Electronics Co Ltd
- STMicroelectronics
- Zilog Inc
- Renesas Electronics Corporation
- Idemia Group
- Thales group
Significant Smartcard MCU Industry Industry Milestones
- April 2023: STMicroelectronics launched its advanced STR71xF series of microcontrollers. These MCUs are built upon the robust ARM7(TM) Thumb(R) core and feature a diverse array of communication interfaces, including dedicated Smart Card interfaces. This launch underscores the industry's movement towards 32-bit architecture and integrated functionalities.
- March 2023: NXP Semiconductors unveiled the PN7642 chip. This innovative integrated circuit consolidates a powerful microcontroller, an advanced NFC front end, and essential security features into a single, compact package. This all-in-one solution is designed to streamline secure authentication processes and significantly reduce overall system design complexity and cost for manufacturers.
Future Outlook for Smartcard MCU Industry Market
The Smartcard MCU market is poised for continued growth, driven by the ongoing digital transformation across various sectors. The increasing demand for secure and reliable solutions, coupled with technological advancements and supportive government regulations, will create significant opportunities for market players. Strategic partnerships and collaborations, along with continuous innovation in product development, are expected to shape future market dynamics.
Smartcard MCU Industry Segmentation
-
1. Product
- 1.1. 8-bit
- 1.2. 16-bit
- 1.3. 32-bit
-
2. Functionality
- 2.1. Transaction
- 2.2. Communication
- 2.3. Security and Access Control
-
3. End-user Industry
- 3.1. BFSI
- 3.2. Telecommunications
- 3.3. Government and Healthcare
- 3.4. Education
- 3.5. Retail
- 3.6. Transportation
- 3.7. Other End-User Industries
Smartcard MCU Industry Segmentation By Geography
- 1. North America
- 2. Europe
- 3. Asia
- 4. Australia and New Zealand
- 5. Latin America
- 6. Middle East and Africa
Smartcard MCU Industry Regional Market Share
Geographic Coverage of Smartcard MCU Industry
Smartcard MCU Industry REPORT HIGHLIGHTS
| Aspects | Details |
|---|---|
| Study Period | 2020-2034 |
| Base Year | 2025 |
| Estimated Year | 2026 |
| Forecast Period | 2026-2034 |
| Historical Period | 2020-2025 |
| Growth Rate | CAGR of 5.29% from 2020-2034 |
| Segmentation |
|
Table of Contents
- 1. Introduction
- 1.1. Research Scope
- 1.2. Market Segmentation
- 1.3. Research Methodology
- 1.4. Definitions and Assumptions
- 2. Executive Summary
- 2.1. Introduction
- 3. Market Dynamics
- 3.1. Introduction
- 3.2. Market Drivers
- 3.2.1. Rapid Development of Digital Technologies; Increasing Investments by Governments in Transportation Systems
- 3.3. Market Restrains
- 3.3.1. Higher Cost of Advanced Featured Vehicles
- 3.4. Market Trends
- 3.4.1. BFSI to Witness the Growth
- 4. Market Factor Analysis
- 4.1. Porters Five Forces
- 4.2. Supply/Value Chain
- 4.3. PESTEL analysis
- 4.4. Market Entropy
- 4.5. Patent/Trademark Analysis
- 5. Global Smartcard MCU Industry Analysis, Insights and Forecast, 2020-2032
- 5.1. Market Analysis, Insights and Forecast - by Product
- 5.1.1. 8-bit
- 5.1.2. 16-bit
- 5.1.3. 32-bit
- 5.2. Market Analysis, Insights and Forecast - by Functionality
- 5.2.1. Transaction
- 5.2.2. Communication
- 5.2.3. Security and Access Control
- 5.3. Market Analysis, Insights and Forecast - by End-user Industry
- 5.3.1. BFSI
- 5.3.2. Telecommunications
- 5.3.3. Government and Healthcare
- 5.3.4. Education
- 5.3.5. Retail
- 5.3.6. Transportation
- 5.3.7. Other End-User Industries
- 5.4. Market Analysis, Insights and Forecast - by Region
- 5.4.1. North America
- 5.4.2. Europe
- 5.4.3. Asia
- 5.4.4. Australia and New Zealand
- 5.4.5. Latin America
- 5.4.6. Middle East and Africa
- 5.1. Market Analysis, Insights and Forecast - by Product
- 6. North America Smartcard MCU Industry Analysis, Insights and Forecast, 2020-2032
- 6.1. Market Analysis, Insights and Forecast - by Product
- 6.1.1. 8-bit
- 6.1.2. 16-bit
- 6.1.3. 32-bit
- 6.2. Market Analysis, Insights and Forecast - by Functionality
- 6.2.1. Transaction
- 6.2.2. Communication
- 6.2.3. Security and Access Control
- 6.3. Market Analysis, Insights and Forecast - by End-user Industry
- 6.3.1. BFSI
- 6.3.2. Telecommunications
- 6.3.3. Government and Healthcare
- 6.3.4. Education
- 6.3.5. Retail
- 6.3.6. Transportation
- 6.3.7. Other End-User Industries
- 6.1. Market Analysis, Insights and Forecast - by Product
- 7. Europe Smartcard MCU Industry Analysis, Insights and Forecast, 2020-2032
- 7.1. Market Analysis, Insights and Forecast - by Product
- 7.1.1. 8-bit
- 7.1.2. 16-bit
- 7.1.3. 32-bit
- 7.2. Market Analysis, Insights and Forecast - by Functionality
- 7.2.1. Transaction
- 7.2.2. Communication
- 7.2.3. Security and Access Control
- 7.3. Market Analysis, Insights and Forecast - by End-user Industry
- 7.3.1. BFSI
- 7.3.2. Telecommunications
- 7.3.3. Government and Healthcare
- 7.3.4. Education
- 7.3.5. Retail
- 7.3.6. Transportation
- 7.3.7. Other End-User Industries
- 7.1. Market Analysis, Insights and Forecast - by Product
- 8. Asia Smartcard MCU Industry Analysis, Insights and Forecast, 2020-2032
- 8.1. Market Analysis, Insights and Forecast - by Product
- 8.1.1. 8-bit
- 8.1.2. 16-bit
- 8.1.3. 32-bit
- 8.2. Market Analysis, Insights and Forecast - by Functionality
- 8.2.1. Transaction
- 8.2.2. Communication
- 8.2.3. Security and Access Control
- 8.3. Market Analysis, Insights and Forecast - by End-user Industry
- 8.3.1. BFSI
- 8.3.2. Telecommunications
- 8.3.3. Government and Healthcare
- 8.3.4. Education
- 8.3.5. Retail
- 8.3.6. Transportation
- 8.3.7. Other End-User Industries
- 8.1. Market Analysis, Insights and Forecast - by Product
- 9. Australia and New Zealand Smartcard MCU Industry Analysis, Insights and Forecast, 2020-2032
- 9.1. Market Analysis, Insights and Forecast - by Product
- 9.1.1. 8-bit
- 9.1.2. 16-bit
- 9.1.3. 32-bit
- 9.2. Market Analysis, Insights and Forecast - by Functionality
- 9.2.1. Transaction
- 9.2.2. Communication
- 9.2.3. Security and Access Control
- 9.3. Market Analysis, Insights and Forecast - by End-user Industry
- 9.3.1. BFSI
- 9.3.2. Telecommunications
- 9.3.3. Government and Healthcare
- 9.3.4. Education
- 9.3.5. Retail
- 9.3.6. Transportation
- 9.3.7. Other End-User Industries
- 9.1. Market Analysis, Insights and Forecast - by Product
- 10. Latin America Smartcard MCU Industry Analysis, Insights and Forecast, 2020-2032
- 10.1. Market Analysis, Insights and Forecast - by Product
- 10.1.1. 8-bit
- 10.1.2. 16-bit
- 10.1.3. 32-bit
- 10.2. Market Analysis, Insights and Forecast - by Functionality
- 10.2.1. Transaction
- 10.2.2. Communication
- 10.2.3. Security and Access Control
- 10.3. Market Analysis, Insights and Forecast - by End-user Industry
- 10.3.1. BFSI
- 10.3.2. Telecommunications
- 10.3.3. Government and Healthcare
- 10.3.4. Education
- 10.3.5. Retail
- 10.3.6. Transportation
- 10.3.7. Other End-User Industries
- 10.1. Market Analysis, Insights and Forecast - by Product
- 11. Middle East and Africa Smartcard MCU Industry Analysis, Insights and Forecast, 2020-2032
- 11.1. Market Analysis, Insights and Forecast - by Product
- 11.1.1. 8-bit
- 11.1.2. 16-bit
- 11.1.3. 32-bit
- 11.2. Market Analysis, Insights and Forecast - by Functionality
- 11.2.1. Transaction
- 11.2.2. Communication
- 11.2.3. Security and Access Control
- 11.3. Market Analysis, Insights and Forecast - by End-user Industry
- 11.3.1. BFSI
- 11.3.2. Telecommunications
- 11.3.3. Government and Healthcare
- 11.3.4. Education
- 11.3.5. Retail
- 11.3.6. Transportation
- 11.3.7. Other End-User Industries
- 11.1. Market Analysis, Insights and Forecast - by Product
- 12. Competitive Analysis
- 12.1. Global Market Share Analysis 2025
- 12.2. Company Profiles
- 12.2.1 Giesecke+Devrient
- 12.2.1.1. Overview
- 12.2.1.2. Products
- 12.2.1.3. SWOT Analysis
- 12.2.1.4. Recent Developments
- 12.2.1.5. Financials (Based on Availability)
- 12.2.2 Infineon Technologies AG
- 12.2.2.1. Overview
- 12.2.2.2. Products
- 12.2.2.3. SWOT Analysis
- 12.2.2.4. Recent Developments
- 12.2.2.5. Financials (Based on Availability)
- 12.2.3 Microchip Technology Inc
- 12.2.3.1. Overview
- 12.2.3.2. Products
- 12.2.3.3. SWOT Analysis
- 12.2.3.4. Recent Developments
- 12.2.3.5. Financials (Based on Availability)
- 12.2.4 NXP Semiconductors NV
- 12.2.4.1. Overview
- 12.2.4.2. Products
- 12.2.4.3. SWOT Analysis
- 12.2.4.4. Recent Developments
- 12.2.4.5. Financials (Based on Availability)
- 12.2.5 Samsung Electronics Co Ltd*List Not Exhaustive
- 12.2.5.1. Overview
- 12.2.5.2. Products
- 12.2.5.3. SWOT Analysis
- 12.2.5.4. Recent Developments
- 12.2.5.5. Financials (Based on Availability)
- 12.2.6 STMicroelectronics
- 12.2.6.1. Overview
- 12.2.6.2. Products
- 12.2.6.3. SWOT Analysis
- 12.2.6.4. Recent Developments
- 12.2.6.5. Financials (Based on Availability)
- 12.2.7 Zilog Inc
- 12.2.7.1. Overview
- 12.2.7.2. Products
- 12.2.7.3. SWOT Analysis
- 12.2.7.4. Recent Developments
- 12.2.7.5. Financials (Based on Availability)
- 12.2.8 Renesas Electronics Corporation
- 12.2.8.1. Overview
- 12.2.8.2. Products
- 12.2.8.3. SWOT Analysis
- 12.2.8.4. Recent Developments
- 12.2.8.5. Financials (Based on Availability)
- 12.2.9 Idemia Group
- 12.2.9.1. Overview
- 12.2.9.2. Products
- 12.2.9.3. SWOT Analysis
- 12.2.9.4. Recent Developments
- 12.2.9.5. Financials (Based on Availability)
- 12.2.10 Thales group
- 12.2.10.1. Overview
- 12.2.10.2. Products
- 12.2.10.3. SWOT Analysis
- 12.2.10.4. Recent Developments
- 12.2.10.5. Financials (Based on Availability)
- 12.2.1 Giesecke+Devrient
List of Figures
- Figure 1: Global Smartcard MCU Industry Revenue Breakdown (Million, %) by Region 2025 & 2033
- Figure 2: North America Smartcard MCU Industry Revenue (Million), by Product 2025 & 2033
- Figure 3: North America Smartcard MCU Industry Revenue Share (%), by Product 2025 & 2033
- Figure 4: North America Smartcard MCU Industry Revenue (Million), by Functionality 2025 & 2033
- Figure 5: North America Smartcard MCU Industry Revenue Share (%), by Functionality 2025 & 2033
- Figure 6: North America Smartcard MCU Industry Revenue (Million), by End-user Industry 2025 & 2033
- Figure 7: North America Smartcard MCU Industry Revenue Share (%), by End-user Industry 2025 & 2033
- Figure 8: North America Smartcard MCU Industry Revenue (Million), by Country 2025 & 2033
- Figure 9: North America Smartcard MCU Industry Revenue Share (%), by Country 2025 & 2033
- Figure 10: Europe Smartcard MCU Industry Revenue (Million), by Product 2025 & 2033
- Figure 11: Europe Smartcard MCU Industry Revenue Share (%), by Product 2025 & 2033
- Figure 12: Europe Smartcard MCU Industry Revenue (Million), by Functionality 2025 & 2033
- Figure 13: Europe Smartcard MCU Industry Revenue Share (%), by Functionality 2025 & 2033
- Figure 14: Europe Smartcard MCU Industry Revenue (Million), by End-user Industry 2025 & 2033
- Figure 15: Europe Smartcard MCU Industry Revenue Share (%), by End-user Industry 2025 & 2033
- Figure 16: Europe Smartcard MCU Industry Revenue (Million), by Country 2025 & 2033
- Figure 17: Europe Smartcard MCU Industry Revenue Share (%), by Country 2025 & 2033
- Figure 18: Asia Smartcard MCU Industry Revenue (Million), by Product 2025 & 2033
- Figure 19: Asia Smartcard MCU Industry Revenue Share (%), by Product 2025 & 2033
- Figure 20: Asia Smartcard MCU Industry Revenue (Million), by Functionality 2025 & 2033
- Figure 21: Asia Smartcard MCU Industry Revenue Share (%), by Functionality 2025 & 2033
- Figure 22: Asia Smartcard MCU Industry Revenue (Million), by End-user Industry 2025 & 2033
- Figure 23: Asia Smartcard MCU Industry Revenue Share (%), by End-user Industry 2025 & 2033
- Figure 24: Asia Smartcard MCU Industry Revenue (Million), by Country 2025 & 2033
- Figure 25: Asia Smartcard MCU Industry Revenue Share (%), by Country 2025 & 2033
- Figure 26: Australia and New Zealand Smartcard MCU Industry Revenue (Million), by Product 2025 & 2033
- Figure 27: Australia and New Zealand Smartcard MCU Industry Revenue Share (%), by Product 2025 & 2033
- Figure 28: Australia and New Zealand Smartcard MCU Industry Revenue (Million), by Functionality 2025 & 2033
- Figure 29: Australia and New Zealand Smartcard MCU Industry Revenue Share (%), by Functionality 2025 & 2033
- Figure 30: Australia and New Zealand Smartcard MCU Industry Revenue (Million), by End-user Industry 2025 & 2033
- Figure 31: Australia and New Zealand Smartcard MCU Industry Revenue Share (%), by End-user Industry 2025 & 2033
- Figure 32: Australia and New Zealand Smartcard MCU Industry Revenue (Million), by Country 2025 & 2033
- Figure 33: Australia and New Zealand Smartcard MCU Industry Revenue Share (%), by Country 2025 & 2033
- Figure 34: Latin America Smartcard MCU Industry Revenue (Million), by Product 2025 & 2033
- Figure 35: Latin America Smartcard MCU Industry Revenue Share (%), by Product 2025 & 2033
- Figure 36: Latin America Smartcard MCU Industry Revenue (Million), by Functionality 2025 & 2033
- Figure 37: Latin America Smartcard MCU Industry Revenue Share (%), by Functionality 2025 & 2033
- Figure 38: Latin America Smartcard MCU Industry Revenue (Million), by End-user Industry 2025 & 2033
- Figure 39: Latin America Smartcard MCU Industry Revenue Share (%), by End-user Industry 2025 & 2033
- Figure 40: Latin America Smartcard MCU Industry Revenue (Million), by Country 2025 & 2033
- Figure 41: Latin America Smartcard MCU Industry Revenue Share (%), by Country 2025 & 2033
- Figure 42: Middle East and Africa Smartcard MCU Industry Revenue (Million), by Product 2025 & 2033
- Figure 43: Middle East and Africa Smartcard MCU Industry Revenue Share (%), by Product 2025 & 2033
- Figure 44: Middle East and Africa Smartcard MCU Industry Revenue (Million), by Functionality 2025 & 2033
- Figure 45: Middle East and Africa Smartcard MCU Industry Revenue Share (%), by Functionality 2025 & 2033
- Figure 46: Middle East and Africa Smartcard MCU Industry Revenue (Million), by End-user Industry 2025 & 2033
- Figure 47: Middle East and Africa Smartcard MCU Industry Revenue Share (%), by End-user Industry 2025 & 2033
- Figure 48: Middle East and Africa Smartcard MCU Industry Revenue (Million), by Country 2025 & 2033
- Figure 49: Middle East and Africa Smartcard MCU Industry Revenue Share (%), by Country 2025 & 2033
List of Tables
- Table 1: Global Smartcard MCU Industry Revenue Million Forecast, by Product 2020 & 2033
- Table 2: Global Smartcard MCU Industry Revenue Million Forecast, by Functionality 2020 & 2033
- Table 3: Global Smartcard MCU Industry Revenue Million Forecast, by End-user Industry 2020 & 2033
- Table 4: Global Smartcard MCU Industry Revenue Million Forecast, by Region 2020 & 2033
- Table 5: Global Smartcard MCU Industry Revenue Million Forecast, by Product 2020 & 2033
- Table 6: Global Smartcard MCU Industry Revenue Million Forecast, by Functionality 2020 & 2033
- Table 7: Global Smartcard MCU Industry Revenue Million Forecast, by End-user Industry 2020 & 2033
- Table 8: Global Smartcard MCU Industry Revenue Million Forecast, by Country 2020 & 2033
- Table 9: Global Smartcard MCU Industry Revenue Million Forecast, by Product 2020 & 2033
- Table 10: Global Smartcard MCU Industry Revenue Million Forecast, by Functionality 2020 & 2033
- Table 11: Global Smartcard MCU Industry Revenue Million Forecast, by End-user Industry 2020 & 2033
- Table 12: Global Smartcard MCU Industry Revenue Million Forecast, by Country 2020 & 2033
- Table 13: Global Smartcard MCU Industry Revenue Million Forecast, by Product 2020 & 2033
- Table 14: Global Smartcard MCU Industry Revenue Million Forecast, by Functionality 2020 & 2033
- Table 15: Global Smartcard MCU Industry Revenue Million Forecast, by End-user Industry 2020 & 2033
- Table 16: Global Smartcard MCU Industry Revenue Million Forecast, by Country 2020 & 2033
- Table 17: Global Smartcard MCU Industry Revenue Million Forecast, by Product 2020 & 2033
- Table 18: Global Smartcard MCU Industry Revenue Million Forecast, by Functionality 2020 & 2033
- Table 19: Global Smartcard MCU Industry Revenue Million Forecast, by End-user Industry 2020 & 2033
- Table 20: Global Smartcard MCU Industry Revenue Million Forecast, by Country 2020 & 2033
- Table 21: Global Smartcard MCU Industry Revenue Million Forecast, by Product 2020 & 2033
- Table 22: Global Smartcard MCU Industry Revenue Million Forecast, by Functionality 2020 & 2033
- Table 23: Global Smartcard MCU Industry Revenue Million Forecast, by End-user Industry 2020 & 2033
- Table 24: Global Smartcard MCU Industry Revenue Million Forecast, by Country 2020 & 2033
- Table 25: Global Smartcard MCU Industry Revenue Million Forecast, by Product 2020 & 2033
- Table 26: Global Smartcard MCU Industry Revenue Million Forecast, by Functionality 2020 & 2033
- Table 27: Global Smartcard MCU Industry Revenue Million Forecast, by End-user Industry 2020 & 2033
- Table 28: Global Smartcard MCU Industry Revenue Million Forecast, by Country 2020 & 2033
Frequently Asked Questions
1. What is the projected Compound Annual Growth Rate (CAGR) of the Smartcard MCU Industry?
The projected CAGR is approximately 5.29%.
2. Which companies are prominent players in the Smartcard MCU Industry?
Key companies in the market include Giesecke+Devrient, Infineon Technologies AG, Microchip Technology Inc, NXP Semiconductors NV, Samsung Electronics Co Ltd*List Not Exhaustive, STMicroelectronics, Zilog Inc, Renesas Electronics Corporation, Idemia Group, Thales group.
3. What are the main segments of the Smartcard MCU Industry?
The market segments include Product, Functionality, End-user Industry.
4. Can you provide details about the market size?
The market size is estimated to be USD 3.32 Million as of 2022.
5. What are some drivers contributing to market growth?
Rapid Development of Digital Technologies; Increasing Investments by Governments in Transportation Systems.
6. What are the notable trends driving market growth?
BFSI to Witness the Growth.
7. Are there any restraints impacting market growth?
Higher Cost of Advanced Featured Vehicles.
8. Can you provide examples of recent developments in the market?
April 2023: STMicroelectronics introduced a selection of microcontrollers, which are built on the ARM7 (TM) Thumb(R) core family developed by ARM (LSE: ARM). This new range, known as the STR71xF series, offers a variety of communication interfaces, including I2C, SPI, UART, CAN, USB, HDLC, MMC, and Smart Card interfaces. STMicroelectronics emphasized its established presence in the market for 8- and 16-bit MCUs and expressed its intention to venture into the 32-bit domain with this ARM-based family.
9. What pricing options are available for accessing the report?
Pricing options include single-user, multi-user, and enterprise licenses priced at USD 4750, USD 5250, and USD 8750 respectively.
10. Is the market size provided in terms of value or volume?
The market size is provided in terms of value, measured in Million.
11. Are there any specific market keywords associated with the report?
Yes, the market keyword associated with the report is "Smartcard MCU Industry," which aids in identifying and referencing the specific market segment covered.
12. How do I determine which pricing option suits my needs best?
The pricing options vary based on user requirements and access needs. Individual users may opt for single-user licenses, while businesses requiring broader access may choose multi-user or enterprise licenses for cost-effective access to the report.
13. Are there any additional resources or data provided in the Smartcard MCU Industry report?
While the report offers comprehensive insights, it's advisable to review the specific contents or supplementary materials provided to ascertain if additional resources or data are available.
14. How can I stay updated on further developments or reports in the Smartcard MCU Industry?
To stay informed about further developments, trends, and reports in the Smartcard MCU Industry, consider subscribing to industry newsletters, following relevant companies and organizations, or regularly checking reputable industry news sources and publications.
Methodology
Step 1 - Identification of Relevant Samples Size from Population Database


Step 2 - Approaches for Defining Global Market Size (Value, Volume* & Price*)

Note*: In applicable scenarios
Step 3 - Data Sources
Primary Research
- Web Analytics
- Survey Reports
- Research Institute
- Latest Research Reports
- Opinion Leaders
Secondary Research
- Annual Reports
- White Paper
- Latest Press Release
- Industry Association
- Paid Database
- Investor Presentations

Step 4 - Data Triangulation
Involves using different sources of information in order to increase the validity of a study
These sources are likely to be stakeholders in a program - participants, other researchers, program staff, other community members, and so on.
Then we put all data in single framework & apply various statistical tools to find out the dynamic on the market.
During the analysis stage, feedback from the stakeholder groups would be compared to determine areas of agreement as well as areas of divergence