

Key Insights
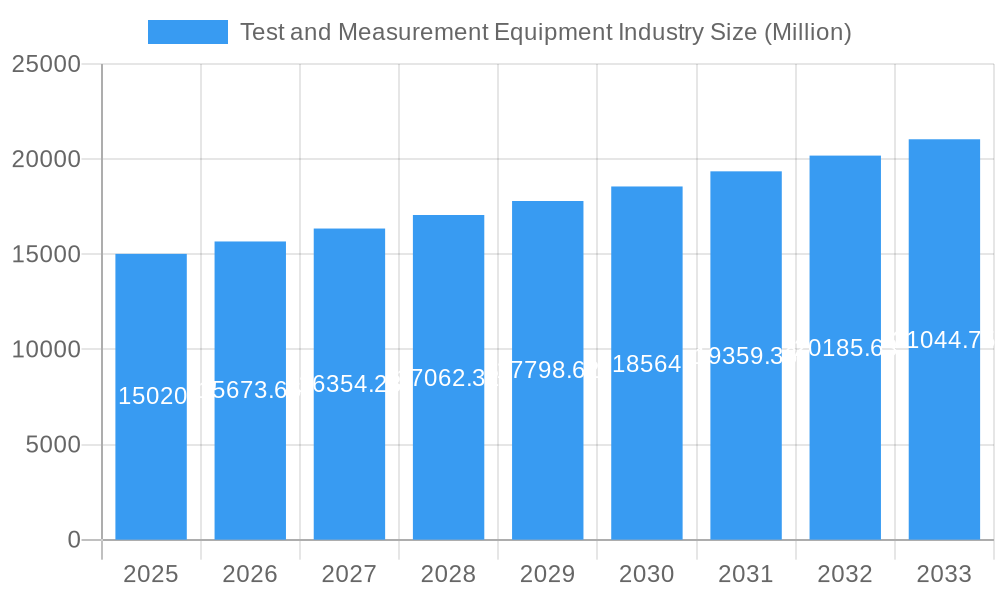
The Test and Measurement Equipment (T&M) market, valued at $15.02 billion in 2025, is projected to experience robust growth, driven by a compound annual growth rate (CAGR) of 4.29% from 2025 to 2033. This expansion is fueled by several key factors. The increasing demand for advanced electronics across diverse sectors, including semiconductors, communications, and automotive (particularly electric vehicles), necessitates sophisticated testing solutions to ensure product quality and reliability. Furthermore, the proliferation of IoT devices and the rise of 5G technology are creating new testing requirements, stimulating market growth. Automation in manufacturing and the adoption of Industry 4.0 principles are also contributing factors, as automated test equipment (ATE) improves efficiency and reduces costs. While certain regional variations might exist due to economic fluctuations or technological adoption rates, overall market expansion is anticipated to be relatively consistent across various geographical segments. Specific growth drivers differ across segments; for instance, the semiconductor segment is expected to see particularly strong growth given the global chip shortage and continuous demand for high-performance computing.
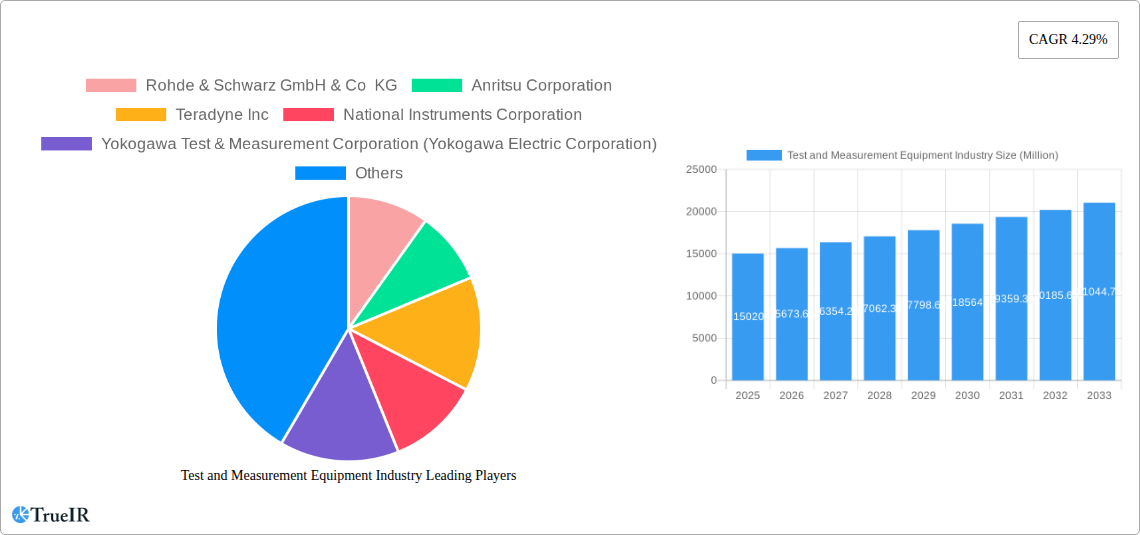
Test and Measurement Equipment Industry Market Size (In Billion)
The market segmentation reveals significant opportunities within specific product types and end-user industries. Semiconductor ATE, RF test equipment, and digital test equipment are key segments showing strong growth potential. Among end-users, the communication, semiconductor and computing, and automotive industries (especially electric vehicles) are projected to drive considerable market demand. However, potential restraints include the cyclical nature of the electronics industry, price fluctuations of raw materials, and the ongoing global economic climate. Despite these potential headwinds, the long-term outlook remains positive due to the continuing technological advancements in electronics and the increasing complexity of electronic devices, demanding more sophisticated and precise test and measurement solutions. Competitive landscape analysis indicates significant opportunities for established players to leverage their expertise and expand their market share, while new entrants may find success by specializing in niche applications or emerging technologies.
Test and Measurement Equipment Industry Company Market Share
Test and Measurement Equipment Industry Market Report: 2019-2033
This comprehensive report provides a detailed analysis of the Test and Measurement Equipment industry, encompassing market size, competitive landscape, technological advancements, and future growth prospects. With a study period spanning 2019-2033, a base year of 2025, and a forecast period of 2025-2033, this report offers invaluable insights for industry stakeholders, investors, and researchers. The report leverages high-volume keywords to enhance search visibility and provide a dynamic overview of this rapidly evolving market expected to reach xx Million by 2033.
Test and Measurement Equipment Industry Market Structure & Competitive Landscape
The Test and Measurement Equipment market is characterized by a moderately concentrated landscape, with a handful of major players holding significant market share. The Herfindahl-Hirschman Index (HHI) for the industry in 2024 is estimated at xx, indicating a moderately concentrated market. Innovation is a key driver, with companies continuously investing in R&D to develop advanced technologies. Regulatory compliance, particularly in sectors like aerospace and defense, plays a crucial role, shaping product development and market access. Product substitutes are limited, although software-based solutions are increasingly challenging traditional hardware-based test equipment.
The market is segmented by end-user industry, with key segments including communications, semiconductors and computing, aerospace and defense, consumer electronics, electric vehicles (EVs), and others. M&A activity is significant, driven by the desire to expand market reach, acquire technological expertise, and consolidate market share. The volume of M&A deals in the past five years is estimated at xx, with an average deal size of xx Million. Key qualitative insights include:
- High Barriers to Entry: Significant capital investment and specialized expertise are required for new entrants.
- Intense Competition: Established players compete fiercely on price, innovation, and service offerings.
- Growing Demand for Specialized Solutions: The market is increasingly segmented, with specialized equipment being developed for specific applications.
- Focus on Automation and AI: Industry trends towards automation and AI integration are reshaping the market.
Test and Measurement Equipment Industry Market Trends & Opportunities
The global Test and Measurement Equipment market exhibited robust growth during the historical period (2019-2024), reaching xx Million in 2024. The market is projected to experience a Compound Annual Growth Rate (CAGR) of xx% during the forecast period (2025-2033), driven by several key trends. Technological advancements, particularly in areas like 5G, IoT, and AI, are creating new demands for sophisticated test and measurement equipment. Increased adoption of automation and cloud-based solutions is streamlining testing processes and reducing costs. Consumer preference for high-quality, reliable products fuels demand in diverse end-user industries. Intense competition among major players is pushing innovation and improving product offerings. Market penetration rates for advanced testing solutions are growing steadily, particularly in the rapidly expanding semiconductor and EV sectors. The overall market size is projected to reach xx Million by 2033.
Dominant Markets & Segments in Test and Measurement Equipment Industry
The Semiconductor and Computing segment is a cornerstone of the Test and Measurement (T&M) Equipment market, consistently driving a significant portion of global revenue. In 2024, this segment is projected to account for a substantial share, fueled by the relentless innovation and expansion within the electronics sector. Within the "By Type" segmentation, Semiconductor Automatic Test Equipment (ATE) stands out as the market leader. This dominance is directly attributable to the booming global semiconductor industry, characterized by increasing demand for advanced processors, memory chips, and integrated circuits across various applications like AI, IoT, and automotive electronics.
Geographically, North America and Asia-Pacific remain the leading regions for T&M equipment. However, the Asia-Pacific region is exhibiting a faster and more dynamic growth trajectory. This acceleration is largely driven by substantial investments in electronics manufacturing hubs, the expansion of 5G infrastructure, and the burgeoning digital economy within countries like China, South Korea, Taiwan, and India. These factors collectively create a robust demand for sophisticated testing solutions.
Key Growth Drivers:
- Ubiquitous 5G Network Expansion: The ongoing global deployment and evolution of 5G networks are a primary catalyst, significantly boosting the demand for Radio Frequency (RF) test equipment, oscilloscopes, and advanced digital test solutions required for verifying performance and ensuring compliance.
- Explosive Growth of the Semiconductor Industry: The relentless demand for semiconductors in everything from consumer electronics to critical infrastructure continues to fuel the need for advanced Semiconductor ATE, wafer testing equipment, and specialized measurement instruments that can handle increasingly complex chip designs and fabrication processes.
- The Electric Vehicle (EV) Revolution: The rapid adoption of electric vehicles is creating substantial new avenues for T&M equipment. This includes specialized testing for battery management systems, power electronics, charging infrastructure, and the integration of complex automotive sensors and control units.
- Government Initiatives and Infrastructure Investments: Strategic government investments in digital infrastructure, smart city projects, and advanced manufacturing across various nations are creating a ripple effect, boosting demand for T&M equipment across diverse end-user industries such as telecommunications, aerospace, defense, and industrial automation.
- Pervasive Technological Advancements: The continuous evolution of technologies like Artificial Intelligence (AI), Machine Learning (ML), the Internet of Things (IoT), and the metaverse necessitates the development and adoption of more sophisticated, versatile, and automated testing solutions to validate the performance, reliability, and security of these cutting-edge products and systems.
A thorough analysis of the market dynamics underscores a strong and direct correlation between global economic growth, technological advancement, and the escalating demand for high-precision, reliable, and integrated test and measurement equipment. Government policies and incentives aimed at fostering innovation and technological self-sufficiency are proving to be instrumental in driving industry growth, particularly within emerging economies seeking to establish robust technological ecosystems.
Test and Measurement Equipment Industry Product Analysis
Product innovation within the test and measurement (T&M) equipment industry is a continuous and dynamic process, primarily driven by an unyielding demand for enhanced accuracy, accelerated testing speeds, and deeper levels of automation. Modern T&M solutions are increasingly incorporating cutting-edge technologies such as Artificial Intelligence (AI) and Machine Learning (ML). These advanced capabilities enable sophisticated data analysis, predictive maintenance, and intelligent, automated testing workflows, leading to significant improvements in efficiency and insight. The paramount competitive advantage in this landscape is achieved by providing comprehensive, integrated solutions that are meticulously tailored to meet the specific, often complex, needs of diverse end-users. This is further amplified by offering robust and responsive after-sales support, coupled with deep technical expertise and application knowledge. This strategic focus on holistic solutions and specialized proficiency is a key differentiator that separates market leaders and innovators from other participants in the industry.
Key Drivers, Barriers & Challenges in Test and Measurement Equipment Industry
Key Drivers:
- Technological Advancements: The relentless pace of technological innovation, particularly the widespread adoption of Artificial Intelligence (AI), automation, and advanced signal processing techniques, is a significant driver. These advancements not only enhance the capabilities of T&M equipment but also lead to substantial efficiency gains and reduced testing times, directly impacting product development cycles.
- Growth in High-Tech Sectors: The robust expansion of critical high-tech industries such as semiconductors, electric vehicles (EVs), advanced telecommunications (5G and beyond), and the burgeoning aerospace and defense sectors creates a continuous and escalating demand for specialized, high-performance test equipment essential for R&D, production, and quality control.
- Stringent Regulatory Compliance: Evolving and increasingly stringent government regulations and industry standards across a multitude of sectors (e.g., automotive safety, medical device performance, telecommunications interoperability) necessitate the use of precise, reliable, and traceable test and measurement equipment to ensure product safety, efficacy, and market access.
Key Challenges:
- Supply Chain Vulnerabilities: Geopolitical uncertainties, trade disputes, and unforeseen events such as natural disasters or pandemics can severely disrupt global supply chains. These disruptions can lead to prolonged production delays, increased lead times, component shortages, and ultimately, inflated costs for raw materials and finished goods, impacting both manufacturers and end-users.
- Complex Regulatory Landscapes: Navigating the intricate and often country-specific regulatory compliance requirements across various industries and geographical markets presents a significant hurdle. Ensuring that T&M equipment meets all mandated standards adds complexity and cost to product development, certification, and global market entry.
- Intense Market Competition: The Test and Measurement Equipment industry is characterized by fierce competition, not only from established global players but also from agile emerging companies introducing innovative solutions. This competitive pressure significantly impacts pricing strategies and can lead to reduced profit margins, with projections indicating a potential decline in profit margins by up to 20% by 2030 if market dynamics remain unchanged.
Growth Drivers in the Test and Measurement Equipment Industry Market
Growth is driven by the increasing complexity of electronic devices, the demand for higher accuracy in testing, and the rise of new technologies such as 5G, IoT, and AI. Expansion of the semiconductor industry and increasing adoption of electric vehicles (EVs) are particularly strong growth drivers. Government investments in infrastructure and technological advancements also contribute significantly.
Challenges Impacting Test and Measurement Equipment Industry Growth
The Test and Measurement Equipment industry faces a multi-faceted set of challenges that can impede its growth trajectory. Supply chain vulnerabilities, exacerbated by global economic and geopolitical instability, coupled with rising raw material costs, create significant pressure on manufacturing operations and profitability. Furthermore, the imperative to meet increasingly stringent regulatory requirements across diverse sectors necessitates substantial investment in compliance and validation processes. Adding to these complexities is the challenge of navigating intense market competition, where differentiation through innovation and value-added services is crucial. These combined factors contribute to elevated production costs, can potentially limit the scope of market expansion, and demand agile strategic responses from industry participants.
Key Players Shaping the Test and Measurement Equipment Industry Market
- Rohde & Schwarz GmbH & Co KG
- Anritsu Corporation
- Teradyne Inc
- National Instruments Corporation
- Yokogawa Test & Measurement Corporation (Yokogawa Electric Corporation)
- Advantest Corporation
- Chauvin Arnoux Group
- Fortive Corporation
- Teledyne Lecroy (Teledyne Technologies Incorporated)
- Keysight Technologies Inc
Significant Test and Measurement Equipment Industry Milestones
- July 2023: Teradyne Unveils Archimedes Analytics Solution – This launch significantly improves semiconductor testing efficiency and analytics capabilities.
- June 2023: Microtest Group Completes Acquisition of Test Inspire – This acquisition strengthens the European semiconductor testing landscape.
Future Outlook for Test and Measurement Equipment Industry Market
The Test and Measurement Equipment market is poised for continued growth, driven by technological advancements, increased automation, and the expansion of key end-user industries. Strategic opportunities exist in developing specialized testing solutions for emerging technologies and expanding market reach in developing economies. The market’s strong fundamentals and growth potential make it an attractive sector for investment and further development.
Test and Measurement Equipment Industry Segmentation
-
1. Type
- 1.1. Semiconductor Automatic Test Equipment (ATE)
- 1.2. Radio Frequency (RF) Test Equipment
- 1.3. Digital Test Equipment
- 1.4. Electrical and Environmental Test
- 1.5. Data Acquisition (DAQ)
-
2. End-user Industry
- 2.1. Communications
- 2.2. Semiconductors and Computing
- 2.3. Aerospace and Defense
- 2.4. Consumer Electronics
- 2.5. Electric Vehicles (EVs)
- 2.6. Other End-user Industries
Test and Measurement Equipment Industry Segmentation By Geography
- 1. North America
- 2. Europe
- 3. Asia
- 4. Australia and New Zealand
- 5. Latin America
- 6. Middle East and Africa
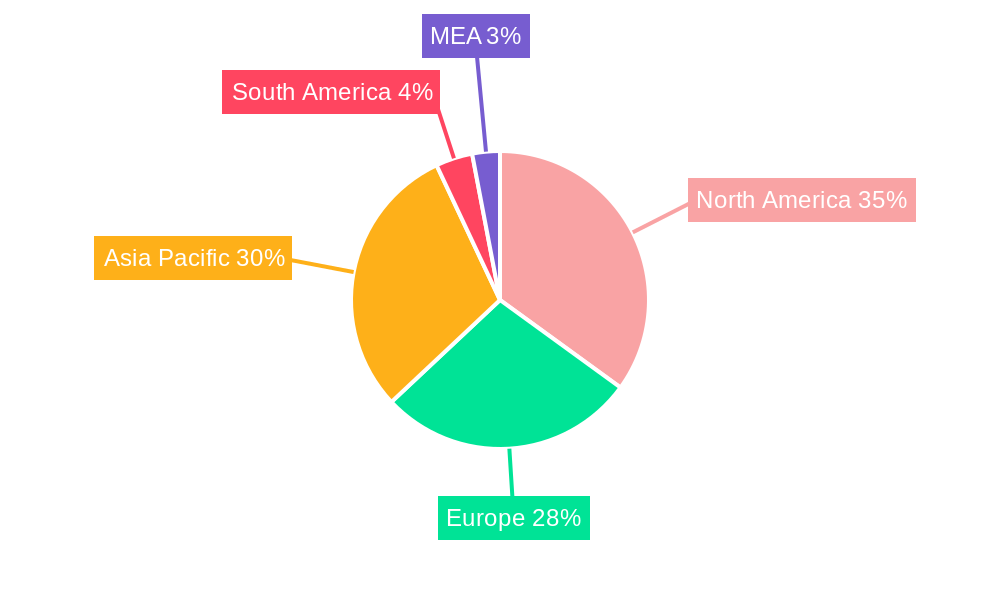
Test and Measurement Equipment Industry Regional Market Share
Geographic Coverage of Test and Measurement Equipment Industry
Test and Measurement Equipment Industry REPORT HIGHLIGHTS
| Aspects | Details |
|---|---|
| Study Period | 2020-2034 |
| Base Year | 2025 |
| Estimated Year | 2026 |
| Forecast Period | 2026-2034 |
| Historical Period | 2020-2025 |
| Growth Rate | CAGR of 4.29% from 2020-2034 |
| Segmentation |
|
Table of Contents
- 1. Introduction
- 1.1. Research Scope
- 1.2. Market Segmentation
- 1.3. Research Methodology
- 1.4. Definitions and Assumptions
- 2. Executive Summary
- 2.1. Introduction
- 3. Market Dynamics
- 3.1. Introduction
- 3.2. Market Drivers
- 3.2.1. Technological Advancements Leading to the need for Test and Measurement Equipment; Emerging Trend of Electric and Hybrid Vehicle
- 3.3. Market Restrains
- 3.3.1. Difficulty in Integrating Firewalls with Existing Network Infrastructure; Complexity of Deploying and Managing Firewalls due to Limited Expertise
- 3.4. Market Trends
- 3.4.1. Semiconductors and Computing to be the Largest End-user Industry
- 4. Market Factor Analysis
- 4.1. Porters Five Forces
- 4.2. Supply/Value Chain
- 4.3. PESTEL analysis
- 4.4. Market Entropy
- 4.5. Patent/Trademark Analysis
- 5. Global Test and Measurement Equipment Industry Analysis, Insights and Forecast, 2020-2032
- 5.1. Market Analysis, Insights and Forecast - by Type
- 5.1.1. Semiconductor Automatic Test Equipment (ATE)
- 5.1.2. Radio Frequency (RF) Test Equipment
- 5.1.3. Digital Test Equipment
- 5.1.4. Electrical and Environmental Test
- 5.1.5. Data Acquisition (DAQ)
- 5.2. Market Analysis, Insights and Forecast - by End-user Industry
- 5.2.1. Communications
- 5.2.2. Semiconductors and Computing
- 5.2.3. Aerospace and Defense
- 5.2.4. Consumer Electronics
- 5.2.5. Electric Vehicles (EVs)
- 5.2.6. Other End-user Industries
- 5.3. Market Analysis, Insights and Forecast - by Region
- 5.3.1. North America
- 5.3.2. Europe
- 5.3.3. Asia
- 5.3.4. Australia and New Zealand
- 5.3.5. Latin America
- 5.3.6. Middle East and Africa
- 5.1. Market Analysis, Insights and Forecast - by Type
- 6. North America Test and Measurement Equipment Industry Analysis, Insights and Forecast, 2020-2032
- 6.1. Market Analysis, Insights and Forecast - by Type
- 6.1.1. Semiconductor Automatic Test Equipment (ATE)
- 6.1.2. Radio Frequency (RF) Test Equipment
- 6.1.3. Digital Test Equipment
- 6.1.4. Electrical and Environmental Test
- 6.1.5. Data Acquisition (DAQ)
- 6.2. Market Analysis, Insights and Forecast - by End-user Industry
- 6.2.1. Communications
- 6.2.2. Semiconductors and Computing
- 6.2.3. Aerospace and Defense
- 6.2.4. Consumer Electronics
- 6.2.5. Electric Vehicles (EVs)
- 6.2.6. Other End-user Industries
- 6.1. Market Analysis, Insights and Forecast - by Type
- 7. Europe Test and Measurement Equipment Industry Analysis, Insights and Forecast, 2020-2032
- 7.1. Market Analysis, Insights and Forecast - by Type
- 7.1.1. Semiconductor Automatic Test Equipment (ATE)
- 7.1.2. Radio Frequency (RF) Test Equipment
- 7.1.3. Digital Test Equipment
- 7.1.4. Electrical and Environmental Test
- 7.1.5. Data Acquisition (DAQ)
- 7.2. Market Analysis, Insights and Forecast - by End-user Industry
- 7.2.1. Communications
- 7.2.2. Semiconductors and Computing
- 7.2.3. Aerospace and Defense
- 7.2.4. Consumer Electronics
- 7.2.5. Electric Vehicles (EVs)
- 7.2.6. Other End-user Industries
- 7.1. Market Analysis, Insights and Forecast - by Type
- 8. Asia Test and Measurement Equipment Industry Analysis, Insights and Forecast, 2020-2032
- 8.1. Market Analysis, Insights and Forecast - by Type
- 8.1.1. Semiconductor Automatic Test Equipment (ATE)
- 8.1.2. Radio Frequency (RF) Test Equipment
- 8.1.3. Digital Test Equipment
- 8.1.4. Electrical and Environmental Test
- 8.1.5. Data Acquisition (DAQ)
- 8.2. Market Analysis, Insights and Forecast - by End-user Industry
- 8.2.1. Communications
- 8.2.2. Semiconductors and Computing
- 8.2.3. Aerospace and Defense
- 8.2.4. Consumer Electronics
- 8.2.5. Electric Vehicles (EVs)
- 8.2.6. Other End-user Industries
- 8.1. Market Analysis, Insights and Forecast - by Type
- 9. Australia and New Zealand Test and Measurement Equipment Industry Analysis, Insights and Forecast, 2020-2032
- 9.1. Market Analysis, Insights and Forecast - by Type
- 9.1.1. Semiconductor Automatic Test Equipment (ATE)
- 9.1.2. Radio Frequency (RF) Test Equipment
- 9.1.3. Digital Test Equipment
- 9.1.4. Electrical and Environmental Test
- 9.1.5. Data Acquisition (DAQ)
- 9.2. Market Analysis, Insights and Forecast - by End-user Industry
- 9.2.1. Communications
- 9.2.2. Semiconductors and Computing
- 9.2.3. Aerospace and Defense
- 9.2.4. Consumer Electronics
- 9.2.5. Electric Vehicles (EVs)
- 9.2.6. Other End-user Industries
- 9.1. Market Analysis, Insights and Forecast - by Type
- 10. Latin America Test and Measurement Equipment Industry Analysis, Insights and Forecast, 2020-2032
- 10.1. Market Analysis, Insights and Forecast - by Type
- 10.1.1. Semiconductor Automatic Test Equipment (ATE)
- 10.1.2. Radio Frequency (RF) Test Equipment
- 10.1.3. Digital Test Equipment
- 10.1.4. Electrical and Environmental Test
- 10.1.5. Data Acquisition (DAQ)
- 10.2. Market Analysis, Insights and Forecast - by End-user Industry
- 10.2.1. Communications
- 10.2.2. Semiconductors and Computing
- 10.2.3. Aerospace and Defense
- 10.2.4. Consumer Electronics
- 10.2.5. Electric Vehicles (EVs)
- 10.2.6. Other End-user Industries
- 10.1. Market Analysis, Insights and Forecast - by Type
- 11. Middle East and Africa Test and Measurement Equipment Industry Analysis, Insights and Forecast, 2020-2032
- 11.1. Market Analysis, Insights and Forecast - by Type
- 11.1.1. Semiconductor Automatic Test Equipment (ATE)
- 11.1.2. Radio Frequency (RF) Test Equipment
- 11.1.3. Digital Test Equipment
- 11.1.4. Electrical and Environmental Test
- 11.1.5. Data Acquisition (DAQ)
- 11.2. Market Analysis, Insights and Forecast - by End-user Industry
- 11.2.1. Communications
- 11.2.2. Semiconductors and Computing
- 11.2.3. Aerospace and Defense
- 11.2.4. Consumer Electronics
- 11.2.5. Electric Vehicles (EVs)
- 11.2.6. Other End-user Industries
- 11.1. Market Analysis, Insights and Forecast - by Type
- 12. Competitive Analysis
- 12.1. Global Market Share Analysis 2025
- 12.2. Company Profiles
- 12.2.1 Rohde & Schwarz GmbH & Co KG
- 12.2.1.1. Overview
- 12.2.1.2. Products
- 12.2.1.3. SWOT Analysis
- 12.2.1.4. Recent Developments
- 12.2.1.5. Financials (Based on Availability)
- 12.2.2 Anritsu Corporation
- 12.2.2.1. Overview
- 12.2.2.2. Products
- 12.2.2.3. SWOT Analysis
- 12.2.2.4. Recent Developments
- 12.2.2.5. Financials (Based on Availability)
- 12.2.3 Teradyne Inc
- 12.2.3.1. Overview
- 12.2.3.2. Products
- 12.2.3.3. SWOT Analysis
- 12.2.3.4. Recent Developments
- 12.2.3.5. Financials (Based on Availability)
- 12.2.4 National Instruments Corporation
- 12.2.4.1. Overview
- 12.2.4.2. Products
- 12.2.4.3. SWOT Analysis
- 12.2.4.4. Recent Developments
- 12.2.4.5. Financials (Based on Availability)
- 12.2.5 Yokogawa Test & Measurement Corporation (Yokogawa Electric Corporation)
- 12.2.5.1. Overview
- 12.2.5.2. Products
- 12.2.5.3. SWOT Analysis
- 12.2.5.4. Recent Developments
- 12.2.5.5. Financials (Based on Availability)
- 12.2.6 Advantest Corporatio
- 12.2.6.1. Overview
- 12.2.6.2. Products
- 12.2.6.3. SWOT Analysis
- 12.2.6.4. Recent Developments
- 12.2.6.5. Financials (Based on Availability)
- 12.2.7 Chauvin Arnoux Group
- 12.2.7.1. Overview
- 12.2.7.2. Products
- 12.2.7.3. SWOT Analysis
- 12.2.7.4. Recent Developments
- 12.2.7.5. Financials (Based on Availability)
- 12.2.8 Fortive Corporation
- 12.2.8.1. Overview
- 12.2.8.2. Products
- 12.2.8.3. SWOT Analysis
- 12.2.8.4. Recent Developments
- 12.2.8.5. Financials (Based on Availability)
- 12.2.9 Teledyne Lecroy (Teledyne Technologies Incorporated)
- 12.2.9.1. Overview
- 12.2.9.2. Products
- 12.2.9.3. SWOT Analysis
- 12.2.9.4. Recent Developments
- 12.2.9.5. Financials (Based on Availability)
- 12.2.10 Keysight Technologies Inc
- 12.2.10.1. Overview
- 12.2.10.2. Products
- 12.2.10.3. SWOT Analysis
- 12.2.10.4. Recent Developments
- 12.2.10.5. Financials (Based on Availability)
- 12.2.1 Rohde & Schwarz GmbH & Co KG
List of Figures
- Figure 1: Global Test and Measurement Equipment Industry Revenue Breakdown (Million, %) by Region 2025 & 2033
- Figure 2: Global Test and Measurement Equipment Industry Volume Breakdown (K Unit, %) by Region 2025 & 2033
- Figure 3: North America Test and Measurement Equipment Industry Revenue (Million), by Type 2025 & 2033
- Figure 4: North America Test and Measurement Equipment Industry Volume (K Unit), by Type 2025 & 2033
- Figure 5: North America Test and Measurement Equipment Industry Revenue Share (%), by Type 2025 & 2033
- Figure 6: North America Test and Measurement Equipment Industry Volume Share (%), by Type 2025 & 2033
- Figure 7: North America Test and Measurement Equipment Industry Revenue (Million), by End-user Industry 2025 & 2033
- Figure 8: North America Test and Measurement Equipment Industry Volume (K Unit), by End-user Industry 2025 & 2033
- Figure 9: North America Test and Measurement Equipment Industry Revenue Share (%), by End-user Industry 2025 & 2033
- Figure 10: North America Test and Measurement Equipment Industry Volume Share (%), by End-user Industry 2025 & 2033
- Figure 11: North America Test and Measurement Equipment Industry Revenue (Million), by Country 2025 & 2033
- Figure 12: North America Test and Measurement Equipment Industry Volume (K Unit), by Country 2025 & 2033
- Figure 13: North America Test and Measurement Equipment Industry Revenue Share (%), by Country 2025 & 2033
- Figure 14: North America Test and Measurement Equipment Industry Volume Share (%), by Country 2025 & 2033
- Figure 15: Europe Test and Measurement Equipment Industry Revenue (Million), by Type 2025 & 2033
- Figure 16: Europe Test and Measurement Equipment Industry Volume (K Unit), by Type 2025 & 2033
- Figure 17: Europe Test and Measurement Equipment Industry Revenue Share (%), by Type 2025 & 2033
- Figure 18: Europe Test and Measurement Equipment Industry Volume Share (%), by Type 2025 & 2033
- Figure 19: Europe Test and Measurement Equipment Industry Revenue (Million), by End-user Industry 2025 & 2033
- Figure 20: Europe Test and Measurement Equipment Industry Volume (K Unit), by End-user Industry 2025 & 2033
- Figure 21: Europe Test and Measurement Equipment Industry Revenue Share (%), by End-user Industry 2025 & 2033
- Figure 22: Europe Test and Measurement Equipment Industry Volume Share (%), by End-user Industry 2025 & 2033
- Figure 23: Europe Test and Measurement Equipment Industry Revenue (Million), by Country 2025 & 2033
- Figure 24: Europe Test and Measurement Equipment Industry Volume (K Unit), by Country 2025 & 2033
- Figure 25: Europe Test and Measurement Equipment Industry Revenue Share (%), by Country 2025 & 2033
- Figure 26: Europe Test and Measurement Equipment Industry Volume Share (%), by Country 2025 & 2033
- Figure 27: Asia Test and Measurement Equipment Industry Revenue (Million), by Type 2025 & 2033
- Figure 28: Asia Test and Measurement Equipment Industry Volume (K Unit), by Type 2025 & 2033
- Figure 29: Asia Test and Measurement Equipment Industry Revenue Share (%), by Type 2025 & 2033
- Figure 30: Asia Test and Measurement Equipment Industry Volume Share (%), by Type 2025 & 2033
- Figure 31: Asia Test and Measurement Equipment Industry Revenue (Million), by End-user Industry 2025 & 2033
- Figure 32: Asia Test and Measurement Equipment Industry Volume (K Unit), by End-user Industry 2025 & 2033
- Figure 33: Asia Test and Measurement Equipment Industry Revenue Share (%), by End-user Industry 2025 & 2033
- Figure 34: Asia Test and Measurement Equipment Industry Volume Share (%), by End-user Industry 2025 & 2033
- Figure 35: Asia Test and Measurement Equipment Industry Revenue (Million), by Country 2025 & 2033
- Figure 36: Asia Test and Measurement Equipment Industry Volume (K Unit), by Country 2025 & 2033
- Figure 37: Asia Test and Measurement Equipment Industry Revenue Share (%), by Country 2025 & 2033
- Figure 38: Asia Test and Measurement Equipment Industry Volume Share (%), by Country 2025 & 2033
- Figure 39: Australia and New Zealand Test and Measurement Equipment Industry Revenue (Million), by Type 2025 & 2033
- Figure 40: Australia and New Zealand Test and Measurement Equipment Industry Volume (K Unit), by Type 2025 & 2033
- Figure 41: Australia and New Zealand Test and Measurement Equipment Industry Revenue Share (%), by Type 2025 & 2033
- Figure 42: Australia and New Zealand Test and Measurement Equipment Industry Volume Share (%), by Type 2025 & 2033
- Figure 43: Australia and New Zealand Test and Measurement Equipment Industry Revenue (Million), by End-user Industry 2025 & 2033
- Figure 44: Australia and New Zealand Test and Measurement Equipment Industry Volume (K Unit), by End-user Industry 2025 & 2033
- Figure 45: Australia and New Zealand Test and Measurement Equipment Industry Revenue Share (%), by End-user Industry 2025 & 2033
- Figure 46: Australia and New Zealand Test and Measurement Equipment Industry Volume Share (%), by End-user Industry 2025 & 2033
- Figure 47: Australia and New Zealand Test and Measurement Equipment Industry Revenue (Million), by Country 2025 & 2033
- Figure 48: Australia and New Zealand Test and Measurement Equipment Industry Volume (K Unit), by Country 2025 & 2033
- Figure 49: Australia and New Zealand Test and Measurement Equipment Industry Revenue Share (%), by Country 2025 & 2033
- Figure 50: Australia and New Zealand Test and Measurement Equipment Industry Volume Share (%), by Country 2025 & 2033
- Figure 51: Latin America Test and Measurement Equipment Industry Revenue (Million), by Type 2025 & 2033
- Figure 52: Latin America Test and Measurement Equipment Industry Volume (K Unit), by Type 2025 & 2033
- Figure 53: Latin America Test and Measurement Equipment Industry Revenue Share (%), by Type 2025 & 2033
- Figure 54: Latin America Test and Measurement Equipment Industry Volume Share (%), by Type 2025 & 2033
- Figure 55: Latin America Test and Measurement Equipment Industry Revenue (Million), by End-user Industry 2025 & 2033
- Figure 56: Latin America Test and Measurement Equipment Industry Volume (K Unit), by End-user Industry 2025 & 2033
- Figure 57: Latin America Test and Measurement Equipment Industry Revenue Share (%), by End-user Industry 2025 & 2033
- Figure 58: Latin America Test and Measurement Equipment Industry Volume Share (%), by End-user Industry 2025 & 2033
- Figure 59: Latin America Test and Measurement Equipment Industry Revenue (Million), by Country 2025 & 2033
- Figure 60: Latin America Test and Measurement Equipment Industry Volume (K Unit), by Country 2025 & 2033
- Figure 61: Latin America Test and Measurement Equipment Industry Revenue Share (%), by Country 2025 & 2033
- Figure 62: Latin America Test and Measurement Equipment Industry Volume Share (%), by Country 2025 & 2033
- Figure 63: Middle East and Africa Test and Measurement Equipment Industry Revenue (Million), by Type 2025 & 2033
- Figure 64: Middle East and Africa Test and Measurement Equipment Industry Volume (K Unit), by Type 2025 & 2033
- Figure 65: Middle East and Africa Test and Measurement Equipment Industry Revenue Share (%), by Type 2025 & 2033
- Figure 66: Middle East and Africa Test and Measurement Equipment Industry Volume Share (%), by Type 2025 & 2033
- Figure 67: Middle East and Africa Test and Measurement Equipment Industry Revenue (Million), by End-user Industry 2025 & 2033
- Figure 68: Middle East and Africa Test and Measurement Equipment Industry Volume (K Unit), by End-user Industry 2025 & 2033
- Figure 69: Middle East and Africa Test and Measurement Equipment Industry Revenue Share (%), by End-user Industry 2025 & 2033
- Figure 70: Middle East and Africa Test and Measurement Equipment Industry Volume Share (%), by End-user Industry 2025 & 2033
- Figure 71: Middle East and Africa Test and Measurement Equipment Industry Revenue (Million), by Country 2025 & 2033
- Figure 72: Middle East and Africa Test and Measurement Equipment Industry Volume (K Unit), by Country 2025 & 2033
- Figure 73: Middle East and Africa Test and Measurement Equipment Industry Revenue Share (%), by Country 2025 & 2033
- Figure 74: Middle East and Africa Test and Measurement Equipment Industry Volume Share (%), by Country 2025 & 2033
List of Tables
- Table 1: Global Test and Measurement Equipment Industry Revenue Million Forecast, by Type 2020 & 2033
- Table 2: Global Test and Measurement Equipment Industry Volume K Unit Forecast, by Type 2020 & 2033
- Table 3: Global Test and Measurement Equipment Industry Revenue Million Forecast, by End-user Industry 2020 & 2033
- Table 4: Global Test and Measurement Equipment Industry Volume K Unit Forecast, by End-user Industry 2020 & 2033
- Table 5: Global Test and Measurement Equipment Industry Revenue Million Forecast, by Region 2020 & 2033
- Table 6: Global Test and Measurement Equipment Industry Volume K Unit Forecast, by Region 2020 & 2033
- Table 7: Global Test and Measurement Equipment Industry Revenue Million Forecast, by Type 2020 & 2033
- Table 8: Global Test and Measurement Equipment Industry Volume K Unit Forecast, by Type 2020 & 2033
- Table 9: Global Test and Measurement Equipment Industry Revenue Million Forecast, by End-user Industry 2020 & 2033
- Table 10: Global Test and Measurement Equipment Industry Volume K Unit Forecast, by End-user Industry 2020 & 2033
- Table 11: Global Test and Measurement Equipment Industry Revenue Million Forecast, by Country 2020 & 2033
- Table 12: Global Test and Measurement Equipment Industry Volume K Unit Forecast, by Country 2020 & 2033
- Table 13: Global Test and Measurement Equipment Industry Revenue Million Forecast, by Type 2020 & 2033
- Table 14: Global Test and Measurement Equipment Industry Volume K Unit Forecast, by Type 2020 & 2033
- Table 15: Global Test and Measurement Equipment Industry Revenue Million Forecast, by End-user Industry 2020 & 2033
- Table 16: Global Test and Measurement Equipment Industry Volume K Unit Forecast, by End-user Industry 2020 & 2033
- Table 17: Global Test and Measurement Equipment Industry Revenue Million Forecast, by Country 2020 & 2033
- Table 18: Global Test and Measurement Equipment Industry Volume K Unit Forecast, by Country 2020 & 2033
- Table 19: Global Test and Measurement Equipment Industry Revenue Million Forecast, by Type 2020 & 2033
- Table 20: Global Test and Measurement Equipment Industry Volume K Unit Forecast, by Type 2020 & 2033
- Table 21: Global Test and Measurement Equipment Industry Revenue Million Forecast, by End-user Industry 2020 & 2033
- Table 22: Global Test and Measurement Equipment Industry Volume K Unit Forecast, by End-user Industry 2020 & 2033
- Table 23: Global Test and Measurement Equipment Industry Revenue Million Forecast, by Country 2020 & 2033
- Table 24: Global Test and Measurement Equipment Industry Volume K Unit Forecast, by Country 2020 & 2033
- Table 25: Global Test and Measurement Equipment Industry Revenue Million Forecast, by Type 2020 & 2033
- Table 26: Global Test and Measurement Equipment Industry Volume K Unit Forecast, by Type 2020 & 2033
- Table 27: Global Test and Measurement Equipment Industry Revenue Million Forecast, by End-user Industry 2020 & 2033
- Table 28: Global Test and Measurement Equipment Industry Volume K Unit Forecast, by End-user Industry 2020 & 2033
- Table 29: Global Test and Measurement Equipment Industry Revenue Million Forecast, by Country 2020 & 2033
- Table 30: Global Test and Measurement Equipment Industry Volume K Unit Forecast, by Country 2020 & 2033
- Table 31: Global Test and Measurement Equipment Industry Revenue Million Forecast, by Type 2020 & 2033
- Table 32: Global Test and Measurement Equipment Industry Volume K Unit Forecast, by Type 2020 & 2033
- Table 33: Global Test and Measurement Equipment Industry Revenue Million Forecast, by End-user Industry 2020 & 2033
- Table 34: Global Test and Measurement Equipment Industry Volume K Unit Forecast, by End-user Industry 2020 & 2033
- Table 35: Global Test and Measurement Equipment Industry Revenue Million Forecast, by Country 2020 & 2033
- Table 36: Global Test and Measurement Equipment Industry Volume K Unit Forecast, by Country 2020 & 2033
- Table 37: Global Test and Measurement Equipment Industry Revenue Million Forecast, by Type 2020 & 2033
- Table 38: Global Test and Measurement Equipment Industry Volume K Unit Forecast, by Type 2020 & 2033
- Table 39: Global Test and Measurement Equipment Industry Revenue Million Forecast, by End-user Industry 2020 & 2033
- Table 40: Global Test and Measurement Equipment Industry Volume K Unit Forecast, by End-user Industry 2020 & 2033
- Table 41: Global Test and Measurement Equipment Industry Revenue Million Forecast, by Country 2020 & 2033
- Table 42: Global Test and Measurement Equipment Industry Volume K Unit Forecast, by Country 2020 & 2033
Frequently Asked Questions
1. What is the projected Compound Annual Growth Rate (CAGR) of the Test and Measurement Equipment Industry?
The projected CAGR is approximately 4.29%.
2. Which companies are prominent players in the Test and Measurement Equipment Industry?
Key companies in the market include Rohde & Schwarz GmbH & Co KG, Anritsu Corporation, Teradyne Inc, National Instruments Corporation, Yokogawa Test & Measurement Corporation (Yokogawa Electric Corporation), Advantest Corporatio, Chauvin Arnoux Group, Fortive Corporation, Teledyne Lecroy (Teledyne Technologies Incorporated), Keysight Technologies Inc.
3. What are the main segments of the Test and Measurement Equipment Industry?
The market segments include Type, End-user Industry.
4. Can you provide details about the market size?
The market size is estimated to be USD 15.02 Million as of 2022.
5. What are some drivers contributing to market growth?
Technological Advancements Leading to the need for Test and Measurement Equipment; Emerging Trend of Electric and Hybrid Vehicle.
6. What are the notable trends driving market growth?
Semiconductors and Computing to be the Largest End-user Industry.
7. Are there any restraints impacting market growth?
Difficulty in Integrating Firewalls with Existing Network Infrastructure; Complexity of Deploying and Managing Firewalls due to Limited Expertise.
8. Can you provide examples of recent developments in the market?
July 2023: Teradyne Unveils Archimedes Analytics Solution officially launched the Teradyne Archimedes Analytics Solution, a groundbreaking open architecture that introduces real-time analytics into semiconductor testing. This innovation streamlines test processes, enhances yield rates, and reduces costs, all while mitigating security concerns associated with cloud-based alternatives. With the semiconductor industry witnessing a growing demand for high-quality devices employing advanced processes, comprehensive test and analytics solutions have become indispensable.
9. What pricing options are available for accessing the report?
Pricing options include single-user, multi-user, and enterprise licenses priced at USD 4750, USD 5250, and USD 8750 respectively.
10. Is the market size provided in terms of value or volume?
The market size is provided in terms of value, measured in Million and volume, measured in K Unit.
11. Are there any specific market keywords associated with the report?
Yes, the market keyword associated with the report is "Test and Measurement Equipment Industry," which aids in identifying and referencing the specific market segment covered.
12. How do I determine which pricing option suits my needs best?
The pricing options vary based on user requirements and access needs. Individual users may opt for single-user licenses, while businesses requiring broader access may choose multi-user or enterprise licenses for cost-effective access to the report.
13. Are there any additional resources or data provided in the Test and Measurement Equipment Industry report?
While the report offers comprehensive insights, it's advisable to review the specific contents or supplementary materials provided to ascertain if additional resources or data are available.
14. How can I stay updated on further developments or reports in the Test and Measurement Equipment Industry?
To stay informed about further developments, trends, and reports in the Test and Measurement Equipment Industry, consider subscribing to industry newsletters, following relevant companies and organizations, or regularly checking reputable industry news sources and publications.
Methodology
Step 1 - Identification of Relevant Samples Size from Population Database


Step 2 - Approaches for Defining Global Market Size (Value, Volume* & Price*)

Note*: In applicable scenarios
Step 3 - Data Sources
Primary Research
- Web Analytics
- Survey Reports
- Research Institute
- Latest Research Reports
- Opinion Leaders
Secondary Research
- Annual Reports
- White Paper
- Latest Press Release
- Industry Association
- Paid Database
- Investor Presentations

Step 4 - Data Triangulation
Involves using different sources of information in order to increase the validity of a study
These sources are likely to be stakeholders in a program - participants, other researchers, program staff, other community members, and so on.
Then we put all data in single framework & apply various statistical tools to find out the dynamic on the market.
During the analysis stage, feedback from the stakeholder groups would be compared to determine areas of agreement as well as areas of divergence