

Key Insights
The U.S. Over-the-Top (OTT) media services market, valued at $56.61 billion in 2025, is experiencing robust growth, projected to expand at a Compound Annual Growth Rate (CAGR) of 12.56% from 2025 to 2033. This surge is driven primarily by the increasing adoption of streaming services across diverse demographics, fueled by the convenience and affordability they offer compared to traditional cable television. Factors such as the rise of high-speed internet penetration, the proliferation of smart TVs and mobile devices capable of streaming content, and the increasing demand for on-demand and personalized viewing experiences are significant contributors to this growth. The market's segmentation, with prominent players such as Netflix, Disney+, Amazon Prime Video, and Hulu dominating the SVOD (Subscription Video on Demand) segment, reflects the diverse range of content and pricing models appealing to different consumer preferences. Competition is fierce, prompting continuous innovation in content creation, user interface design, and personalized recommendations to retain and attract subscribers. While potential restraints include concerns about content piracy and increasing internet data costs, the overall market trajectory remains positive, indicating significant future growth potential.
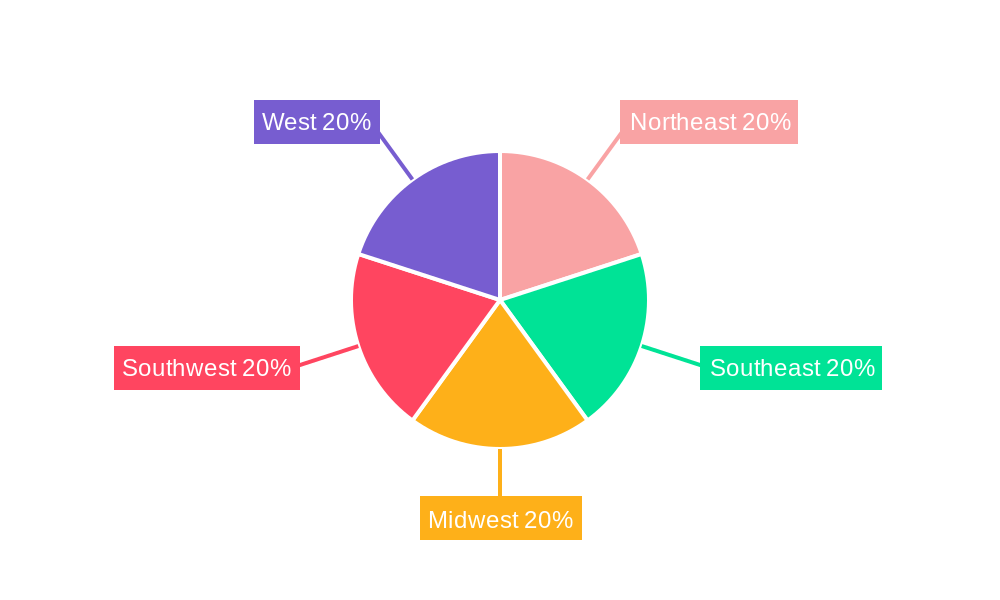
The regional distribution within the U.S. market shows a relatively even spread across the Northeast, Southeast, Midwest, Southwest, and West regions. However, population density and varying levels of internet penetration may subtly influence regional variations in adoption rates. Future market expansion will likely be driven by advancements in streaming technologies such as 4K and 8K resolution, increased investment in original programming, and the integration of interactive elements and immersive viewing experiences. The AVOD (Advertising-based Video on Demand) segment is anticipated to grow significantly due to its freemium model, attracting a broader audience base. The strategic partnerships and mergers and acquisitions among industry players will continue to shape the competitive landscape and further fuel market expansion. The long-term outlook for the U.S. OTT market remains exceptionally strong, presenting lucrative opportunities for established players and emerging entrants alike.

U.S. OTT Industry Market Report: 2019-2033 Forecast
This comprehensive report provides a deep dive into the dynamic U.S. Over-the-Top (OTT) industry, offering invaluable insights for industry stakeholders, investors, and strategists. Analyzing the period from 2019 to 2033, with a focus on 2025, this report unveils the market's current state, future trajectory, and key players shaping its evolution. Expect detailed analysis of market size, growth drivers, challenges, competitive landscape, and significant industry milestones. Download now to gain a competitive edge.
U.S. OTT Industry Market Structure & Competitive Landscape
This section analyzes the structure and competitive dynamics of the U.S. OTT market from 2019-2024 and projects trends through 2033. The market exhibits a high degree of concentration, with a few major players commanding significant market share. The Herfindahl-Hirschman Index (HHI) for 2024 is estimated at xx, indicating a moderately concentrated market. However, the entry of new players and the emergence of niche services continue to challenge the established giants.
Key Aspects Analyzed:
- Market Concentration: The report quantifies market concentration using HHI and market share data for leading players, including Netflix, Disney+, Amazon Prime Video, and others. The analysis considers both subscriber numbers and revenue generation.
- Innovation Drivers: The report identifies key innovation drivers such as technological advancements in streaming technology (e.g., 4K, HDR, AI-powered recommendations), personalized content, and interactive features.
- Regulatory Impacts: The evolving regulatory landscape concerning data privacy, content regulation, and net neutrality is assessed for its impact on market dynamics.
- Product Substitutes: The report examines the competitive pressures from traditional pay-TV services and other forms of entertainment.
- End-User Segmentation: Consumer segmentation based on demographics, viewing habits, and subscription preferences is provided, impacting service offerings.
- M&A Trends: Analysis of mergers and acquisitions (M&A) activity in the OTT space, including deal volume and value from 2019 to 2024, revealing strategic shifts and consolidation trends. For example, the estimated M&A volume in 2024 reached approximately xx Million USD.
U.S. OTT Industry Market Trends & Opportunities
This section provides a detailed analysis of the U.S. OTT market's growth trajectory and emerging opportunities. The market size is projected to reach xx Million USD by 2025, exhibiting a Compound Annual Growth Rate (CAGR) of xx% during the forecast period (2025-2033). This substantial growth is driven by multiple factors, including increasing internet penetration, the rising popularity of streaming services, and the shift in consumer preferences away from traditional cable television. Market penetration is expected to exceed xx% by 2033.
Key trends explored include the rise of AVOD (ad-supported video on demand), the increasing importance of original content, the growth of mobile viewing, and the expansion of international services into the U.S. market. The increasing adoption of smart TVs and streaming devices further fuels the growth. Opportunities lie in personalized content recommendation systems, enhanced user experience, targeted advertising, and innovative business models catering to diverse consumer segments.

Dominant Markets & Segments in U.S. OTT Industry
The U.S. OTT market is dominated by the SVOD (subscription video on demand) segment, which is expected to account for xx Million USD of the total market revenue in 2025.
Key Growth Drivers for SVOD:
- High-Quality Original Content: Investment in exclusive programming is a major driver.
- Convenience and Accessibility: Easy access through various devices.
- Affordability: Competitive pricing options are offered by major players.
TVOD and AVOD Segments: TVOD (transactional video on demand) and AVOD (ad-supported video on demand) are also expanding, fueled by changing consumer preferences and evolving business models.
U.S. OTT Industry Product Analysis
The U.S. OTT industry is characterized by continuous product innovation. Leading players are constantly developing enhanced streaming capabilities, personalized content recommendations, and improved user interfaces. The introduction of 4K Ultra HD, HDR (High Dynamic Range), and Dolby Atmos audio technologies have enhanced the viewing experience. Competition is fierce, with companies vying to provide the most compelling content libraries, user-friendly interfaces, and innovative features. The market's success hinges on offering a seamless, engaging viewing experience across numerous devices.
Key Drivers, Barriers & Challenges in U.S. OTT Industry
Key Drivers:
- Technological advancements: Improved streaming technologies, 5G rollout, and smart TV adoption.
- Changing consumer preferences: Shift towards on-demand and personalized entertainment.
- Favorable regulatory environment: Reduced regulation compared to traditional broadcasting.
Key Challenges:
- Competition: Intense rivalry among major players for market share.
- Content costs: High investments in content acquisition and production.
- Subscription fatigue: Consumers facing challenges from multiple subscription services. The combined effect of these factors impacts profitability and market expansion.
Growth Drivers in the U.S. OTT Industry Market
The U.S. OTT industry's growth is primarily propelled by technological advancements (e.g., improvements in streaming quality and bandwidth), shifting consumer behavior toward on-demand entertainment, and a favorable regulatory environment. The proliferation of smart TVs and mobile devices also fuels the market's expansion. Economic factors, including disposable income levels, further contribute to the sector's growth.
Challenges Impacting U.S. OTT Industry Growth
The U.S. OTT industry faces significant challenges including intense competition leading to price wars and margin pressure. Regulatory hurdles related to data privacy and content regulation pose ongoing concerns. Supply chain disruptions, particularly in content production, can negatively impact delivery. Additionally, subscriber acquisition and retention remain crucial aspects needing considerable investment.
Key Players Shaping the U.S. OTT Industry Market
- Sling TV L L C
- Disney+
- YouTube (Google LLC)
- Netflix
- CBS All Access (Viacomcbs Inc)
- Roku
- Amazon Prime Video
- Apple Inc
- HBO Max (AT&T Inc)
Significant U.S. OTT Industry Milestones
- July 2022: Netflix acquired Animal Logic, bolstering its animation production capabilities and potentially impacting competitive dynamics.
- April 2022: Roku and Amazon extended their distribution agreement, ensuring continued access to Prime Video on Roku devices and strengthening their partnership.
Future Outlook for U.S. OTT Industry Market
The future of the U.S. OTT industry looks promising, driven by continuous technological advancements, evolving consumer preferences, and increasing global reach. Opportunities exist for targeted advertising, personalized content, and innovative subscription models. The market is poised for further growth, with increasing penetration among diverse demographic groups. The continued development of high-quality original content and expansion into new territories will remain key drivers of market expansion.
U.S. OTT Industry Segmentation
-
1. Type
- 1.1. SVoD
- 1.2. TVoD
- 1.3. AVoD
U.S. OTT Industry Segmentation By Geography
- 1. U.S.
U.S. OTT Industry REPORT HIGHLIGHTS
| Aspects | Details |
|---|---|
| Study Period | 2019-2033 |
| Base Year | 2024 |
| Estimated Year | 2025 |
| Forecast Period | 2025-2033 |
| Historical Period | 2019-2024 |
| Growth Rate | CAGR of 12.56% from 2019-2033 |
| Segmentation |
|
Table of Contents
- 1. Introduction
- 1.1. Research Scope
- 1.2. Market Segmentation
- 1.3. Research Methodology
- 1.4. Definitions and Assumptions
- 2. Executive Summary
- 2.1. Introduction
- 3. Market Dynamics
- 3.1. Introduction
- 3.2. Market Drivers
- 3.2.1. High Penetration of Smart TV and the Presence of Major OTT Providers have Contributed to the Growth of OTT Adoption in the Region; Market Consolidation to Result in Emphasis on Collaboration and Partnerships
- 3.3. Market Restrains
- 3.3.1. Growing Threat of Video Content Piracy and Security Threat of User Database Due to Spyware
- 3.4. Market Trends
- 3.4.1. High Penetration of Smart TV Witnesses a Significant Growth
- 4. Market Factor Analysis
- 4.1. Porters Five Forces
- 4.2. Supply/Value Chain
- 4.3. PESTEL analysis
- 4.4. Market Entropy
- 4.5. Patent/Trademark Analysis
- 5. U.S. OTT Industry Analysis, Insights and Forecast, 2019-2031
- 5.1. Market Analysis, Insights and Forecast - by Type
- 5.1.1. SVoD
- 5.1.2. TVoD
- 5.1.3. AVoD
- 5.2. Market Analysis, Insights and Forecast - by Region
- 5.2.1. U.S.
- 5.1. Market Analysis, Insights and Forecast - by Type
- 6. Northeast U.S. OTT Industry Analysis, Insights and Forecast, 2019-2031
- 7. Southeast U.S. OTT Industry Analysis, Insights and Forecast, 2019-2031
- 8. Midwest U.S. OTT Industry Analysis, Insights and Forecast, 2019-2031
- 9. Southwest U.S. OTT Industry Analysis, Insights and Forecast, 2019-2031
- 10. West U.S. OTT Industry Analysis, Insights and Forecast, 2019-2031
- 11. Competitive Analysis
- 11.1. Market Share Analysis 2024
- 11.2. Company Profiles
- 11.2.1 Sling TV L L C
- 11.2.1.1. Overview
- 11.2.1.2. Products
- 11.2.1.3. SWOT Analysis
- 11.2.1.4. Recent Developments
- 11.2.1.5. Financials (Based on Availability)
- 11.2.2 Disney+
- 11.2.2.1. Overview
- 11.2.2.2. Products
- 11.2.2.3. SWOT Analysis
- 11.2.2.4. Recent Developments
- 11.2.2.5. Financials (Based on Availability)
- 11.2.3 YouTube (Google LLC)*List Not Exhaustive
- 11.2.3.1. Overview
- 11.2.3.2. Products
- 11.2.3.3. SWOT Analysis
- 11.2.3.4. Recent Developments
- 11.2.3.5. Financials (Based on Availability)
- 11.2.4 Netflix
- 11.2.4.1. Overview
- 11.2.4.2. Products
- 11.2.4.3. SWOT Analysis
- 11.2.4.4. Recent Developments
- 11.2.4.5. Financials (Based on Availability)
- 11.2.5 CBS All Acess (Viacomcbs Inc )
- 11.2.5.1. Overview
- 11.2.5.2. Products
- 11.2.5.3. SWOT Analysis
- 11.2.5.4. Recent Developments
- 11.2.5.5. Financials (Based on Availability)
- 11.2.6 Roku
- 11.2.6.1. Overview
- 11.2.6.2. Products
- 11.2.6.3. SWOT Analysis
- 11.2.6.4. Recent Developments
- 11.2.6.5. Financials (Based on Availability)
- 11.2.7 Amazon Prime Video
- 11.2.7.1. Overview
- 11.2.7.2. Products
- 11.2.7.3. SWOT Analysis
- 11.2.7.4. Recent Developments
- 11.2.7.5. Financials (Based on Availability)
- 11.2.8 Apple Inc
- 11.2.8.1. Overview
- 11.2.8.2. Products
- 11.2.8.3. SWOT Analysis
- 11.2.8.4. Recent Developments
- 11.2.8.5. Financials (Based on Availability)
- 11.2.9 HBO Max (AT&T Inc )
- 11.2.9.1. Overview
- 11.2.9.2. Products
- 11.2.9.3. SWOT Analysis
- 11.2.9.4. Recent Developments
- 11.2.9.5. Financials (Based on Availability)
- 11.2.1 Sling TV L L C
List of Figures
- Figure 1: U.S. OTT Industry Revenue Breakdown (Million, %) by Product 2024 & 2032
- Figure 2: U.S. OTT Industry Share (%) by Company 2024
List of Tables
- Table 1: U.S. OTT Industry Revenue Million Forecast, by Region 2019 & 2032
- Table 2: U.S. OTT Industry Revenue Million Forecast, by Type 2019 & 2032
- Table 3: U.S. OTT Industry Revenue Million Forecast, by Region 2019 & 2032
- Table 4: U.S. OTT Industry Revenue Million Forecast, by Country 2019 & 2032
- Table 5: Northeast U.S. OTT Industry Revenue (Million) Forecast, by Application 2019 & 2032
- Table 6: Southeast U.S. OTT Industry Revenue (Million) Forecast, by Application 2019 & 2032
- Table 7: Midwest U.S. OTT Industry Revenue (Million) Forecast, by Application 2019 & 2032
- Table 8: Southwest U.S. OTT Industry Revenue (Million) Forecast, by Application 2019 & 2032
- Table 9: West U.S. OTT Industry Revenue (Million) Forecast, by Application 2019 & 2032
- Table 10: U.S. OTT Industry Revenue Million Forecast, by Type 2019 & 2032
- Table 11: U.S. OTT Industry Revenue Million Forecast, by Country 2019 & 2032
Frequently Asked Questions
1. What is the projected Compound Annual Growth Rate (CAGR) of the U.S. OTT Industry?
The projected CAGR is approximately 12.56%.
2. Which companies are prominent players in the U.S. OTT Industry?
Key companies in the market include Sling TV L L C, Disney+, YouTube (Google LLC)*List Not Exhaustive, Netflix, CBS All Acess (Viacomcbs Inc ), Roku, Amazon Prime Video, Apple Inc, HBO Max (AT&T Inc ).
3. What are the main segments of the U.S. OTT Industry?
The market segments include Type.
4. Can you provide details about the market size?
The market size is estimated to be USD 56.61 Million as of 2022.
5. What are some drivers contributing to market growth?
High Penetration of Smart TV and the Presence of Major OTT Providers have Contributed to the Growth of OTT Adoption in the Region; Market Consolidation to Result in Emphasis on Collaboration and Partnerships.
6. What are the notable trends driving market growth?
High Penetration of Smart TV Witnesses a Significant Growth.
7. Are there any restraints impacting market growth?
Growing Threat of Video Content Piracy and Security Threat of User Database Due to Spyware.
8. Can you provide examples of recent developments in the market?
Jul 2022: Netflix acquired Animal Logic, the world's leading independent animation studio. This acquisition is expected to speed up Netflix's development of end-to-end animation production abilities. Netflix Animation and Animal Logic together are anticipated to form a worldwide creative production team as well as an animation studio that will create some of Netflix's most popular animated feature titles.
9. What pricing options are available for accessing the report?
Pricing options include single-user, multi-user, and enterprise licenses priced at USD 3800, USD 4500, and USD 5800 respectively.
10. Is the market size provided in terms of value or volume?
The market size is provided in terms of value, measured in Million.
11. Are there any specific market keywords associated with the report?
Yes, the market keyword associated with the report is "U.S. OTT Industry," which aids in identifying and referencing the specific market segment covered.
12. How do I determine which pricing option suits my needs best?
The pricing options vary based on user requirements and access needs. Individual users may opt for single-user licenses, while businesses requiring broader access may choose multi-user or enterprise licenses for cost-effective access to the report.
13. Are there any additional resources or data provided in the U.S. OTT Industry report?
While the report offers comprehensive insights, it's advisable to review the specific contents or supplementary materials provided to ascertain if additional resources or data are available.
14. How can I stay updated on further developments or reports in the U.S. OTT Industry?
To stay informed about further developments, trends, and reports in the U.S. OTT Industry, consider subscribing to industry newsletters, following relevant companies and organizations, or regularly checking reputable industry news sources and publications.
Methodology
Step 1 - Identification of Relevant Samples Size from Population Database


Step 2 - Approaches for Defining Global Market Size (Value, Volume* & Price*)

Note*: In applicable scenarios
Step 3 - Data Sources
Primary Research
- Web Analytics
- Survey Reports
- Research Institute
- Latest Research Reports
- Opinion Leaders
Secondary Research
- Annual Reports
- White Paper
- Latest Press Release
- Industry Association
- Paid Database
- Investor Presentations

Step 4 - Data Triangulation
Involves using different sources of information in order to increase the validity of a study
These sources are likely to be stakeholders in a program - participants, other researchers, program staff, other community members, and so on.
Then we put all data in single framework & apply various statistical tools to find out the dynamic on the market.
During the analysis stage, feedback from the stakeholder groups would be compared to determine areas of agreement as well as areas of divergence
