

Key Insights
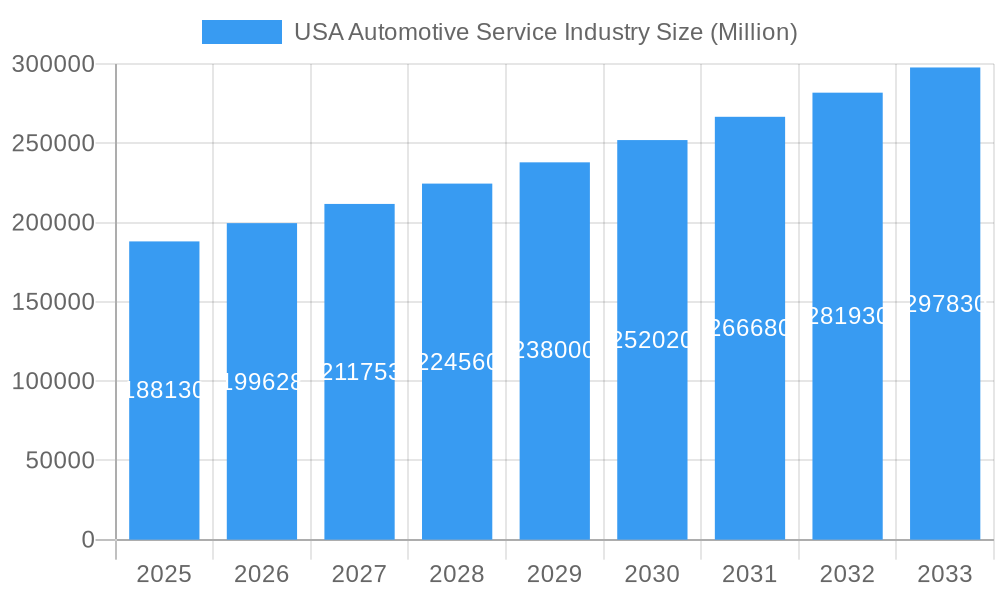
The US automotive service industry, a robust $188.13 billion market in 2025, is projected to experience steady growth, driven by a rising vehicle population, increasing vehicle complexity requiring specialized services, and a growing preference for preventative maintenance among car owners. The industry's 5.98% CAGR from 2019-2033 indicates a significant expansion, particularly within key segments. Mechanical services remain a dominant force, encompassing routine maintenance like oil changes and brake repairs, while the electrical and electronics segment is experiencing accelerated growth fueled by the increasing technological sophistication of modern vehicles. The demand for specialized services related to battery maintenance and repair in electric and hybrid vehicles further contributes to this expansion. Growth is also propelled by the increasing prevalence of commercial vehicles requiring regular servicing and repair. Leading players such as Midas, Meineke, Pep Boys, and Firestone, alongside specialized providers like Safelite (glass repair) and Monro (tire and brake services), compete intensely within this fragmented landscape. Regional variations exist, with densely populated states in the Northeast and West potentially exhibiting higher demand. However, growth is expected across all US regions, fueled by broader economic conditions and consumer spending patterns.
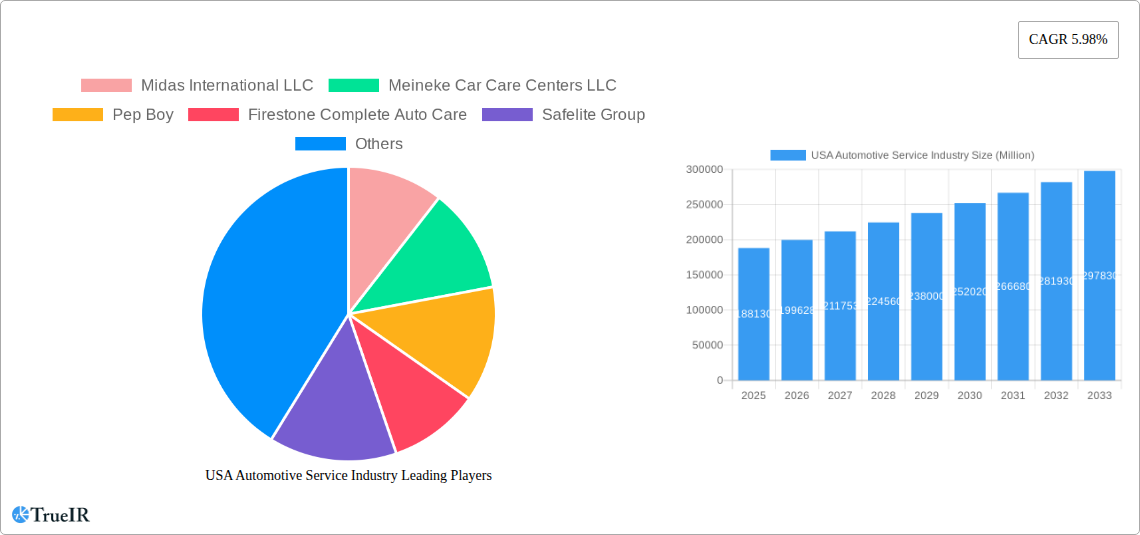
USA Automotive Service Industry Market Size (In Billion)
The industry faces certain constraints including skilled labor shortages within the automotive technician workforce and fluctuating prices for parts and materials due to global supply chain dynamics. Nevertheless, the long-term outlook remains positive, with opportunities for innovative service providers leveraging technology (e.g., telematics for predictive maintenance) and expanding their service offerings to cater to the evolving needs of consumers and the automotive industry. The increasing adoption of electric vehicles presents both challenges and opportunities, necessitating investments in specialized training and equipment to service these vehicles. This creates opportunities for businesses specializing in electric vehicle maintenance and repair, as well as those able to offer comprehensive services addressing both traditional and electric vehicles. Strategic partnerships, technological advancements, and a focus on customer service will be crucial for success in this competitive market.
USA Automotive Service Industry Company Market Share
USA Automotive Service Industry Market Report: 2019-2033
This comprehensive report provides an in-depth analysis of the USA Automotive Service Industry, offering invaluable insights for investors, industry professionals, and strategic decision-makers. The study covers the period 2019-2033, with a focus on the 2025-2033 forecast period. The report leverages extensive data analysis to project a market valued at xx Million by 2033, highlighting significant growth opportunities and challenges within this dynamic sector.
USA Automotive Service Industry Market Structure & Competitive Landscape
The USA automotive service industry is characterized by a moderately consolidated market structure, with a few large players and a significant number of smaller independent shops. While precise concentration ratios require proprietary data, the market displays characteristics of oligopolistic competition in certain segments (e.g., national chains like Midas International LLC, Meineke Car Care Centers LLC, and Pep Boys). Innovation is driven by advancements in vehicle technology (e.g., electric vehicles, advanced driver-assistance systems), necessitating specialized repair skills and equipment. Regulatory compliance (emissions standards, safety regulations) significantly impacts operational costs and market entry barriers. Product substitutes, such as DIY repair kits and mobile repair services, pose increasing competitive pressure. End-user segmentation includes individual car owners, commercial vehicle fleets, and dealerships.
M&A activity is a key feature of the industry's landscape. Recent examples illustrate this trend, such as the acquisition of RepairSmith by AutoNation (see Industry Milestones section). The volume of M&A transactions fluctuates with economic cycles and technological disruptions, with a xx Million in deal value predicted for 2025. This consolidation helps larger players achieve economies of scale and expand their service offerings.
USA Automotive Service Industry Market Trends & Opportunities
The US automotive service market exhibits robust growth, driven by factors such as an aging vehicle fleet, increased vehicle complexity, and rising consumer demand for quality maintenance and repairs. The market size is estimated to be xx Million in 2025, with a Compound Annual Growth Rate (CAGR) of xx% projected between 2025 and 2033. This growth is fueled by technological advancements like telematics and diagnostic tools, enabling proactive maintenance and improved efficiency. Consumer preferences are shifting towards convenience, transparency, and value-added services (e.g., mobile repair, warranty programs, specialized services for EVs). Competitive dynamics are shaped by pricing pressures, technological adoption, and the rise of alternative service models (e.g., subscription-based maintenance). Market penetration rates for specialized services, like electric vehicle repair, are increasing rapidly, currently at xx% and projected to reach xx% by 2033.
Dominant Markets & Segments in USA Automotive Service Industry
The mechanical service segment currently dominates the market, followed by exterior and structural repairs. Within equipment types, tires represent a significant segment due to the high frequency of replacement. Passenger cars constitute the largest vehicle type segment, followed by commercial vehicles.
- Key Growth Drivers:
- Increasing vehicle age leading to higher maintenance needs.
- Technological advancements requiring specialized repairs.
- Growing consumer awareness of preventative maintenance.
- Expansion of specialized services (e.g., EV repair).
- Government regulations promoting vehicle safety and emissions control.
Geographically, the market is spread across all regions, with higher concentrations in densely populated areas. However, due to the high volume of vehicles on the roads, higher population density and large amount of commercial vehicles, the Western region represents a significant market share.
USA Automotive Service Industry Product Analysis
Product innovation focuses on efficiency, diagnostic capabilities, and specialized services. Technological advancements like AI-powered diagnostic tools, advanced repair techniques, and electric vehicle-specific equipment are transforming the industry. These innovations offer significant competitive advantages by improving service speed, accuracy, and cost-effectiveness, aligning with consumer demand for quick turnaround times and reliable repairs.
Key Drivers, Barriers & Challenges in USA Automotive Service Industry
Key Drivers:
- Growing vehicle fleet age requiring increased maintenance.
- Technological advancements necessitating specialized repairs.
- Rising consumer awareness regarding preventative maintenance.
- Expanding demand for specialized services for Electric Vehicles.
Challenges:
- Skilled labor shortages and rising labor costs (estimated impact: xx Million annual loss in revenue).
- Supply chain disruptions impacting parts availability and pricing.
- Increasing regulatory complexity and compliance costs (estimated compliance costs: xx Million annually).
- Intense competition from both large national chains and independent shops.
Growth Drivers in the USA Automotive Service Industry Market
The growth of the USA automotive service industry is fueled by technological advancements in diagnostics and repair techniques, an aging vehicle fleet demanding higher maintenance, and expanding demand for specialized services catering to electric and hybrid vehicles. Furthermore, increased consumer awareness regarding preventative maintenance and government regulations promoting vehicle safety and emissions control contribute significantly to market expansion.
Challenges Impacting USA Automotive Service Industry Growth
Significant challenges include skilled labor shortages, leading to higher labor costs and reduced service capacity. Supply chain disruptions create parts shortages and price volatility. Moreover, stringent regulatory compliance requirements and intense competition from established players and new entrants pose ongoing obstacles to growth.
Key Players Shaping the USA Automotive Service Industry Market
- Midas International LLC
- Meineke Car Care Centers LLC
- Pep Boys
- Firestone Complete Auto Care
- Safelite Group
- Monro Inc
- Jiffy Lube International Inc
- Walmart Inc
Significant USA Automotive Service Industry Industry Milestones
- December 2022: AutoNation Inc. acquires RepairSmith, expanding its mobile repair services.
- May 2022: American Tire Distributors acquires Monro Inc.'s wholesale tire distribution assets.
- March 2022: Monro Inc. acquires Mountain View Tire & Service Inc., expanding its western presence.
Future Outlook for USA Automotive Service Industry Market
The USA automotive service industry's future is promising, driven by continued fleet aging, technological advancements, and the growing adoption of electric vehicles. Strategic opportunities lie in specialized services for EVs, technological integration for enhanced efficiency, and data-driven preventative maintenance programs. The market exhibits significant potential for continued growth, driven by these factors and a resilient consumer demand for reliable vehicle maintenance and repair.
USA Automotive Service Industry Segmentation
-
1. Vehicle Type
- 1.1. Passenger Cars
- 1.2. Commercial Vehicles
-
2. Service Type
- 2.1. Mechanical
- 2.2. Exterior and Structural
- 2.3. Electrical and Electronics
-
3. Equipment Type
- 3.1. Tires
- 3.2. Seats
- 3.3. Batteries
- 3.4. Other Equipment Types
USA Automotive Service Industry Segmentation By Geography
-
1. North America
- 1.1. United States
- 1.2. Canada
- 1.3. Mexico
-
2. South America
- 2.1. Brazil
- 2.2. Argentina
- 2.3. Rest of South America
-
3. Europe
- 3.1. United Kingdom
- 3.2. Germany
- 3.3. France
- 3.4. Italy
- 3.5. Spain
- 3.6. Russia
- 3.7. Benelux
- 3.8. Nordics
- 3.9. Rest of Europe
-
4. Middle East & Africa
- 4.1. Turkey
- 4.2. Israel
- 4.3. GCC
- 4.4. North Africa
- 4.5. South Africa
- 4.6. Rest of Middle East & Africa
-
5. Asia Pacific
- 5.1. China
- 5.2. India
- 5.3. Japan
- 5.4. South Korea
- 5.5. ASEAN
- 5.6. Oceania
- 5.7. Rest of Asia Pacific
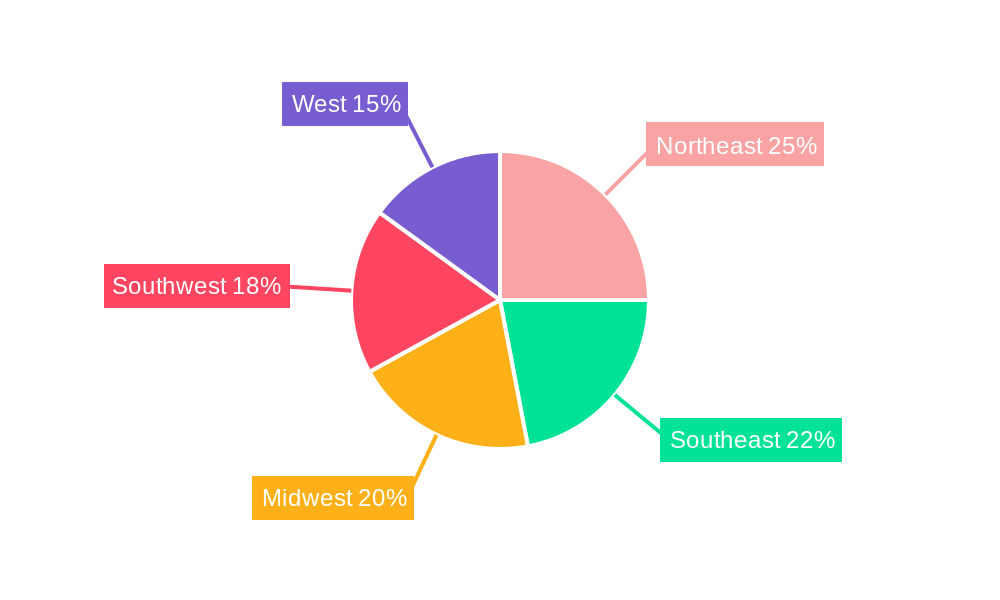
USA Automotive Service Industry Regional Market Share
Geographic Coverage of USA Automotive Service Industry
USA Automotive Service Industry REPORT HIGHLIGHTS
| Aspects | Details |
|---|---|
| Study Period | 2020-2034 |
| Base Year | 2025 |
| Estimated Year | 2026 |
| Forecast Period | 2026-2034 |
| Historical Period | 2020-2025 |
| Growth Rate | CAGR of 5.98% from 2020-2034 |
| Segmentation |
|
Table of Contents
- 1. Introduction
- 1.1. Research Scope
- 1.2. Market Segmentation
- 1.3. Research Objective
- 1.4. Definitions and Assumptions
- 2. Executive Summary
- 2.1. Market Snapshot
- 3. Market Dynamics
- 3.1. Market Drivers
- 3.2. Market Restrains
- 3.3. Market Trends
- 3.4. Market Opportunities
- 4. Market Factor Analysis
- 4.1. Porters Five Forces
- 4.1.1. Bargaining Power of Suppliers
- 4.1.2. Bargaining Power of Buyers
- 4.1.3. Threat of New Entrants
- 4.1.4. Threat of Substitutes
- 4.1.5. Competitive Rivalry
- 4.2. PESTEL analysis
- 4.3. BCG Analysis
- 4.3.1. Stars (High Growth, High Market Share)
- 4.3.2. Cash Cows (Low Growth, High Market Share)
- 4.3.3. Question Mark (High Growth, Low Market Share)
- 4.3.4. Dogs (Low Growth, Low Market Share)
- 4.4. Ansoff Matrix Analysis
- 4.5. Supply Chain Analysis
- 4.6. Regulatory Landscape
- 4.7. Current Market Potential and Opportunity Assessment (TAM–SAM–SOM Framework)
- 4.8. TIR Analyst Note
- 4.1. Porters Five Forces
- 5. Market Analysis, Insights and Forecast 2021-2033
- 5.1. Market Analysis, Insights and Forecast - by Vehicle Type
- 5.1.1. Passenger Cars
- 5.1.2. Commercial Vehicles
- 5.2. Market Analysis, Insights and Forecast - by Service Type
- 5.2.1. Mechanical
- 5.2.2. Exterior and Structural
- 5.2.3. Electrical and Electronics
- 5.3. Market Analysis, Insights and Forecast - by Equipment Type
- 5.3.1. Tires
- 5.3.2. Seats
- 5.3.3. Batteries
- 5.3.4. Other Equipment Types
- 5.4. Market Analysis, Insights and Forecast - by Region
- 5.4.1. North America
- 5.4.2. South America
- 5.4.3. Europe
- 5.4.4. Middle East & Africa
- 5.4.5. Asia Pacific
- 5.1. Market Analysis, Insights and Forecast - by Vehicle Type
- 6. Global USA Automotive Service Industry Analysis, Insights and Forecast, 2021-2033
- 6.1. Market Analysis, Insights and Forecast - by Vehicle Type
- 6.1.1. Passenger Cars
- 6.1.2. Commercial Vehicles
- 6.2. Market Analysis, Insights and Forecast - by Service Type
- 6.2.1. Mechanical
- 6.2.2. Exterior and Structural
- 6.2.3. Electrical and Electronics
- 6.3. Market Analysis, Insights and Forecast - by Equipment Type
- 6.3.1. Tires
- 6.3.2. Seats
- 6.3.3. Batteries
- 6.3.4. Other Equipment Types
- 6.1. Market Analysis, Insights and Forecast - by Vehicle Type
- 7. North America USA Automotive Service Industry Analysis, Insights and Forecast, 2020-2032
- 7.1. Market Analysis, Insights and Forecast - by Vehicle Type
- 7.1.1. Passenger Cars
- 7.1.2. Commercial Vehicles
- 7.2. Market Analysis, Insights and Forecast - by Service Type
- 7.2.1. Mechanical
- 7.2.2. Exterior and Structural
- 7.2.3. Electrical and Electronics
- 7.3. Market Analysis, Insights and Forecast - by Equipment Type
- 7.3.1. Tires
- 7.3.2. Seats
- 7.3.3. Batteries
- 7.3.4. Other Equipment Types
- 7.1. Market Analysis, Insights and Forecast - by Vehicle Type
- 8. South America USA Automotive Service Industry Analysis, Insights and Forecast, 2020-2032
- 8.1. Market Analysis, Insights and Forecast - by Vehicle Type
- 8.1.1. Passenger Cars
- 8.1.2. Commercial Vehicles
- 8.2. Market Analysis, Insights and Forecast - by Service Type
- 8.2.1. Mechanical
- 8.2.2. Exterior and Structural
- 8.2.3. Electrical and Electronics
- 8.3. Market Analysis, Insights and Forecast - by Equipment Type
- 8.3.1. Tires
- 8.3.2. Seats
- 8.3.3. Batteries
- 8.3.4. Other Equipment Types
- 8.1. Market Analysis, Insights and Forecast - by Vehicle Type
- 9. Europe USA Automotive Service Industry Analysis, Insights and Forecast, 2020-2032
- 9.1. Market Analysis, Insights and Forecast - by Vehicle Type
- 9.1.1. Passenger Cars
- 9.1.2. Commercial Vehicles
- 9.2. Market Analysis, Insights and Forecast - by Service Type
- 9.2.1. Mechanical
- 9.2.2. Exterior and Structural
- 9.2.3. Electrical and Electronics
- 9.3. Market Analysis, Insights and Forecast - by Equipment Type
- 9.3.1. Tires
- 9.3.2. Seats
- 9.3.3. Batteries
- 9.3.4. Other Equipment Types
- 9.1. Market Analysis, Insights and Forecast - by Vehicle Type
- 10. Middle East & Africa USA Automotive Service Industry Analysis, Insights and Forecast, 2020-2032
- 10.1. Market Analysis, Insights and Forecast - by Vehicle Type
- 10.1.1. Passenger Cars
- 10.1.2. Commercial Vehicles
- 10.2. Market Analysis, Insights and Forecast - by Service Type
- 10.2.1. Mechanical
- 10.2.2. Exterior and Structural
- 10.2.3. Electrical and Electronics
- 10.3. Market Analysis, Insights and Forecast - by Equipment Type
- 10.3.1. Tires
- 10.3.2. Seats
- 10.3.3. Batteries
- 10.3.4. Other Equipment Types
- 10.1. Market Analysis, Insights and Forecast - by Vehicle Type
- 11. Asia Pacific USA Automotive Service Industry Analysis, Insights and Forecast, 2020-2032
- 11.1. Market Analysis, Insights and Forecast - by Vehicle Type
- 11.1.1. Passenger Cars
- 11.1.2. Commercial Vehicles
- 11.2. Market Analysis, Insights and Forecast - by Service Type
- 11.2.1. Mechanical
- 11.2.2. Exterior and Structural
- 11.2.3. Electrical and Electronics
- 11.3. Market Analysis, Insights and Forecast - by Equipment Type
- 11.3.1. Tires
- 11.3.2. Seats
- 11.3.3. Batteries
- 11.3.4. Other Equipment Types
- 11.1. Market Analysis, Insights and Forecast - by Vehicle Type
- 12. Competitive Analysis
- 12.1. Company Profiles
- 12.1.1 Midas International LLC
- 12.1.1.1. Company Overview
- 12.1.1.2. Products
- 12.1.1.3. Company Financials
- 12.1.1.4. SWOT Analysis
- 12.1.2 Meineke Car Care Centers LLC
- 12.1.2.1. Company Overview
- 12.1.2.2. Products
- 12.1.2.3. Company Financials
- 12.1.2.4. SWOT Analysis
- 12.1.3 Pep Boy
- 12.1.3.1. Company Overview
- 12.1.3.2. Products
- 12.1.3.3. Company Financials
- 12.1.3.4. SWOT Analysis
- 12.1.4 Firestone Complete Auto Care
- 12.1.4.1. Company Overview
- 12.1.4.2. Products
- 12.1.4.3. Company Financials
- 12.1.4.4. SWOT Analysis
- 12.1.5 Safelite Group
- 12.1.5.1. Company Overview
- 12.1.5.2. Products
- 12.1.5.3. Company Financials
- 12.1.5.4. SWOT Analysis
- 12.1.6 Monro Inc
- 12.1.6.1. Company Overview
- 12.1.6.2. Products
- 12.1.6.3. Company Financials
- 12.1.6.4. SWOT Analysis
- 12.1.7 Jiffy Lube International Inc
- 12.1.7.1. Company Overview
- 12.1.7.2. Products
- 12.1.7.3. Company Financials
- 12.1.7.4. SWOT Analysis
- 12.1.8 Walmart Inc
- 12.1.8.1. Company Overview
- 12.1.8.2. Products
- 12.1.8.3. Company Financials
- 12.1.8.4. SWOT Analysis
- 12.1.1 Midas International LLC
- 12.2. Market Entropy
- 12.2.1 Company's Key Areas Served
- 12.2.2 Recent Developments
- 12.3. Company Market Share Analysis 2025
- 12.3.1 Top 5 Companies Market Share Analysis
- 12.3.2 Top 3 Companies Market Share Analysis
- 12.4. List of Potential Customers
- 13. Research Methodology
List of Figures
- Figure 1: Global USA Automotive Service Industry Revenue Breakdown (Million, %) by Region 2025 & 2033
- Figure 2: North America USA Automotive Service Industry Revenue (Million), by Vehicle Type 2025 & 2033
- Figure 3: North America USA Automotive Service Industry Revenue Share (%), by Vehicle Type 2025 & 2033
- Figure 4: North America USA Automotive Service Industry Revenue (Million), by Service Type 2025 & 2033
- Figure 5: North America USA Automotive Service Industry Revenue Share (%), by Service Type 2025 & 2033
- Figure 6: North America USA Automotive Service Industry Revenue (Million), by Equipment Type 2025 & 2033
- Figure 7: North America USA Automotive Service Industry Revenue Share (%), by Equipment Type 2025 & 2033
- Figure 8: North America USA Automotive Service Industry Revenue (Million), by Country 2025 & 2033
- Figure 9: North America USA Automotive Service Industry Revenue Share (%), by Country 2025 & 2033
- Figure 10: South America USA Automotive Service Industry Revenue (Million), by Vehicle Type 2025 & 2033
- Figure 11: South America USA Automotive Service Industry Revenue Share (%), by Vehicle Type 2025 & 2033
- Figure 12: South America USA Automotive Service Industry Revenue (Million), by Service Type 2025 & 2033
- Figure 13: South America USA Automotive Service Industry Revenue Share (%), by Service Type 2025 & 2033
- Figure 14: South America USA Automotive Service Industry Revenue (Million), by Equipment Type 2025 & 2033
- Figure 15: South America USA Automotive Service Industry Revenue Share (%), by Equipment Type 2025 & 2033
- Figure 16: South America USA Automotive Service Industry Revenue (Million), by Country 2025 & 2033
- Figure 17: South America USA Automotive Service Industry Revenue Share (%), by Country 2025 & 2033
- Figure 18: Europe USA Automotive Service Industry Revenue (Million), by Vehicle Type 2025 & 2033
- Figure 19: Europe USA Automotive Service Industry Revenue Share (%), by Vehicle Type 2025 & 2033
- Figure 20: Europe USA Automotive Service Industry Revenue (Million), by Service Type 2025 & 2033
- Figure 21: Europe USA Automotive Service Industry Revenue Share (%), by Service Type 2025 & 2033
- Figure 22: Europe USA Automotive Service Industry Revenue (Million), by Equipment Type 2025 & 2033
- Figure 23: Europe USA Automotive Service Industry Revenue Share (%), by Equipment Type 2025 & 2033
- Figure 24: Europe USA Automotive Service Industry Revenue (Million), by Country 2025 & 2033
- Figure 25: Europe USA Automotive Service Industry Revenue Share (%), by Country 2025 & 2033
- Figure 26: Middle East & Africa USA Automotive Service Industry Revenue (Million), by Vehicle Type 2025 & 2033
- Figure 27: Middle East & Africa USA Automotive Service Industry Revenue Share (%), by Vehicle Type 2025 & 2033
- Figure 28: Middle East & Africa USA Automotive Service Industry Revenue (Million), by Service Type 2025 & 2033
- Figure 29: Middle East & Africa USA Automotive Service Industry Revenue Share (%), by Service Type 2025 & 2033
- Figure 30: Middle East & Africa USA Automotive Service Industry Revenue (Million), by Equipment Type 2025 & 2033
- Figure 31: Middle East & Africa USA Automotive Service Industry Revenue Share (%), by Equipment Type 2025 & 2033
- Figure 32: Middle East & Africa USA Automotive Service Industry Revenue (Million), by Country 2025 & 2033
- Figure 33: Middle East & Africa USA Automotive Service Industry Revenue Share (%), by Country 2025 & 2033
- Figure 34: Asia Pacific USA Automotive Service Industry Revenue (Million), by Vehicle Type 2025 & 2033
- Figure 35: Asia Pacific USA Automotive Service Industry Revenue Share (%), by Vehicle Type 2025 & 2033
- Figure 36: Asia Pacific USA Automotive Service Industry Revenue (Million), by Service Type 2025 & 2033
- Figure 37: Asia Pacific USA Automotive Service Industry Revenue Share (%), by Service Type 2025 & 2033
- Figure 38: Asia Pacific USA Automotive Service Industry Revenue (Million), by Equipment Type 2025 & 2033
- Figure 39: Asia Pacific USA Automotive Service Industry Revenue Share (%), by Equipment Type 2025 & 2033
- Figure 40: Asia Pacific USA Automotive Service Industry Revenue (Million), by Country 2025 & 2033
- Figure 41: Asia Pacific USA Automotive Service Industry Revenue Share (%), by Country 2025 & 2033
List of Tables
- Table 1: Global USA Automotive Service Industry Revenue Million Forecast, by Vehicle Type 2020 & 2033
- Table 2: Global USA Automotive Service Industry Revenue Million Forecast, by Service Type 2020 & 2033
- Table 3: Global USA Automotive Service Industry Revenue Million Forecast, by Equipment Type 2020 & 2033
- Table 4: Global USA Automotive Service Industry Revenue Million Forecast, by Region 2020 & 2033
- Table 5: Global USA Automotive Service Industry Revenue Million Forecast, by Vehicle Type 2020 & 2033
- Table 6: Global USA Automotive Service Industry Revenue Million Forecast, by Service Type 2020 & 2033
- Table 7: Global USA Automotive Service Industry Revenue Million Forecast, by Equipment Type 2020 & 2033
- Table 8: Global USA Automotive Service Industry Revenue Million Forecast, by Country 2020 & 2033
- Table 9: United States USA Automotive Service Industry Revenue (Million) Forecast, by Application 2020 & 2033
- Table 10: Canada USA Automotive Service Industry Revenue (Million) Forecast, by Application 2020 & 2033
- Table 11: Mexico USA Automotive Service Industry Revenue (Million) Forecast, by Application 2020 & 2033
- Table 12: Global USA Automotive Service Industry Revenue Million Forecast, by Vehicle Type 2020 & 2033
- Table 13: Global USA Automotive Service Industry Revenue Million Forecast, by Service Type 2020 & 2033
- Table 14: Global USA Automotive Service Industry Revenue Million Forecast, by Equipment Type 2020 & 2033
- Table 15: Global USA Automotive Service Industry Revenue Million Forecast, by Country 2020 & 2033
- Table 16: Brazil USA Automotive Service Industry Revenue (Million) Forecast, by Application 2020 & 2033
- Table 17: Argentina USA Automotive Service Industry Revenue (Million) Forecast, by Application 2020 & 2033
- Table 18: Rest of South America USA Automotive Service Industry Revenue (Million) Forecast, by Application 2020 & 2033
- Table 19: Global USA Automotive Service Industry Revenue Million Forecast, by Vehicle Type 2020 & 2033
- Table 20: Global USA Automotive Service Industry Revenue Million Forecast, by Service Type 2020 & 2033
- Table 21: Global USA Automotive Service Industry Revenue Million Forecast, by Equipment Type 2020 & 2033
- Table 22: Global USA Automotive Service Industry Revenue Million Forecast, by Country 2020 & 2033
- Table 23: United Kingdom USA Automotive Service Industry Revenue (Million) Forecast, by Application 2020 & 2033
- Table 24: Germany USA Automotive Service Industry Revenue (Million) Forecast, by Application 2020 & 2033
- Table 25: France USA Automotive Service Industry Revenue (Million) Forecast, by Application 2020 & 2033
- Table 26: Italy USA Automotive Service Industry Revenue (Million) Forecast, by Application 2020 & 2033
- Table 27: Spain USA Automotive Service Industry Revenue (Million) Forecast, by Application 2020 & 2033
- Table 28: Russia USA Automotive Service Industry Revenue (Million) Forecast, by Application 2020 & 2033
- Table 29: Benelux USA Automotive Service Industry Revenue (Million) Forecast, by Application 2020 & 2033
- Table 30: Nordics USA Automotive Service Industry Revenue (Million) Forecast, by Application 2020 & 2033
- Table 31: Rest of Europe USA Automotive Service Industry Revenue (Million) Forecast, by Application 2020 & 2033
- Table 32: Global USA Automotive Service Industry Revenue Million Forecast, by Vehicle Type 2020 & 2033
- Table 33: Global USA Automotive Service Industry Revenue Million Forecast, by Service Type 2020 & 2033
- Table 34: Global USA Automotive Service Industry Revenue Million Forecast, by Equipment Type 2020 & 2033
- Table 35: Global USA Automotive Service Industry Revenue Million Forecast, by Country 2020 & 2033
- Table 36: Turkey USA Automotive Service Industry Revenue (Million) Forecast, by Application 2020 & 2033
- Table 37: Israel USA Automotive Service Industry Revenue (Million) Forecast, by Application 2020 & 2033
- Table 38: GCC USA Automotive Service Industry Revenue (Million) Forecast, by Application 2020 & 2033
- Table 39: North Africa USA Automotive Service Industry Revenue (Million) Forecast, by Application 2020 & 2033
- Table 40: South Africa USA Automotive Service Industry Revenue (Million) Forecast, by Application 2020 & 2033
- Table 41: Rest of Middle East & Africa USA Automotive Service Industry Revenue (Million) Forecast, by Application 2020 & 2033
- Table 42: Global USA Automotive Service Industry Revenue Million Forecast, by Vehicle Type 2020 & 2033
- Table 43: Global USA Automotive Service Industry Revenue Million Forecast, by Service Type 2020 & 2033
- Table 44: Global USA Automotive Service Industry Revenue Million Forecast, by Equipment Type 2020 & 2033
- Table 45: Global USA Automotive Service Industry Revenue Million Forecast, by Country 2020 & 2033
- Table 46: China USA Automotive Service Industry Revenue (Million) Forecast, by Application 2020 & 2033
- Table 47: India USA Automotive Service Industry Revenue (Million) Forecast, by Application 2020 & 2033
- Table 48: Japan USA Automotive Service Industry Revenue (Million) Forecast, by Application 2020 & 2033
- Table 49: South Korea USA Automotive Service Industry Revenue (Million) Forecast, by Application 2020 & 2033
- Table 50: ASEAN USA Automotive Service Industry Revenue (Million) Forecast, by Application 2020 & 2033
- Table 51: Oceania USA Automotive Service Industry Revenue (Million) Forecast, by Application 2020 & 2033
- Table 52: Rest of Asia Pacific USA Automotive Service Industry Revenue (Million) Forecast, by Application 2020 & 2033
Frequently Asked Questions
1. What is the projected Compound Annual Growth Rate (CAGR) of the USA Automotive Service Industry?
The projected CAGR is approximately 5.98%.
2. Which companies are prominent players in the USA Automotive Service Industry?
Key companies in the market include Midas International LLC, Meineke Car Care Centers LLC, Pep Boy, Firestone Complete Auto Care, Safelite Group, Monro Inc, Jiffy Lube International Inc, Walmart Inc.
3. What are the main segments of the USA Automotive Service Industry?
The market segments include Vehicle Type, Service Type, Equipment Type.
4. Can you provide details about the market size?
The market size is estimated to be USD 188.13 Million as of 2022.
5. What are some drivers contributing to market growth?
Increasing Sales of Electric Vehicles are Expected to Drive the Market.
6. What are the notable trends driving market growth?
Growing Demand for Commercial Vehicles Likely to Drive the Market.
7. Are there any restraints impacting market growth?
Lack of Infrastructure May Hamper the growth of the Market.
8. Can you provide examples of recent developments in the market?
In December 2022, AutoNation Inc., one of America's largest automotive retailers, announced the acquisition of RepairSmith, a full-service mobile solution for automotive repair and maintenance headquartered in Los Angeles, CA, with a significant operational footprint in the southern and western United States.
9. What pricing options are available for accessing the report?
Pricing options include single-user, multi-user, and enterprise licenses priced at USD 3800, USD 4500, and USD 5800 respectively.
10. Is the market size provided in terms of value or volume?
The market size is provided in terms of value, measured in Million.
11. Are there any specific market keywords associated with the report?
Yes, the market keyword associated with the report is "USA Automotive Service Industry," which aids in identifying and referencing the specific market segment covered.
12. How do I determine which pricing option suits my needs best?
The pricing options vary based on user requirements and access needs. Individual users may opt for single-user licenses, while businesses requiring broader access may choose multi-user or enterprise licenses for cost-effective access to the report.
13. Are there any additional resources or data provided in the USA Automotive Service Industry report?
While the report offers comprehensive insights, it's advisable to review the specific contents or supplementary materials provided to ascertain if additional resources or data are available.
14. How can I stay updated on further developments or reports in the USA Automotive Service Industry?
To stay informed about further developments, trends, and reports in the USA Automotive Service Industry, consider subscribing to industry newsletters, following relevant companies and organizations, or regularly checking reputable industry news sources and publications.
Methodology
Step 1 - Identification of Relevant Samples Size from Population Database


Step 2 - Approaches for Defining Global Market Size (Value, Volume* & Price*)

Note*: In applicable scenarios
Step 3 - Data Sources
Primary Research
- Web Analytics
- Survey Reports
- Research Institute
- Latest Research Reports
- Opinion Leaders
Secondary Research
- Annual Reports
- White Paper
- Latest Press Release
- Industry Association
- Paid Database
- Investor Presentations

Step 4 - Data Triangulation
Involves using different sources of information in order to increase the validity of a study
These sources are likely to be stakeholders in a program - participants, other researchers, program staff, other community members, and so on.
Then we put all data in single framework & apply various statistical tools to find out the dynamic on the market.
During the analysis stage, feedback from the stakeholder groups would be compared to determine areas of agreement as well as areas of divergence