

Key Insights
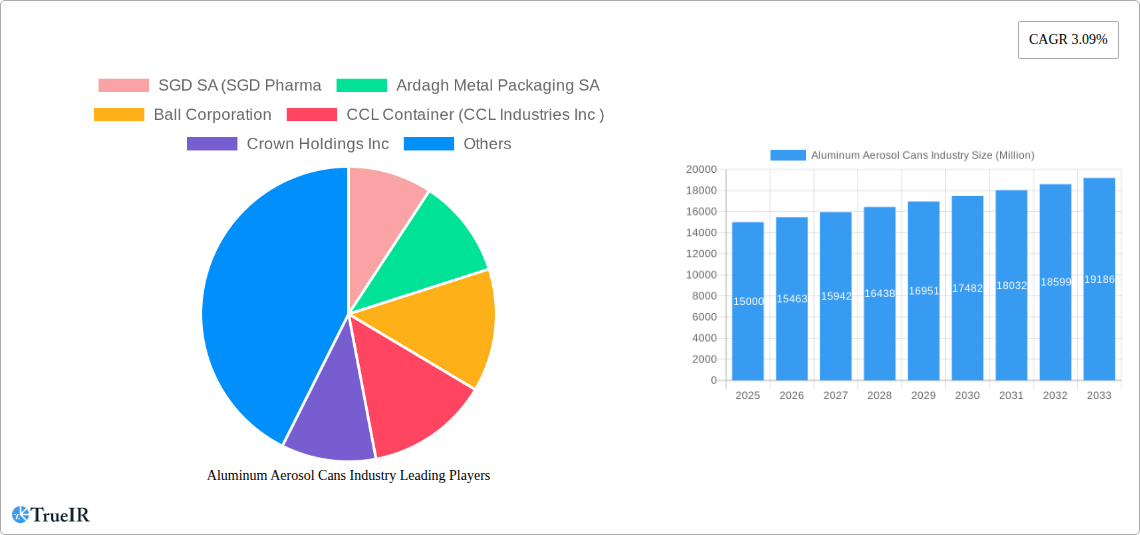
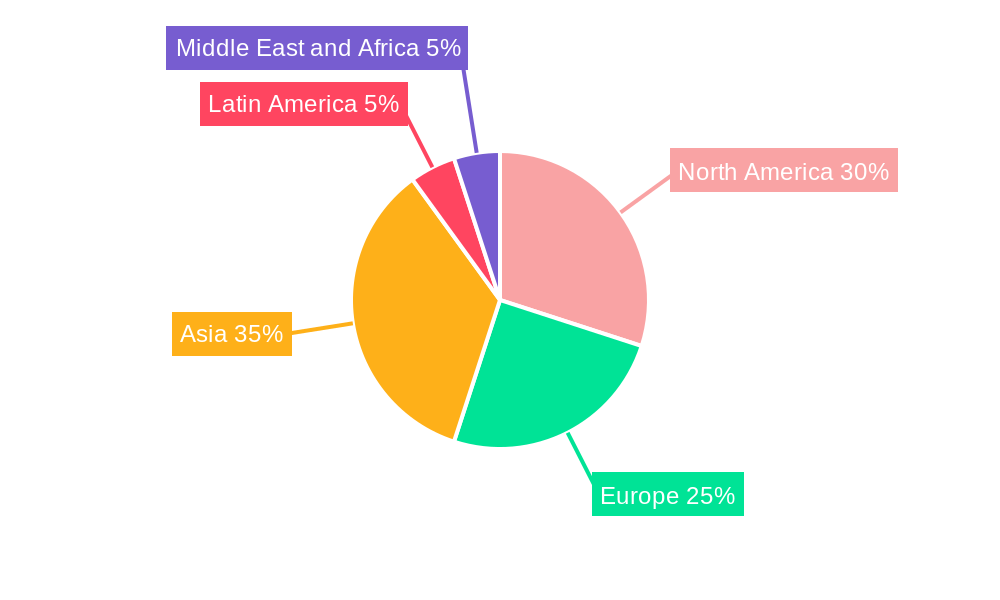
The global aluminum aerosol can market, currently experiencing a Compound Annual Growth Rate (CAGR) of 3.09%, presents a significant opportunity for manufacturers and investors. Driven by the rising demand for personal care and household care products, coupled with the increasing adoption of aluminum in the automotive and healthcare sectors due to its lightweight and recyclable nature, the market is projected to witness substantial growth over the next decade. The preference for sustainable packaging solutions is further fueling market expansion, with aluminum's recyclability being a key differentiator. While fluctuating raw material prices and potential supply chain disruptions pose challenges, the market is resilient due to its essential role in numerous consumer goods sectors. Segmentation analysis reveals that the personal care segment currently holds a dominant market share, followed closely by the household care sector. Steel and other materials compete with aluminum, but aluminum's inherent properties – lightweight, durability, and recyclability – contribute to its continued market dominance. Geographical analysis indicates strong growth in Asia-Pacific, particularly in China and India, driven by rising disposable incomes and increasing consumer spending on packaged goods. North America and Europe, while mature markets, continue to contribute significantly to overall market value, reflecting consistent demand for convenience and ease of use associated with aerosol packaging.
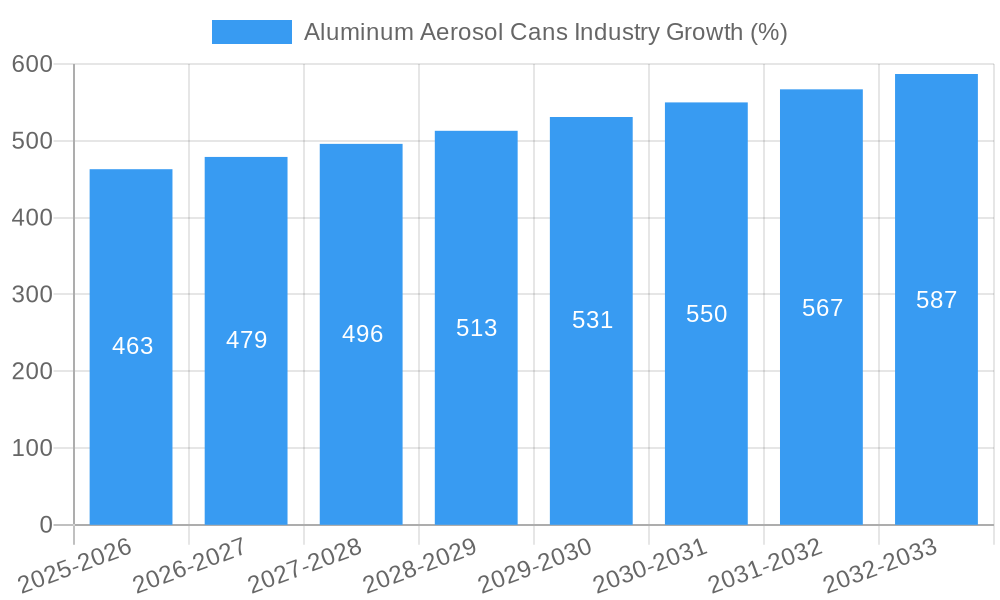
The forecast period (2025-2033) anticipates continued growth, with projections indicating a robust expansion in market size. Key players, including SGD SA, Ardagh Metal Packaging, Ball Corporation, and Crown Holdings Inc., are strategically investing in research and development to improve product designs, enhance recyclability, and expand their product portfolios to meet evolving consumer preferences. Competition among these established companies, along with the entry of new players, will likely intensify, leading to innovative product offerings and increased market competitiveness. The long-term outlook for the aluminum aerosol can market remains positive, supported by consistent consumer demand, technological advancements in manufacturing and recycling processes, and a growing focus on sustainability within the packaging industry.
Aluminum Aerosol Cans Industry Market Report: 2019-2033
This comprehensive report provides an in-depth analysis of the global Aluminum Aerosol Cans Industry, offering valuable insights into market dynamics, competitive landscapes, and future growth prospects. The study period covers 2019-2033, with 2025 serving as the base and estimated year. This report is essential for businesses, investors, and stakeholders seeking to understand and capitalize on opportunities within this dynamic sector. The market is projected to reach xx Million by 2033, exhibiting a robust CAGR.
Aluminum Aerosol Cans Industry Market Structure & Competitive Landscape
The Aluminum Aerosol Cans industry is characterized by a moderately concentrated market structure, with a few major players holding significant market share. The Herfindahl-Hirschman Index (HHI) for 2024 is estimated at xx, indicating a moderately concentrated market. Innovation is a key driver, with companies constantly seeking to improve can design, materials, and manufacturing processes to enhance sustainability and performance. Regulatory pressures, particularly concerning environmental sustainability and material sourcing, significantly influence industry practices. Product substitutes, such as pouches and other packaging types, present competitive challenges. The industry is segmented by material type (steel, aluminum, other) and end-user industry (personal care, household care, automotive, healthcare, other).
- Market Concentration: The top five players account for approximately xx% of global market share in 2024.
- Innovation Drivers: Lightweighting, recyclability improvements, and sustainable material sourcing are key focus areas.
- Regulatory Impacts: Stringent environmental regulations are driving the adoption of sustainable practices.
- Product Substitutes: Competition from alternative packaging solutions, including pouches and pumps, is increasing.
- M&A Trends: Consolidation is expected to continue, with larger players acquiring smaller companies to expand their market reach and product portfolios. The total value of M&A transactions in the industry between 2019 and 2024 is estimated at xx Million.
Aluminum Aerosol Cans Industry Market Trends & Opportunities
The global Aluminum Aerosol Cans market exhibits significant growth potential, driven by expanding consumer demand across various end-user sectors. The market size is estimated at xx Million in 2025 and is projected to reach xx Million by 2033, driven by a CAGR of xx%. Several key trends shape the market: increasing adoption of sustainable packaging solutions, growing demand from emerging economies, and technological advancements in can manufacturing. Consumer preferences increasingly favor eco-friendly options, pushing manufacturers to invest in sustainable materials and recyclable designs. The competitive landscape is highly dynamic, with companies focusing on product innovation, brand building, and efficient supply chain management to gain market share. Market penetration rates for aluminum cans in key segments like personal care and household care are expected to increase steadily during the forecast period.
Dominant Markets & Segments in Aluminum Aerosol Cans Industry
The Aluminum Aerosol Cans market demonstrates strong regional variations in growth and dominance. North America and Europe currently represent significant markets, while Asia-Pacific shows promising growth potential due to increasing consumer spending and industrial expansion. Within the segmentation, the aluminum material type holds the largest market share. The personal care segment exhibits dominant demand, followed by household care and automotive.
Key Growth Drivers:
- North America: Strong consumer spending and well-established distribution networks.
- Europe: High environmental awareness and stringent regulations driving sustainable packaging adoption.
- Asia-Pacific: Rapid economic growth, increasing urbanization, and rising disposable incomes fuel demand.
- Personal Care: High demand for aerosol-based products like deodorants, hairsprays, and perfumes.
- Aluminum Material: Lightweight, recyclable, and offers superior barrier properties compared to other materials.
Aluminum Aerosol Cans Industry Product Analysis
Technological advancements in aerosol can manufacturing focus on improved lightweighting, enhanced recyclability, and sustainable material usage. These innovations provide competitive advantages by reducing production costs, minimizing environmental impact, and appealing to environmentally conscious consumers. Aluminum alloy formulations are optimized for strength and durability while reducing overall weight. The market fit for these innovations is strong, given the growing demand for sustainable and efficient packaging solutions.
Key Drivers, Barriers & Challenges in Aluminum Aerosol Cans Industry
Key Drivers:
The industry is propelled by several factors, including: growing consumer demand for convenience and portability in various product categories, technological advancements leading to improved can designs, and government regulations promoting the use of recyclable and sustainable packaging.
Challenges and Restraints:
The Aluminum Aerosol Cans industry faces various challenges, including fluctuating raw material prices impacting production costs, stringent environmental regulations leading to compliance complexities and cost increases, and increasing competition from alternative packaging solutions. These factors collectively exert pressure on profit margins and market growth.
Growth Drivers in the Aluminum Aerosol Cans Industry Market
Growth is driven by increasing demand across various end-user industries, particularly personal care and household care. Technological advancements in can manufacturing and design enhance sustainability, cost-efficiency, and functionality, stimulating market growth. Favorable regulatory frameworks promoting recyclable materials further boost the industry's trajectory.
Challenges Impacting Aluminum Aerosol Cans Industry Growth
The Aluminum Aerosol Cans industry faces challenges such as fluctuating raw material prices, impacting production costs and profitability. Stringent environmental regulations necessitate investments in sustainable technologies, increasing operational expenses. Competition from alternative packaging solutions poses a constant threat, requiring manufacturers to continuously innovate and enhance product offerings.
Key Players Shaping the Aluminum Aerosol Cans Industry Market
- SGD SA (SGD Pharma)
- Ardagh Metal Packaging SA
- Ball Corporation
- CCL Container (CCL Industries Inc)
- Crown Holdings Inc
- Trivium Packaging
- Graham Packaging Company
- Colep Packaging Portugal SA
- Mauser Packaging Solutions (Bway Corporation)
- CPMC Holdings Limited
- Toyo Seikan Co Ltd
- NAMPAK Ltd
Significant Aluminum Aerosol Cans Industry Industry Milestones
- February 2024: Lindal Group joins the UK Aerosol Recycling Initiative, aiming for a 50% recycling rate by 2030. This signifies a significant step towards sustainable practices within the industry.
- February 2024: Unilever launches Lynx Fine Fragrance Collection in 150ml aerosol cans, targeting Gen-Z males and potentially influencing consumer preferences towards premium aerosol products.
Future Outlook for Aluminum Aerosol Cans Industry Market
The Aluminum Aerosol Cans industry is poised for continued growth, driven by increasing demand, technological advancements focusing on sustainability, and favorable regulatory environments. Strategic opportunities exist in expanding into emerging markets, developing innovative can designs, and strengthening supply chain resilience. The market's potential for expansion remains significant, particularly with the ongoing focus on eco-friendly packaging solutions.
Aluminum Aerosol Cans Industry Segmentation
-
1. Material Type
- 1.1. Steel
- 1.2. Aluminium
- 1.3. Other Material Type
-
2. End-user Industry
- 2.1. Personal Care
- 2.2. Household Care
- 2.3. Automotive
- 2.4. Healthcare
- 2.5. Other End-user Industries
Aluminum Aerosol Cans Industry Segmentation By Geography
-
1. North America
- 1.1. United States
- 1.2. Canada
-
2. Europe
- 2.1. France
- 2.2. Germany
- 2.3. Italy
- 2.4. Spain
- 2.5. United Kingdom
-
3. Asia
- 3.1. China
- 3.2. India
- 3.3. Japan
- 4. Australia and New Zealand
-
5. Latin America
- 5.1. Brazil
- 5.2. Argentina
- 5.3. Mexico
-
6. Middle East and Africa
- 6.1. Saudi Arabia
- 6.2. United Arab Emirates
- 6.3. South Africa
Aluminum Aerosol Cans Industry REPORT HIGHLIGHTS
| Aspects | Details |
|---|---|
| Study Period | 2019-2033 |
| Base Year | 2024 |
| Estimated Year | 2025 |
| Forecast Period | 2025-2033 |
| Historical Period | 2019-2024 |
| Growth Rate | CAGR of 3.09% from 2019-2033 |
| Segmentation |
|
Table of Contents
- 1. Introduction
- 1.1. Research Scope
- 1.2. Market Segmentation
- 1.3. Research Methodology
- 1.4. Definitions and Assumptions
- 2. Executive Summary
- 2.1. Introduction
- 3. Market Dynamics
- 3.1. Introduction
- 3.2. Market Drivers
- 3.2.1. Recyclability of Aerosol Cans; Growing Demand from the Personal Care and Cosmetics Industry
- 3.3. Market Restrains
- 3.3.1. Stringent Regulations Regarding Waste Disposal
- 3.4. Market Trends
- 3.4.1. The Automotive Industry to be the Fastest Growing End User
- 4. Market Factor Analysis
- 4.1. Porters Five Forces
- 4.2. Supply/Value Chain
- 4.3. PESTEL analysis
- 4.4. Market Entropy
- 4.5. Patent/Trademark Analysis
- 5. Global Aluminum Aerosol Cans Industry Analysis, Insights and Forecast, 2019-2031
- 5.1. Market Analysis, Insights and Forecast - by Material Type
- 5.1.1. Steel
- 5.1.2. Aluminium
- 5.1.3. Other Material Type
- 5.2. Market Analysis, Insights and Forecast - by End-user Industry
- 5.2.1. Personal Care
- 5.2.2. Household Care
- 5.2.3. Automotive
- 5.2.4. Healthcare
- 5.2.5. Other End-user Industries
- 5.3. Market Analysis, Insights and Forecast - by Region
- 5.3.1. North America
- 5.3.2. Europe
- 5.3.3. Asia
- 5.3.4. Australia and New Zealand
- 5.3.5. Latin America
- 5.3.6. Middle East and Africa
- 5.1. Market Analysis, Insights and Forecast - by Material Type
- 6. North America Aluminum Aerosol Cans Industry Analysis, Insights and Forecast, 2019-2031
- 6.1. Market Analysis, Insights and Forecast - by Material Type
- 6.1.1. Steel
- 6.1.2. Aluminium
- 6.1.3. Other Material Type
- 6.2. Market Analysis, Insights and Forecast - by End-user Industry
- 6.2.1. Personal Care
- 6.2.2. Household Care
- 6.2.3. Automotive
- 6.2.4. Healthcare
- 6.2.5. Other End-user Industries
- 6.1. Market Analysis, Insights and Forecast - by Material Type
- 7. Europe Aluminum Aerosol Cans Industry Analysis, Insights and Forecast, 2019-2031
- 7.1. Market Analysis, Insights and Forecast - by Material Type
- 7.1.1. Steel
- 7.1.2. Aluminium
- 7.1.3. Other Material Type
- 7.2. Market Analysis, Insights and Forecast - by End-user Industry
- 7.2.1. Personal Care
- 7.2.2. Household Care
- 7.2.3. Automotive
- 7.2.4. Healthcare
- 7.2.5. Other End-user Industries
- 7.1. Market Analysis, Insights and Forecast - by Material Type
- 8. Asia Aluminum Aerosol Cans Industry Analysis, Insights and Forecast, 2019-2031
- 8.1. Market Analysis, Insights and Forecast - by Material Type
- 8.1.1. Steel
- 8.1.2. Aluminium
- 8.1.3. Other Material Type
- 8.2. Market Analysis, Insights and Forecast - by End-user Industry
- 8.2.1. Personal Care
- 8.2.2. Household Care
- 8.2.3. Automotive
- 8.2.4. Healthcare
- 8.2.5. Other End-user Industries
- 8.1. Market Analysis, Insights and Forecast - by Material Type
- 9. Australia and New Zealand Aluminum Aerosol Cans Industry Analysis, Insights and Forecast, 2019-2031
- 9.1. Market Analysis, Insights and Forecast - by Material Type
- 9.1.1. Steel
- 9.1.2. Aluminium
- 9.1.3. Other Material Type
- 9.2. Market Analysis, Insights and Forecast - by End-user Industry
- 9.2.1. Personal Care
- 9.2.2. Household Care
- 9.2.3. Automotive
- 9.2.4. Healthcare
- 9.2.5. Other End-user Industries
- 9.1. Market Analysis, Insights and Forecast - by Material Type
- 10. Latin America Aluminum Aerosol Cans Industry Analysis, Insights and Forecast, 2019-2031
- 10.1. Market Analysis, Insights and Forecast - by Material Type
- 10.1.1. Steel
- 10.1.2. Aluminium
- 10.1.3. Other Material Type
- 10.2. Market Analysis, Insights and Forecast - by End-user Industry
- 10.2.1. Personal Care
- 10.2.2. Household Care
- 10.2.3. Automotive
- 10.2.4. Healthcare
- 10.2.5. Other End-user Industries
- 10.1. Market Analysis, Insights and Forecast - by Material Type
- 11. Middle East and Africa Aluminum Aerosol Cans Industry Analysis, Insights and Forecast, 2019-2031
- 11.1. Market Analysis, Insights and Forecast - by Material Type
- 11.1.1. Steel
- 11.1.2. Aluminium
- 11.1.3. Other Material Type
- 11.2. Market Analysis, Insights and Forecast - by End-user Industry
- 11.2.1. Personal Care
- 11.2.2. Household Care
- 11.2.3. Automotive
- 11.2.4. Healthcare
- 11.2.5. Other End-user Industries
- 11.1. Market Analysis, Insights and Forecast - by Material Type
- 12. North America Aluminum Aerosol Cans Industry Analysis, Insights and Forecast, 2019-2031
- 12.1. Market Analysis, Insights and Forecast - By Country/Sub-region
- 12.1.1 United States
- 12.1.2 Canada
- 13. Europe Aluminum Aerosol Cans Industry Analysis, Insights and Forecast, 2019-2031
- 13.1. Market Analysis, Insights and Forecast - By Country/Sub-region
- 13.1.1 France
- 13.1.2 Germany
- 13.1.3 Italy
- 13.1.4 Spain
- 13.1.5 United Kingdom
- 14. Asia Aluminum Aerosol Cans Industry Analysis, Insights and Forecast, 2019-2031
- 14.1. Market Analysis, Insights and Forecast - By Country/Sub-region
- 14.1.1 China
- 14.1.2 India
- 14.1.3 Japan
- 14.1.4 Australia and New Zealand
- 15. Latin America Aluminum Aerosol Cans Industry Analysis, Insights and Forecast, 2019-2031
- 15.1. Market Analysis, Insights and Forecast - By Country/Sub-region
- 15.1.1 Brazil
- 15.1.2 Argentina
- 15.1.3 Mexico
- 16. Middle East and Africa Aluminum Aerosol Cans Industry Analysis, Insights and Forecast, 2019-2031
- 16.1. Market Analysis, Insights and Forecast - By Country/Sub-region
- 16.1.1 Saudi Arabia
- 16.1.2 United Arab Emirates
- 16.1.3 South Africa
- 17. Competitive Analysis
- 17.1. Global Market Share Analysis 2024
- 17.2. Company Profiles
- 17.2.1 SGD SA (SGD Pharma
- 17.2.1.1. Overview
- 17.2.1.2. Products
- 17.2.1.3. SWOT Analysis
- 17.2.1.4. Recent Developments
- 17.2.1.5. Financials (Based on Availability)
- 17.2.2 Ardagh Metal Packaging SA
- 17.2.2.1. Overview
- 17.2.2.2. Products
- 17.2.2.3. SWOT Analysis
- 17.2.2.4. Recent Developments
- 17.2.2.5. Financials (Based on Availability)
- 17.2.3 Ball Corporation
- 17.2.3.1. Overview
- 17.2.3.2. Products
- 17.2.3.3. SWOT Analysis
- 17.2.3.4. Recent Developments
- 17.2.3.5. Financials (Based on Availability)
- 17.2.4 CCL Container (CCL Industries Inc )
- 17.2.4.1. Overview
- 17.2.4.2. Products
- 17.2.4.3. SWOT Analysis
- 17.2.4.4. Recent Developments
- 17.2.4.5. Financials (Based on Availability)
- 17.2.5 Crown Holdings Inc
- 17.2.5.1. Overview
- 17.2.5.2. Products
- 17.2.5.3. SWOT Analysis
- 17.2.5.4. Recent Developments
- 17.2.5.5. Financials (Based on Availability)
- 17.2.6 Trivium Packaging
- 17.2.6.1. Overview
- 17.2.6.2. Products
- 17.2.6.3. SWOT Analysis
- 17.2.6.4. Recent Developments
- 17.2.6.5. Financials (Based on Availability)
- 17.2.7 Graham Packaging Company
- 17.2.7.1. Overview
- 17.2.7.2. Products
- 17.2.7.3. SWOT Analysis
- 17.2.7.4. Recent Developments
- 17.2.7.5. Financials (Based on Availability)
- 17.2.8 Colep Packaging Portugal SA
- 17.2.8.1. Overview
- 17.2.8.2. Products
- 17.2.8.3. SWOT Analysis
- 17.2.8.4. Recent Developments
- 17.2.8.5. Financials (Based on Availability)
- 17.2.9 Mauser Packaging Solutions (Bway Corporation)
- 17.2.9.1. Overview
- 17.2.9.2. Products
- 17.2.9.3. SWOT Analysis
- 17.2.9.4. Recent Developments
- 17.2.9.5. Financials (Based on Availability)
- 17.2.10 CPMC Holdings Limited
- 17.2.10.1. Overview
- 17.2.10.2. Products
- 17.2.10.3. SWOT Analysis
- 17.2.10.4. Recent Developments
- 17.2.10.5. Financials (Based on Availability)
- 17.2.11 Toyo Seikan Co Ltd
- 17.2.11.1. Overview
- 17.2.11.2. Products
- 17.2.11.3. SWOT Analysis
- 17.2.11.4. Recent Developments
- 17.2.11.5. Financials (Based on Availability)
- 17.2.12 NAMPAK Ltd
- 17.2.12.1. Overview
- 17.2.12.2. Products
- 17.2.12.3. SWOT Analysis
- 17.2.12.4. Recent Developments
- 17.2.12.5. Financials (Based on Availability)
- 17.2.1 SGD SA (SGD Pharma
List of Figures
- Figure 1: Global Aluminum Aerosol Cans Industry Revenue Breakdown (Million, %) by Region 2024 & 2032
- Figure 2: Global Aluminum Aerosol Cans Industry Volume Breakdown (Billion, %) by Region 2024 & 2032
- Figure 3: North America Aluminum Aerosol Cans Industry Revenue (Million), by Country 2024 & 2032
- Figure 4: North America Aluminum Aerosol Cans Industry Volume (Billion), by Country 2024 & 2032
- Figure 5: North America Aluminum Aerosol Cans Industry Revenue Share (%), by Country 2024 & 2032
- Figure 6: North America Aluminum Aerosol Cans Industry Volume Share (%), by Country 2024 & 2032
- Figure 7: Europe Aluminum Aerosol Cans Industry Revenue (Million), by Country 2024 & 2032
- Figure 8: Europe Aluminum Aerosol Cans Industry Volume (Billion), by Country 2024 & 2032
- Figure 9: Europe Aluminum Aerosol Cans Industry Revenue Share (%), by Country 2024 & 2032
- Figure 10: Europe Aluminum Aerosol Cans Industry Volume Share (%), by Country 2024 & 2032
- Figure 11: Asia Aluminum Aerosol Cans Industry Revenue (Million), by Country 2024 & 2032
- Figure 12: Asia Aluminum Aerosol Cans Industry Volume (Billion), by Country 2024 & 2032
- Figure 13: Asia Aluminum Aerosol Cans Industry Revenue Share (%), by Country 2024 & 2032
- Figure 14: Asia Aluminum Aerosol Cans Industry Volume Share (%), by Country 2024 & 2032
- Figure 15: Latin America Aluminum Aerosol Cans Industry Revenue (Million), by Country 2024 & 2032
- Figure 16: Latin America Aluminum Aerosol Cans Industry Volume (Billion), by Country 2024 & 2032
- Figure 17: Latin America Aluminum Aerosol Cans Industry Revenue Share (%), by Country 2024 & 2032
- Figure 18: Latin America Aluminum Aerosol Cans Industry Volume Share (%), by Country 2024 & 2032
- Figure 19: Middle East and Africa Aluminum Aerosol Cans Industry Revenue (Million), by Country 2024 & 2032
- Figure 20: Middle East and Africa Aluminum Aerosol Cans Industry Volume (Billion), by Country 2024 & 2032
- Figure 21: Middle East and Africa Aluminum Aerosol Cans Industry Revenue Share (%), by Country 2024 & 2032
- Figure 22: Middle East and Africa Aluminum Aerosol Cans Industry Volume Share (%), by Country 2024 & 2032
- Figure 23: North America Aluminum Aerosol Cans Industry Revenue (Million), by Material Type 2024 & 2032
- Figure 24: North America Aluminum Aerosol Cans Industry Volume (Billion), by Material Type 2024 & 2032
- Figure 25: North America Aluminum Aerosol Cans Industry Revenue Share (%), by Material Type 2024 & 2032
- Figure 26: North America Aluminum Aerosol Cans Industry Volume Share (%), by Material Type 2024 & 2032
- Figure 27: North America Aluminum Aerosol Cans Industry Revenue (Million), by End-user Industry 2024 & 2032
- Figure 28: North America Aluminum Aerosol Cans Industry Volume (Billion), by End-user Industry 2024 & 2032
- Figure 29: North America Aluminum Aerosol Cans Industry Revenue Share (%), by End-user Industry 2024 & 2032
- Figure 30: North America Aluminum Aerosol Cans Industry Volume Share (%), by End-user Industry 2024 & 2032
- Figure 31: North America Aluminum Aerosol Cans Industry Revenue (Million), by Country 2024 & 2032
- Figure 32: North America Aluminum Aerosol Cans Industry Volume (Billion), by Country 2024 & 2032
- Figure 33: North America Aluminum Aerosol Cans Industry Revenue Share (%), by Country 2024 & 2032
- Figure 34: North America Aluminum Aerosol Cans Industry Volume Share (%), by Country 2024 & 2032
- Figure 35: Europe Aluminum Aerosol Cans Industry Revenue (Million), by Material Type 2024 & 2032
- Figure 36: Europe Aluminum Aerosol Cans Industry Volume (Billion), by Material Type 2024 & 2032
- Figure 37: Europe Aluminum Aerosol Cans Industry Revenue Share (%), by Material Type 2024 & 2032
- Figure 38: Europe Aluminum Aerosol Cans Industry Volume Share (%), by Material Type 2024 & 2032
- Figure 39: Europe Aluminum Aerosol Cans Industry Revenue (Million), by End-user Industry 2024 & 2032
- Figure 40: Europe Aluminum Aerosol Cans Industry Volume (Billion), by End-user Industry 2024 & 2032
- Figure 41: Europe Aluminum Aerosol Cans Industry Revenue Share (%), by End-user Industry 2024 & 2032
- Figure 42: Europe Aluminum Aerosol Cans Industry Volume Share (%), by End-user Industry 2024 & 2032
- Figure 43: Europe Aluminum Aerosol Cans Industry Revenue (Million), by Country 2024 & 2032
- Figure 44: Europe Aluminum Aerosol Cans Industry Volume (Billion), by Country 2024 & 2032
- Figure 45: Europe Aluminum Aerosol Cans Industry Revenue Share (%), by Country 2024 & 2032
- Figure 46: Europe Aluminum Aerosol Cans Industry Volume Share (%), by Country 2024 & 2032
- Figure 47: Asia Aluminum Aerosol Cans Industry Revenue (Million), by Material Type 2024 & 2032
- Figure 48: Asia Aluminum Aerosol Cans Industry Volume (Billion), by Material Type 2024 & 2032
- Figure 49: Asia Aluminum Aerosol Cans Industry Revenue Share (%), by Material Type 2024 & 2032
- Figure 50: Asia Aluminum Aerosol Cans Industry Volume Share (%), by Material Type 2024 & 2032
- Figure 51: Asia Aluminum Aerosol Cans Industry Revenue (Million), by End-user Industry 2024 & 2032
- Figure 52: Asia Aluminum Aerosol Cans Industry Volume (Billion), by End-user Industry 2024 & 2032
- Figure 53: Asia Aluminum Aerosol Cans Industry Revenue Share (%), by End-user Industry 2024 & 2032
- Figure 54: Asia Aluminum Aerosol Cans Industry Volume Share (%), by End-user Industry 2024 & 2032
- Figure 55: Asia Aluminum Aerosol Cans Industry Revenue (Million), by Country 2024 & 2032
- Figure 56: Asia Aluminum Aerosol Cans Industry Volume (Billion), by Country 2024 & 2032
- Figure 57: Asia Aluminum Aerosol Cans Industry Revenue Share (%), by Country 2024 & 2032
- Figure 58: Asia Aluminum Aerosol Cans Industry Volume Share (%), by Country 2024 & 2032
- Figure 59: Australia and New Zealand Aluminum Aerosol Cans Industry Revenue (Million), by Material Type 2024 & 2032
- Figure 60: Australia and New Zealand Aluminum Aerosol Cans Industry Volume (Billion), by Material Type 2024 & 2032
- Figure 61: Australia and New Zealand Aluminum Aerosol Cans Industry Revenue Share (%), by Material Type 2024 & 2032
- Figure 62: Australia and New Zealand Aluminum Aerosol Cans Industry Volume Share (%), by Material Type 2024 & 2032
- Figure 63: Australia and New Zealand Aluminum Aerosol Cans Industry Revenue (Million), by End-user Industry 2024 & 2032
- Figure 64: Australia and New Zealand Aluminum Aerosol Cans Industry Volume (Billion), by End-user Industry 2024 & 2032
- Figure 65: Australia and New Zealand Aluminum Aerosol Cans Industry Revenue Share (%), by End-user Industry 2024 & 2032
- Figure 66: Australia and New Zealand Aluminum Aerosol Cans Industry Volume Share (%), by End-user Industry 2024 & 2032
- Figure 67: Australia and New Zealand Aluminum Aerosol Cans Industry Revenue (Million), by Country 2024 & 2032
- Figure 68: Australia and New Zealand Aluminum Aerosol Cans Industry Volume (Billion), by Country 2024 & 2032
- Figure 69: Australia and New Zealand Aluminum Aerosol Cans Industry Revenue Share (%), by Country 2024 & 2032
- Figure 70: Australia and New Zealand Aluminum Aerosol Cans Industry Volume Share (%), by Country 2024 & 2032
- Figure 71: Latin America Aluminum Aerosol Cans Industry Revenue (Million), by Material Type 2024 & 2032
- Figure 72: Latin America Aluminum Aerosol Cans Industry Volume (Billion), by Material Type 2024 & 2032
- Figure 73: Latin America Aluminum Aerosol Cans Industry Revenue Share (%), by Material Type 2024 & 2032
- Figure 74: Latin America Aluminum Aerosol Cans Industry Volume Share (%), by Material Type 2024 & 2032
- Figure 75: Latin America Aluminum Aerosol Cans Industry Revenue (Million), by End-user Industry 2024 & 2032
- Figure 76: Latin America Aluminum Aerosol Cans Industry Volume (Billion), by End-user Industry 2024 & 2032
- Figure 77: Latin America Aluminum Aerosol Cans Industry Revenue Share (%), by End-user Industry 2024 & 2032
- Figure 78: Latin America Aluminum Aerosol Cans Industry Volume Share (%), by End-user Industry 2024 & 2032
- Figure 79: Latin America Aluminum Aerosol Cans Industry Revenue (Million), by Country 2024 & 2032
- Figure 80: Latin America Aluminum Aerosol Cans Industry Volume (Billion), by Country 2024 & 2032
- Figure 81: Latin America Aluminum Aerosol Cans Industry Revenue Share (%), by Country 2024 & 2032
- Figure 82: Latin America Aluminum Aerosol Cans Industry Volume Share (%), by Country 2024 & 2032
- Figure 83: Middle East and Africa Aluminum Aerosol Cans Industry Revenue (Million), by Material Type 2024 & 2032
- Figure 84: Middle East and Africa Aluminum Aerosol Cans Industry Volume (Billion), by Material Type 2024 & 2032
- Figure 85: Middle East and Africa Aluminum Aerosol Cans Industry Revenue Share (%), by Material Type 2024 & 2032
- Figure 86: Middle East and Africa Aluminum Aerosol Cans Industry Volume Share (%), by Material Type 2024 & 2032
- Figure 87: Middle East and Africa Aluminum Aerosol Cans Industry Revenue (Million), by End-user Industry 2024 & 2032
- Figure 88: Middle East and Africa Aluminum Aerosol Cans Industry Volume (Billion), by End-user Industry 2024 & 2032
- Figure 89: Middle East and Africa Aluminum Aerosol Cans Industry Revenue Share (%), by End-user Industry 2024 & 2032
- Figure 90: Middle East and Africa Aluminum Aerosol Cans Industry Volume Share (%), by End-user Industry 2024 & 2032
- Figure 91: Middle East and Africa Aluminum Aerosol Cans Industry Revenue (Million), by Country 2024 & 2032
- Figure 92: Middle East and Africa Aluminum Aerosol Cans Industry Volume (Billion), by Country 2024 & 2032
- Figure 93: Middle East and Africa Aluminum Aerosol Cans Industry Revenue Share (%), by Country 2024 & 2032
- Figure 94: Middle East and Africa Aluminum Aerosol Cans Industry Volume Share (%), by Country 2024 & 2032
List of Tables
- Table 1: Global Aluminum Aerosol Cans Industry Revenue Million Forecast, by Region 2019 & 2032
- Table 2: Global Aluminum Aerosol Cans Industry Volume Billion Forecast, by Region 2019 & 2032
- Table 3: Global Aluminum Aerosol Cans Industry Revenue Million Forecast, by Material Type 2019 & 2032
- Table 4: Global Aluminum Aerosol Cans Industry Volume Billion Forecast, by Material Type 2019 & 2032
- Table 5: Global Aluminum Aerosol Cans Industry Revenue Million Forecast, by End-user Industry 2019 & 2032
- Table 6: Global Aluminum Aerosol Cans Industry Volume Billion Forecast, by End-user Industry 2019 & 2032
- Table 7: Global Aluminum Aerosol Cans Industry Revenue Million Forecast, by Region 2019 & 2032
- Table 8: Global Aluminum Aerosol Cans Industry Volume Billion Forecast, by Region 2019 & 2032
- Table 9: Global Aluminum Aerosol Cans Industry Revenue Million Forecast, by Country 2019 & 2032
- Table 10: Global Aluminum Aerosol Cans Industry Volume Billion Forecast, by Country 2019 & 2032
- Table 11: United States Aluminum Aerosol Cans Industry Revenue (Million) Forecast, by Application 2019 & 2032
- Table 12: United States Aluminum Aerosol Cans Industry Volume (Billion) Forecast, by Application 2019 & 2032
- Table 13: Canada Aluminum Aerosol Cans Industry Revenue (Million) Forecast, by Application 2019 & 2032
- Table 14: Canada Aluminum Aerosol Cans Industry Volume (Billion) Forecast, by Application 2019 & 2032
- Table 15: Global Aluminum Aerosol Cans Industry Revenue Million Forecast, by Country 2019 & 2032
- Table 16: Global Aluminum Aerosol Cans Industry Volume Billion Forecast, by Country 2019 & 2032
- Table 17: France Aluminum Aerosol Cans Industry Revenue (Million) Forecast, by Application 2019 & 2032
- Table 18: France Aluminum Aerosol Cans Industry Volume (Billion) Forecast, by Application 2019 & 2032
- Table 19: Germany Aluminum Aerosol Cans Industry Revenue (Million) Forecast, by Application 2019 & 2032
- Table 20: Germany Aluminum Aerosol Cans Industry Volume (Billion) Forecast, by Application 2019 & 2032
- Table 21: Italy Aluminum Aerosol Cans Industry Revenue (Million) Forecast, by Application 2019 & 2032
- Table 22: Italy Aluminum Aerosol Cans Industry Volume (Billion) Forecast, by Application 2019 & 2032
- Table 23: Spain Aluminum Aerosol Cans Industry Revenue (Million) Forecast, by Application 2019 & 2032
- Table 24: Spain Aluminum Aerosol Cans Industry Volume (Billion) Forecast, by Application 2019 & 2032
- Table 25: United Kingdom Aluminum Aerosol Cans Industry Revenue (Million) Forecast, by Application 2019 & 2032
- Table 26: United Kingdom Aluminum Aerosol Cans Industry Volume (Billion) Forecast, by Application 2019 & 2032
- Table 27: Global Aluminum Aerosol Cans Industry Revenue Million Forecast, by Country 2019 & 2032
- Table 28: Global Aluminum Aerosol Cans Industry Volume Billion Forecast, by Country 2019 & 2032
- Table 29: China Aluminum Aerosol Cans Industry Revenue (Million) Forecast, by Application 2019 & 2032
- Table 30: China Aluminum Aerosol Cans Industry Volume (Billion) Forecast, by Application 2019 & 2032
- Table 31: India Aluminum Aerosol Cans Industry Revenue (Million) Forecast, by Application 2019 & 2032
- Table 32: India Aluminum Aerosol Cans Industry Volume (Billion) Forecast, by Application 2019 & 2032
- Table 33: Japan Aluminum Aerosol Cans Industry Revenue (Million) Forecast, by Application 2019 & 2032
- Table 34: Japan Aluminum Aerosol Cans Industry Volume (Billion) Forecast, by Application 2019 & 2032
- Table 35: Australia and New Zealand Aluminum Aerosol Cans Industry Revenue (Million) Forecast, by Application 2019 & 2032
- Table 36: Australia and New Zealand Aluminum Aerosol Cans Industry Volume (Billion) Forecast, by Application 2019 & 2032
- Table 37: Global Aluminum Aerosol Cans Industry Revenue Million Forecast, by Country 2019 & 2032
- Table 38: Global Aluminum Aerosol Cans Industry Volume Billion Forecast, by Country 2019 & 2032
- Table 39: Brazil Aluminum Aerosol Cans Industry Revenue (Million) Forecast, by Application 2019 & 2032
- Table 40: Brazil Aluminum Aerosol Cans Industry Volume (Billion) Forecast, by Application 2019 & 2032
- Table 41: Argentina Aluminum Aerosol Cans Industry Revenue (Million) Forecast, by Application 2019 & 2032
- Table 42: Argentina Aluminum Aerosol Cans Industry Volume (Billion) Forecast, by Application 2019 & 2032
- Table 43: Mexico Aluminum Aerosol Cans Industry Revenue (Million) Forecast, by Application 2019 & 2032
- Table 44: Mexico Aluminum Aerosol Cans Industry Volume (Billion) Forecast, by Application 2019 & 2032
- Table 45: Global Aluminum Aerosol Cans Industry Revenue Million Forecast, by Country 2019 & 2032
- Table 46: Global Aluminum Aerosol Cans Industry Volume Billion Forecast, by Country 2019 & 2032
- Table 47: Saudi Arabia Aluminum Aerosol Cans Industry Revenue (Million) Forecast, by Application 2019 & 2032
- Table 48: Saudi Arabia Aluminum Aerosol Cans Industry Volume (Billion) Forecast, by Application 2019 & 2032
- Table 49: United Arab Emirates Aluminum Aerosol Cans Industry Revenue (Million) Forecast, by Application 2019 & 2032
- Table 50: United Arab Emirates Aluminum Aerosol Cans Industry Volume (Billion) Forecast, by Application 2019 & 2032
- Table 51: South Africa Aluminum Aerosol Cans Industry Revenue (Million) Forecast, by Application 2019 & 2032
- Table 52: South Africa Aluminum Aerosol Cans Industry Volume (Billion) Forecast, by Application 2019 & 2032
- Table 53: Global Aluminum Aerosol Cans Industry Revenue Million Forecast, by Material Type 2019 & 2032
- Table 54: Global Aluminum Aerosol Cans Industry Volume Billion Forecast, by Material Type 2019 & 2032
- Table 55: Global Aluminum Aerosol Cans Industry Revenue Million Forecast, by End-user Industry 2019 & 2032
- Table 56: Global Aluminum Aerosol Cans Industry Volume Billion Forecast, by End-user Industry 2019 & 2032
- Table 57: Global Aluminum Aerosol Cans Industry Revenue Million Forecast, by Country 2019 & 2032
- Table 58: Global Aluminum Aerosol Cans Industry Volume Billion Forecast, by Country 2019 & 2032
- Table 59: United States Aluminum Aerosol Cans Industry Revenue (Million) Forecast, by Application 2019 & 2032
- Table 60: United States Aluminum Aerosol Cans Industry Volume (Billion) Forecast, by Application 2019 & 2032
- Table 61: Canada Aluminum Aerosol Cans Industry Revenue (Million) Forecast, by Application 2019 & 2032
- Table 62: Canada Aluminum Aerosol Cans Industry Volume (Billion) Forecast, by Application 2019 & 2032
- Table 63: Global Aluminum Aerosol Cans Industry Revenue Million Forecast, by Material Type 2019 & 2032
- Table 64: Global Aluminum Aerosol Cans Industry Volume Billion Forecast, by Material Type 2019 & 2032
- Table 65: Global Aluminum Aerosol Cans Industry Revenue Million Forecast, by End-user Industry 2019 & 2032
- Table 66: Global Aluminum Aerosol Cans Industry Volume Billion Forecast, by End-user Industry 2019 & 2032
- Table 67: Global Aluminum Aerosol Cans Industry Revenue Million Forecast, by Country 2019 & 2032
- Table 68: Global Aluminum Aerosol Cans Industry Volume Billion Forecast, by Country 2019 & 2032
- Table 69: France Aluminum Aerosol Cans Industry Revenue (Million) Forecast, by Application 2019 & 2032
- Table 70: France Aluminum Aerosol Cans Industry Volume (Billion) Forecast, by Application 2019 & 2032
- Table 71: Germany Aluminum Aerosol Cans Industry Revenue (Million) Forecast, by Application 2019 & 2032
- Table 72: Germany Aluminum Aerosol Cans Industry Volume (Billion) Forecast, by Application 2019 & 2032
- Table 73: Italy Aluminum Aerosol Cans Industry Revenue (Million) Forecast, by Application 2019 & 2032
- Table 74: Italy Aluminum Aerosol Cans Industry Volume (Billion) Forecast, by Application 2019 & 2032
- Table 75: Spain Aluminum Aerosol Cans Industry Revenue (Million) Forecast, by Application 2019 & 2032
- Table 76: Spain Aluminum Aerosol Cans Industry Volume (Billion) Forecast, by Application 2019 & 2032
- Table 77: United Kingdom Aluminum Aerosol Cans Industry Revenue (Million) Forecast, by Application 2019 & 2032
- Table 78: United Kingdom Aluminum Aerosol Cans Industry Volume (Billion) Forecast, by Application 2019 & 2032
- Table 79: Global Aluminum Aerosol Cans Industry Revenue Million Forecast, by Material Type 2019 & 2032
- Table 80: Global Aluminum Aerosol Cans Industry Volume Billion Forecast, by Material Type 2019 & 2032
- Table 81: Global Aluminum Aerosol Cans Industry Revenue Million Forecast, by End-user Industry 2019 & 2032
- Table 82: Global Aluminum Aerosol Cans Industry Volume Billion Forecast, by End-user Industry 2019 & 2032
- Table 83: Global Aluminum Aerosol Cans Industry Revenue Million Forecast, by Country 2019 & 2032
- Table 84: Global Aluminum Aerosol Cans Industry Volume Billion Forecast, by Country 2019 & 2032
- Table 85: China Aluminum Aerosol Cans Industry Revenue (Million) Forecast, by Application 2019 & 2032
- Table 86: China Aluminum Aerosol Cans Industry Volume (Billion) Forecast, by Application 2019 & 2032
- Table 87: India Aluminum Aerosol Cans Industry Revenue (Million) Forecast, by Application 2019 & 2032
- Table 88: India Aluminum Aerosol Cans Industry Volume (Billion) Forecast, by Application 2019 & 2032
- Table 89: Japan Aluminum Aerosol Cans Industry Revenue (Million) Forecast, by Application 2019 & 2032
- Table 90: Japan Aluminum Aerosol Cans Industry Volume (Billion) Forecast, by Application 2019 & 2032
- Table 91: Global Aluminum Aerosol Cans Industry Revenue Million Forecast, by Material Type 2019 & 2032
- Table 92: Global Aluminum Aerosol Cans Industry Volume Billion Forecast, by Material Type 2019 & 2032
- Table 93: Global Aluminum Aerosol Cans Industry Revenue Million Forecast, by End-user Industry 2019 & 2032
- Table 94: Global Aluminum Aerosol Cans Industry Volume Billion Forecast, by End-user Industry 2019 & 2032
- Table 95: Global Aluminum Aerosol Cans Industry Revenue Million Forecast, by Country 2019 & 2032
- Table 96: Global Aluminum Aerosol Cans Industry Volume Billion Forecast, by Country 2019 & 2032
- Table 97: Global Aluminum Aerosol Cans Industry Revenue Million Forecast, by Material Type 2019 & 2032
- Table 98: Global Aluminum Aerosol Cans Industry Volume Billion Forecast, by Material Type 2019 & 2032
- Table 99: Global Aluminum Aerosol Cans Industry Revenue Million Forecast, by End-user Industry 2019 & 2032
- Table 100: Global Aluminum Aerosol Cans Industry Volume Billion Forecast, by End-user Industry 2019 & 2032
- Table 101: Global Aluminum Aerosol Cans Industry Revenue Million Forecast, by Country 2019 & 2032
- Table 102: Global Aluminum Aerosol Cans Industry Volume Billion Forecast, by Country 2019 & 2032
- Table 103: Brazil Aluminum Aerosol Cans Industry Revenue (Million) Forecast, by Application 2019 & 2032
- Table 104: Brazil Aluminum Aerosol Cans Industry Volume (Billion) Forecast, by Application 2019 & 2032
- Table 105: Argentina Aluminum Aerosol Cans Industry Revenue (Million) Forecast, by Application 2019 & 2032
- Table 106: Argentina Aluminum Aerosol Cans Industry Volume (Billion) Forecast, by Application 2019 & 2032
- Table 107: Mexico Aluminum Aerosol Cans Industry Revenue (Million) Forecast, by Application 2019 & 2032
- Table 108: Mexico Aluminum Aerosol Cans Industry Volume (Billion) Forecast, by Application 2019 & 2032
- Table 109: Global Aluminum Aerosol Cans Industry Revenue Million Forecast, by Material Type 2019 & 2032
- Table 110: Global Aluminum Aerosol Cans Industry Volume Billion Forecast, by Material Type 2019 & 2032
- Table 111: Global Aluminum Aerosol Cans Industry Revenue Million Forecast, by End-user Industry 2019 & 2032
- Table 112: Global Aluminum Aerosol Cans Industry Volume Billion Forecast, by End-user Industry 2019 & 2032
- Table 113: Global Aluminum Aerosol Cans Industry Revenue Million Forecast, by Country 2019 & 2032
- Table 114: Global Aluminum Aerosol Cans Industry Volume Billion Forecast, by Country 2019 & 2032
- Table 115: Saudi Arabia Aluminum Aerosol Cans Industry Revenue (Million) Forecast, by Application 2019 & 2032
- Table 116: Saudi Arabia Aluminum Aerosol Cans Industry Volume (Billion) Forecast, by Application 2019 & 2032
- Table 117: United Arab Emirates Aluminum Aerosol Cans Industry Revenue (Million) Forecast, by Application 2019 & 2032
- Table 118: United Arab Emirates Aluminum Aerosol Cans Industry Volume (Billion) Forecast, by Application 2019 & 2032
- Table 119: South Africa Aluminum Aerosol Cans Industry Revenue (Million) Forecast, by Application 2019 & 2032
- Table 120: South Africa Aluminum Aerosol Cans Industry Volume (Billion) Forecast, by Application 2019 & 2032
Frequently Asked Questions
1. What is the projected Compound Annual Growth Rate (CAGR) of the Aluminum Aerosol Cans Industry?
The projected CAGR is approximately 3.09%.
2. Which companies are prominent players in the Aluminum Aerosol Cans Industry?
Key companies in the market include SGD SA (SGD Pharma, Ardagh Metal Packaging SA, Ball Corporation, CCL Container (CCL Industries Inc ), Crown Holdings Inc, Trivium Packaging, Graham Packaging Company, Colep Packaging Portugal SA, Mauser Packaging Solutions (Bway Corporation), CPMC Holdings Limited, Toyo Seikan Co Ltd, NAMPAK Ltd.
3. What are the main segments of the Aluminum Aerosol Cans Industry?
The market segments include Material Type, End-user Industry.
4. Can you provide details about the market size?
The market size is estimated to be USD XX Million as of 2022.
5. What are some drivers contributing to market growth?
Recyclability of Aerosol Cans; Growing Demand from the Personal Care and Cosmetics Industry.
6. What are the notable trends driving market growth?
The Automotive Industry to be the Fastest Growing End User.
7. Are there any restraints impacting market growth?
Stringent Regulations Regarding Waste Disposal.
8. Can you provide examples of recent developments in the market?
February 2024: Lindal Group, a prominent player in the global market for specialized valves, actuators, and spray caps utilized in aerosol products, became a founding partner in the United Kingdom Aerosol Recycling Initiative. This initiative, led by Alupro, aims to enhance awareness and adoption of aerosol recycling throughout the United Kingdom. With the overarching goal of achieving a recycling rate of 50% by 2030, the program unites major corporations and influencers spanning the entire aerosol supply chain. Together, they seek to impact national progress toward sustainable aerosol recycling practices.
9. What pricing options are available for accessing the report?
Pricing options include single-user, multi-user, and enterprise licenses priced at USD 4750, USD 5250, and USD 8750 respectively.
10. Is the market size provided in terms of value or volume?
The market size is provided in terms of value, measured in Million and volume, measured in Billion.
11. Are there any specific market keywords associated with the report?
Yes, the market keyword associated with the report is "Aluminum Aerosol Cans Industry," which aids in identifying and referencing the specific market segment covered.
12. How do I determine which pricing option suits my needs best?
The pricing options vary based on user requirements and access needs. Individual users may opt for single-user licenses, while businesses requiring broader access may choose multi-user or enterprise licenses for cost-effective access to the report.
13. Are there any additional resources or data provided in the Aluminum Aerosol Cans Industry report?
While the report offers comprehensive insights, it's advisable to review the specific contents or supplementary materials provided to ascertain if additional resources or data are available.
14. How can I stay updated on further developments or reports in the Aluminum Aerosol Cans Industry?
To stay informed about further developments, trends, and reports in the Aluminum Aerosol Cans Industry, consider subscribing to industry newsletters, following relevant companies and organizations, or regularly checking reputable industry news sources and publications.
Methodology
Step 1 - Identification of Relevant Samples Size from Population Database


Step 2 - Approaches for Defining Global Market Size (Value, Volume* & Price*)

Note*: In applicable scenarios
Step 3 - Data Sources
Primary Research
- Web Analytics
- Survey Reports
- Research Institute
- Latest Research Reports
- Opinion Leaders
Secondary Research
- Annual Reports
- White Paper
- Latest Press Release
- Industry Association
- Paid Database
- Investor Presentations

Step 4 - Data Triangulation
Involves using different sources of information in order to increase the validity of a study
These sources are likely to be stakeholders in a program - participants, other researchers, program staff, other community members, and so on.
Then we put all data in single framework & apply various statistical tools to find out the dynamic on the market.
During the analysis stage, feedback from the stakeholder groups would be compared to determine areas of agreement as well as areas of divergence
