

Key Insights
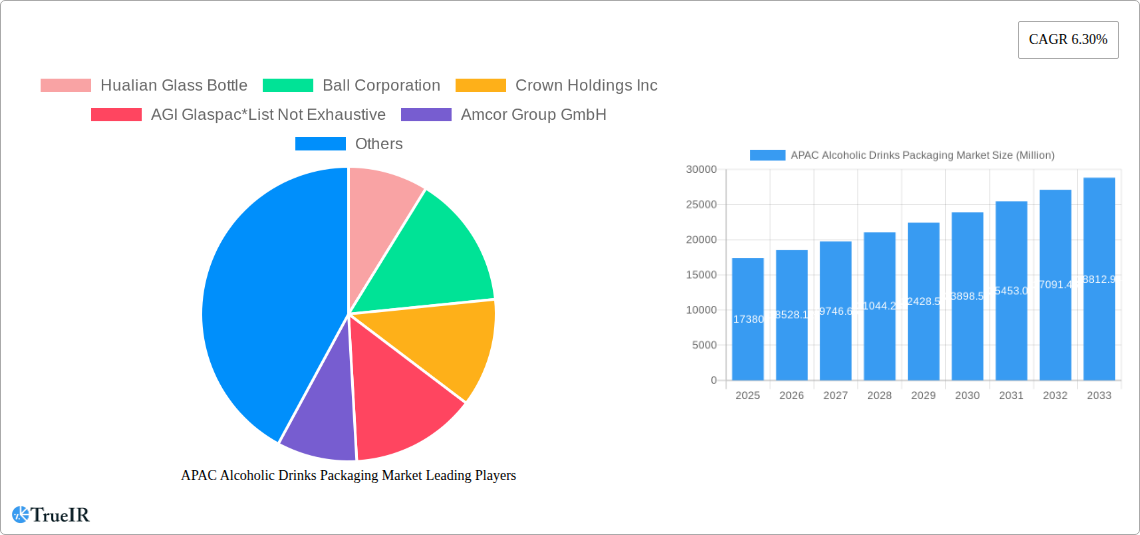
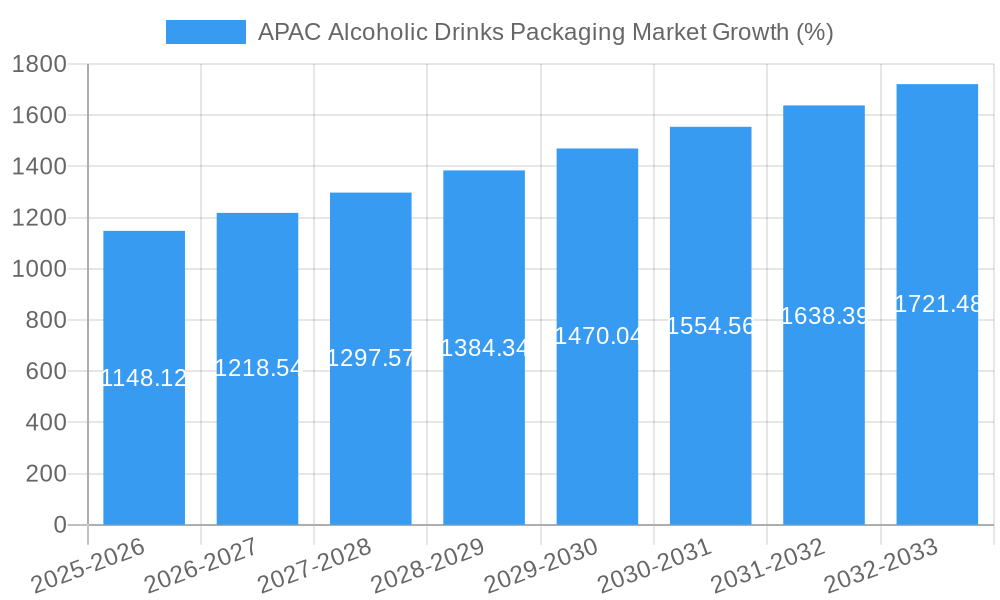
The Asia-Pacific (APAC) alcoholic drinks packaging market is experiencing robust growth, projected to reach a market size of $17.38 billion in 2025, expanding at a compound annual growth rate (CAGR) of 6.30% from 2025 to 2033. This expansion is driven by several key factors. Firstly, the rising disposable incomes and a burgeoning middle class across major APAC economies like China and India are fueling increased alcohol consumption, thereby boosting demand for packaging solutions. Secondly, evolving consumer preferences towards premiumization and convenience are driving demand for innovative packaging formats, such as lightweight, resealable pouches and sustainable alternatives like paper-based packaging. The growing popularity of craft beers and spirits, coupled with a rising trend towards e-commerce for alcohol sales, is also contributing significantly to market growth. Furthermore, increasing emphasis on brand differentiation and attractive packaging designs plays a pivotal role in consumer purchasing decisions, fostering competition and innovation within the market. However, fluctuating raw material prices, particularly for plastics and metals, pose a significant challenge. Stringent regulations concerning sustainable packaging and waste management are also influencing packaging choices, compelling manufacturers to adopt eco-friendly materials and designs.
Segment-wise analysis reveals that plastic packaging currently dominates due to its cost-effectiveness and versatility, followed by glass and paper-based options. The bottles segment holds the largest share within the product type category, driven by the widespread use of glass and plastic bottles for alcoholic beverages. However, the pouches and carton segments are witnessing rapid growth, propelled by their convenience and sustainability aspects. Geographically, China and India represent the largest markets within APAC, driven by their sizable populations and expanding alcoholic beverage industries. Other key markets include Japan, Singapore, Australia, and New Zealand, each exhibiting unique consumption patterns and packaging preferences. Leading players such as Hualian Glass Bottle, Ball Corporation, Crown Holdings Inc., and Amcor Group are actively shaping market dynamics through product innovation, strategic partnerships, and expansion into new markets, further intensifying competition and driving market growth.
APAC Alcoholic Drinks Packaging Market: A Comprehensive Report (2019-2033)
This dynamic report offers an in-depth analysis of the Asia-Pacific Alcoholic Drinks Packaging Market, providing crucial insights for businesses seeking to thrive in this rapidly evolving sector. Covering the period 2019-2033, with a base year of 2025 and a forecast period of 2025-2033, this research delves into market segmentation, competitive dynamics, growth drivers, and future trends. The report leverages extensive data analysis and expert insights to deliver actionable intelligence for strategic decision-making. The market size is projected to reach xx Million by 2033, exhibiting a compelling CAGR of xx%.
APAC Alcoholic Drinks Packaging Market Market Structure & Competitive Landscape
The APAC alcoholic drinks packaging market displays a moderately concentrated structure, with several major players commanding significant market share. Key players include Hualian Glass Bottle, Ball Corporation, Crown Holdings Inc, AGI Glaspac, Amcor Group GmbH, Mondi Group, and Gerresheimer AG. However, the market also accommodates numerous smaller regional players, leading to competitive dynamics influenced by both economies of scale and niche specializations.
The market's competitive landscape is shaped by several factors:
- Innovation: Continuous innovation in materials (lightweighting, sustainability) and packaging designs (e.g., tamper-evident closures, enhanced shelf life) drives competition.
- Regulatory Impacts: Stringent regulations concerning material recyclability, labeling, and alcohol content influence packaging choices and manufacturing processes. This also includes varying regulations across different APAC countries.
- Product Substitutes: The rise of eco-friendly alternatives like biodegradable materials presents both opportunities and challenges for traditional packaging types.
- End-User Segmentation: Market segmentation is crucial, targeting different alcoholic beverage types (beer, wine, spirits) with tailored packaging solutions, influencing the choice of material and product type.
- M&A Trends: Consolidation through mergers and acquisitions is a significant trend, driving market concentration and enhancing the capabilities of larger players. While precise M&A volume data for this specific sector in APAC is unavailable publicly, we estimate an average of xx M&A deals annually during the historical period (2019-2024). This is expected to increase slightly in the forecast period driven by the market's overall expansion. The Herfindahl-Hirschman Index (HHI) for the market is estimated at xx, suggesting a moderately concentrated market.
APAC Alcoholic Drinks Packaging Market Market Trends & Opportunities
The APAC alcoholic drinks packaging market is experiencing robust growth, driven by several key factors. The increasing demand for alcoholic beverages in the region, fueled by rising disposable incomes and changing lifestyles, particularly in emerging economies like India and China, significantly impacts market expansion. This translates to an estimated market size of xx Million in 2025, expected to reach xx Million by 2033.
Technological advancements are revolutionizing the industry. The adoption of lightweighting technologies reduces material costs and environmental impact. Smart packaging solutions, incorporating features like RFID tags for traceability and tamper-evidence, are gaining traction. Consumer preferences are shifting towards sustainable and eco-friendly options, pushing manufacturers to explore biodegradable and recyclable materials. Competitive dynamics remain intense, with companies focusing on innovation, cost optimization, and expanding their product portfolios to cater to diverse consumer needs. The market penetration rate of sustainable packaging is estimated to be xx% in 2025, projected to reach xx% by 2033.
Dominant Markets & Segments in APAC Alcoholic Drinks Packaging Market
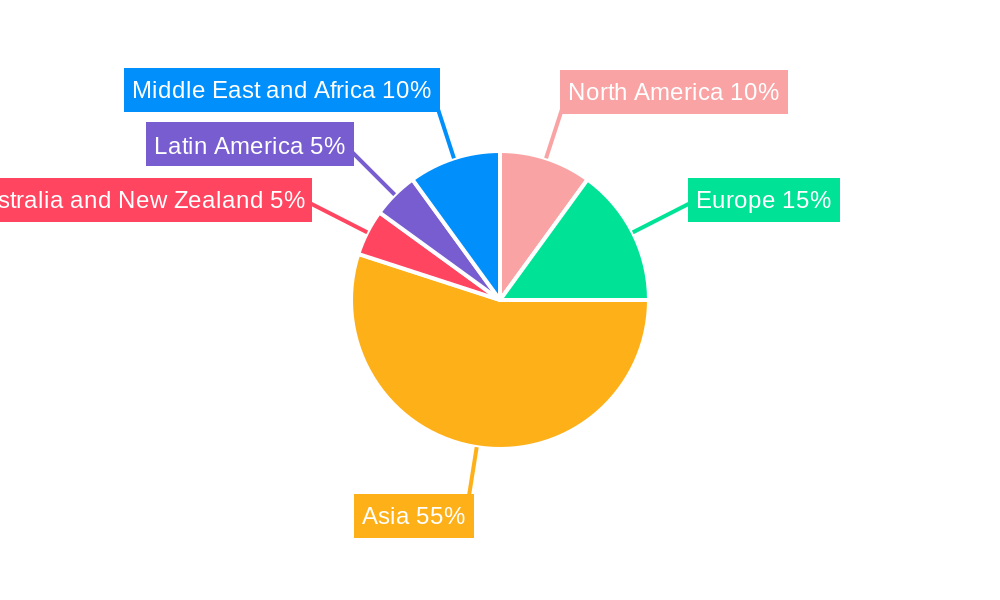
The APAC alcoholic drinks packaging market is geographically diverse, with significant variations in consumption patterns and regulatory landscapes across countries.
By Country:
- China: Remains the dominant market, driven by a large and expanding consumer base, coupled with rapid economic growth. Key growth drivers include robust infrastructure development, supportive government policies promoting domestic industries, and a growing preference for premium alcoholic beverages.
- India: Shows significant growth potential, fueled by a young and increasingly affluent population with rising disposable incomes. However, regulatory hurdles and regional variations in consumption patterns pose challenges.
- Japan: While a mature market, it demonstrates stable growth driven by the premiumization of alcoholic beverages and ongoing innovations in packaging technology.
- Singapore, Australia, and New Zealand: These markets, though smaller, exhibit higher per capita consumption and a strong preference for premium and innovative packaging solutions.
By Material:
- Glass: Maintains its dominance due to its perceived premium quality and suitability for premium spirits and wines.
- Plastic: Remains significant, particularly for cost-sensitive segments like beer and ready-to-drink beverages. However, environmental concerns are driving a shift towards more sustainable alternatives.
- Metal: Retains a considerable market share, especially for cans used in beer packaging, due to its strength, recyclability and suitability for high speed manufacturing.
- Paper: The fastest-growing segment, propelled by growing consumer preference for eco-friendly alternatives. Carton packaging is expanding rapidly, especially for premium wines and spirits.
By Product Type:
- Bottles: Remains the most widely used packaging type, particularly for spirits and wines.
- Cans: Dominates the beer segment due to its cost-effectiveness and convenient portability.
- Pouches: A niche but growing segment, suitable for convenient single-serve packaging.
- Cartons: Experiencing rapid growth due to their sustainability and versatility.
APAC Alcoholic Drinks Packaging Market Product Analysis
Product innovation in the APAC alcoholic drinks packaging market focuses on enhancing sustainability, convenience, and brand appeal. Lightweighting technologies, the use of recycled materials, and the incorporation of innovative closures are key trends. The market is seeing increased adoption of functional barriers and improved shelf-life solutions. These innovations offer cost savings, reduce environmental impact, and improve the overall consumer experience. The competitive advantage lies in offering a combination of sustainability, functionality, and aesthetic appeal tailored to specific beverage types and target markets.
Key Drivers, Barriers & Challenges in APAC Alcoholic Drinks Packaging Market
Key Drivers:
The APAC alcoholic drinks packaging market is driven by factors such as rising disposable incomes, changing lifestyles, urbanization, and the growing preference for premium alcoholic beverages. Technological advancements, like lightweighting and sustainable packaging solutions, are further propelling market growth. Favorable government policies in certain countries promoting domestic manufacturing are also contributing to growth.
Challenges:
Significant challenges include fluctuating raw material prices, particularly for plastic and paper, leading to cost volatility for manufacturers. Stricter environmental regulations, pushing for increased recyclability and reduced plastic use, demand significant investments in new technologies. Intense competition from both established and new entrants necessitates continuous innovation and cost optimization. Supply chain disruptions, particularly felt during the recent pandemic, add further complexity and uncertainty. These disruptions can cost an estimated xx Million annually in lost revenue.
Growth Drivers in the APAC Alcoholic Drinks Packaging Market Market
Continued economic growth in several APAC countries, particularly in emerging markets, fuels demand for alcoholic beverages, thus driving packaging demand. The shift towards premiumization and the increasing preference for convenient packaging formats contribute significantly. Government policies promoting sustainability and domestic manufacturing also play a vital role in stimulating market growth. Technological advancements, offering solutions like lightweighting, improved barrier properties, and enhanced convenience, further fuel market expansion.
Challenges Impacting APAC Alcoholic Drinks Packaging Market Growth
The market faces challenges from volatile raw material costs, impacting production expenses and potentially margins. Stricter environmental regulations necessitate investments in sustainable packaging solutions, representing a considerable capital outlay for many manufacturers. Intense competition among established players and new entrants necessitates continuous innovation and cost optimization to maintain market share. Supply chain disruptions, experienced in recent years, can lead to production delays and cost increases, negatively impacting overall market growth.
Key Players Shaping the APAC Alcoholic Drinks Packaging Market Market
- Hualian Glass Bottle
- Ball Corporation
- Crown Holdings Inc
- AGI Glaspac
- Amcor Group GmbH
- Mondi Group
- Gerresheimer AG
Significant APAC Alcoholic Drinks Packaging Market Industry Milestones
- 2021 (Q3): Amcor launched a new range of sustainable packaging solutions for alcoholic beverages, receiving positive industry reception.
- 2022 (Q1): Ball Corporation invested xx Million in a new manufacturing facility in China, expanding its production capacity.
- 2023 (Q2): A significant merger between two regional packaging companies in India resulted in a larger player consolidating market share.
Future Outlook for APAC Alcoholic Drinks Packaging Market Market
The APAC alcoholic drinks packaging market is poised for sustained growth, driven by several key catalysts. Continued economic expansion in emerging markets will fuel demand. The increasing preference for premium and convenient packaging will drive innovation. Growing focus on sustainability will accelerate the adoption of eco-friendly materials and designs. These factors present significant strategic opportunities for companies to capitalize on the market's substantial potential and future expansion. The continued focus on premiumization and sustainable solutions will ensure continued growth and opportunity for market players in the future.
APAC Alcoholic Drinks Packaging Market Segmentation
-
1. Material
- 1.1. Plastic
- 1.2. Paper
- 1.3. Metal
- 1.4. Glass
-
2. Product Type
- 2.1. Bottles
- 2.2. Cans
- 2.3. Pouches
- 2.4. Carton
APAC Alcoholic Drinks Packaging Market Segmentation By Geography
-
1. North America
- 1.1. United States
- 1.2. Canada
- 1.3. Mexico
-
2. South America
- 2.1. Brazil
- 2.2. Argentina
- 2.3. Rest of South America
-
3. Europe
- 3.1. United Kingdom
- 3.2. Germany
- 3.3. France
- 3.4. Italy
- 3.5. Spain
- 3.6. Russia
- 3.7. Benelux
- 3.8. Nordics
- 3.9. Rest of Europe
-
4. Middle East & Africa
- 4.1. Turkey
- 4.2. Israel
- 4.3. GCC
- 4.4. North Africa
- 4.5. South Africa
- 4.6. Rest of Middle East & Africa
-
5. Asia Pacific
- 5.1. China
- 5.2. India
- 5.3. Japan
- 5.4. South Korea
- 5.5. ASEAN
- 5.6. Oceania
- 5.7. Rest of Asia Pacific
APAC Alcoholic Drinks Packaging Market REPORT HIGHLIGHTS
| Aspects | Details |
|---|---|
| Study Period | 2019-2033 |
| Base Year | 2024 |
| Estimated Year | 2025 |
| Forecast Period | 2025-2033 |
| Historical Period | 2019-2024 |
| Growth Rate | CAGR of 6.30% from 2019-2033 |
| Segmentation |
|
Table of Contents
- 1. Introduction
- 1.1. Research Scope
- 1.2. Market Segmentation
- 1.3. Research Methodology
- 1.4. Definitions and Assumptions
- 2. Executive Summary
- 2.1. Introduction
- 3. Market Dynamics
- 3.1. Introduction
- 3.2. Market Drivers
- 3.2.1. Increasing Demand for Sustainable Packaging; Increasing Consumption of Alcoholic Drinks in Asia
- 3.3. Market Restrains
- 3.3.1. Government Regulation for Plastic Usage
- 3.4. Market Trends
- 3.4.1. Significant Growth in Metal Packaging to Boost the Market
- 4. Market Factor Analysis
- 4.1. Porters Five Forces
- 4.2. Supply/Value Chain
- 4.3. PESTEL analysis
- 4.4. Market Entropy
- 4.5. Patent/Trademark Analysis
- 5. Global APAC Alcoholic Drinks Packaging Market Analysis, Insights and Forecast, 2019-2031
- 5.1. Market Analysis, Insights and Forecast - by Material
- 5.1.1. Plastic
- 5.1.2. Paper
- 5.1.3. Metal
- 5.1.4. Glass
- 5.2. Market Analysis, Insights and Forecast - by Product Type
- 5.2.1. Bottles
- 5.2.2. Cans
- 5.2.3. Pouches
- 5.2.4. Carton
- 5.3. Market Analysis, Insights and Forecast - by Region
- 5.3.1. North America
- 5.3.2. South America
- 5.3.3. Europe
- 5.3.4. Middle East & Africa
- 5.3.5. Asia Pacific
- 5.1. Market Analysis, Insights and Forecast - by Material
- 6. North America APAC Alcoholic Drinks Packaging Market Analysis, Insights and Forecast, 2019-2031
- 6.1. Market Analysis, Insights and Forecast - by Material
- 6.1.1. Plastic
- 6.1.2. Paper
- 6.1.3. Metal
- 6.1.4. Glass
- 6.2. Market Analysis, Insights and Forecast - by Product Type
- 6.2.1. Bottles
- 6.2.2. Cans
- 6.2.3. Pouches
- 6.2.4. Carton
- 6.1. Market Analysis, Insights and Forecast - by Material
- 7. South America APAC Alcoholic Drinks Packaging Market Analysis, Insights and Forecast, 2019-2031
- 7.1. Market Analysis, Insights and Forecast - by Material
- 7.1.1. Plastic
- 7.1.2. Paper
- 7.1.3. Metal
- 7.1.4. Glass
- 7.2. Market Analysis, Insights and Forecast - by Product Type
- 7.2.1. Bottles
- 7.2.2. Cans
- 7.2.3. Pouches
- 7.2.4. Carton
- 7.1. Market Analysis, Insights and Forecast - by Material
- 8. Europe APAC Alcoholic Drinks Packaging Market Analysis, Insights and Forecast, 2019-2031
- 8.1. Market Analysis, Insights and Forecast - by Material
- 8.1.1. Plastic
- 8.1.2. Paper
- 8.1.3. Metal
- 8.1.4. Glass
- 8.2. Market Analysis, Insights and Forecast - by Product Type
- 8.2.1. Bottles
- 8.2.2. Cans
- 8.2.3. Pouches
- 8.2.4. Carton
- 8.1. Market Analysis, Insights and Forecast - by Material
- 9. Middle East & Africa APAC Alcoholic Drinks Packaging Market Analysis, Insights and Forecast, 2019-2031
- 9.1. Market Analysis, Insights and Forecast - by Material
- 9.1.1. Plastic
- 9.1.2. Paper
- 9.1.3. Metal
- 9.1.4. Glass
- 9.2. Market Analysis, Insights and Forecast - by Product Type
- 9.2.1. Bottles
- 9.2.2. Cans
- 9.2.3. Pouches
- 9.2.4. Carton
- 9.1. Market Analysis, Insights and Forecast - by Material
- 10. Asia Pacific APAC Alcoholic Drinks Packaging Market Analysis, Insights and Forecast, 2019-2031
- 10.1. Market Analysis, Insights and Forecast - by Material
- 10.1.1. Plastic
- 10.1.2. Paper
- 10.1.3. Metal
- 10.1.4. Glass
- 10.2. Market Analysis, Insights and Forecast - by Product Type
- 10.2.1. Bottles
- 10.2.2. Cans
- 10.2.3. Pouches
- 10.2.4. Carton
- 10.1. Market Analysis, Insights and Forecast - by Material
- 11. North America APAC Alcoholic Drinks Packaging Market Analysis, Insights and Forecast, 2019-2031
- 11.1. Market Analysis, Insights and Forecast - By Country/Sub-region
- 11.1.1.
- 12. Europe APAC Alcoholic Drinks Packaging Market Analysis, Insights and Forecast, 2019-2031
- 12.1. Market Analysis, Insights and Forecast - By Country/Sub-region
- 12.1.1.
- 13. Asia APAC Alcoholic Drinks Packaging Market Analysis, Insights and Forecast, 2019-2031
- 13.1. Market Analysis, Insights and Forecast - By Country/Sub-region
- 13.1.1.
- 14. Australia and New Zealand APAC Alcoholic Drinks Packaging Market Analysis, Insights and Forecast, 2019-2031
- 14.1. Market Analysis, Insights and Forecast - By Country/Sub-region
- 14.1.1.
- 15. Latin America APAC Alcoholic Drinks Packaging Market Analysis, Insights and Forecast, 2019-2031
- 15.1. Market Analysis, Insights and Forecast - By Country/Sub-region
- 15.1.1.
- 16. Middle East and Africa APAC Alcoholic Drinks Packaging Market Analysis, Insights and Forecast, 2019-2031
- 16.1. Market Analysis, Insights and Forecast - By Country/Sub-region
- 16.1.1.
- 17. Competitive Analysis
- 17.1. Global Market Share Analysis 2024
- 17.2. Company Profiles
- 17.2.1 Hualian Glass Bottle
- 17.2.1.1. Overview
- 17.2.1.2. Products
- 17.2.1.3. SWOT Analysis
- 17.2.1.4. Recent Developments
- 17.2.1.5. Financials (Based on Availability)
- 17.2.2 Ball Corporation
- 17.2.2.1. Overview
- 17.2.2.2. Products
- 17.2.2.3. SWOT Analysis
- 17.2.2.4. Recent Developments
- 17.2.2.5. Financials (Based on Availability)
- 17.2.3 Crown Holdings Inc
- 17.2.3.1. Overview
- 17.2.3.2. Products
- 17.2.3.3. SWOT Analysis
- 17.2.3.4. Recent Developments
- 17.2.3.5. Financials (Based on Availability)
- 17.2.4 AGI Glaspac*List Not Exhaustive
- 17.2.4.1. Overview
- 17.2.4.2. Products
- 17.2.4.3. SWOT Analysis
- 17.2.4.4. Recent Developments
- 17.2.4.5. Financials (Based on Availability)
- 17.2.5 Amcor Group GmbH
- 17.2.5.1. Overview
- 17.2.5.2. Products
- 17.2.5.3. SWOT Analysis
- 17.2.5.4. Recent Developments
- 17.2.5.5. Financials (Based on Availability)
- 17.2.6 Mondi Group
- 17.2.6.1. Overview
- 17.2.6.2. Products
- 17.2.6.3. SWOT Analysis
- 17.2.6.4. Recent Developments
- 17.2.6.5. Financials (Based on Availability)
- 17.2.7 Gerresheimer AG
- 17.2.7.1. Overview
- 17.2.7.2. Products
- 17.2.7.3. SWOT Analysis
- 17.2.7.4. Recent Developments
- 17.2.7.5. Financials (Based on Availability)
- 17.2.1 Hualian Glass Bottle
List of Figures
- Figure 1: Global APAC Alcoholic Drinks Packaging Market Revenue Breakdown (Million, %) by Region 2024 & 2032
- Figure 2: North America APAC Alcoholic Drinks Packaging Market Revenue (Million), by Country 2024 & 2032
- Figure 3: North America APAC Alcoholic Drinks Packaging Market Revenue Share (%), by Country 2024 & 2032
- Figure 4: Europe APAC Alcoholic Drinks Packaging Market Revenue (Million), by Country 2024 & 2032
- Figure 5: Europe APAC Alcoholic Drinks Packaging Market Revenue Share (%), by Country 2024 & 2032
- Figure 6: Asia APAC Alcoholic Drinks Packaging Market Revenue (Million), by Country 2024 & 2032
- Figure 7: Asia APAC Alcoholic Drinks Packaging Market Revenue Share (%), by Country 2024 & 2032
- Figure 8: Australia and New Zealand APAC Alcoholic Drinks Packaging Market Revenue (Million), by Country 2024 & 2032
- Figure 9: Australia and New Zealand APAC Alcoholic Drinks Packaging Market Revenue Share (%), by Country 2024 & 2032
- Figure 10: Latin America APAC Alcoholic Drinks Packaging Market Revenue (Million), by Country 2024 & 2032
- Figure 11: Latin America APAC Alcoholic Drinks Packaging Market Revenue Share (%), by Country 2024 & 2032
- Figure 12: Middle East and Africa APAC Alcoholic Drinks Packaging Market Revenue (Million), by Country 2024 & 2032
- Figure 13: Middle East and Africa APAC Alcoholic Drinks Packaging Market Revenue Share (%), by Country 2024 & 2032
- Figure 14: North America APAC Alcoholic Drinks Packaging Market Revenue (Million), by Material 2024 & 2032
- Figure 15: North America APAC Alcoholic Drinks Packaging Market Revenue Share (%), by Material 2024 & 2032
- Figure 16: North America APAC Alcoholic Drinks Packaging Market Revenue (Million), by Product Type 2024 & 2032
- Figure 17: North America APAC Alcoholic Drinks Packaging Market Revenue Share (%), by Product Type 2024 & 2032
- Figure 18: North America APAC Alcoholic Drinks Packaging Market Revenue (Million), by Country 2024 & 2032
- Figure 19: North America APAC Alcoholic Drinks Packaging Market Revenue Share (%), by Country 2024 & 2032
- Figure 20: South America APAC Alcoholic Drinks Packaging Market Revenue (Million), by Material 2024 & 2032
- Figure 21: South America APAC Alcoholic Drinks Packaging Market Revenue Share (%), by Material 2024 & 2032
- Figure 22: South America APAC Alcoholic Drinks Packaging Market Revenue (Million), by Product Type 2024 & 2032
- Figure 23: South America APAC Alcoholic Drinks Packaging Market Revenue Share (%), by Product Type 2024 & 2032
- Figure 24: South America APAC Alcoholic Drinks Packaging Market Revenue (Million), by Country 2024 & 2032
- Figure 25: South America APAC Alcoholic Drinks Packaging Market Revenue Share (%), by Country 2024 & 2032
- Figure 26: Europe APAC Alcoholic Drinks Packaging Market Revenue (Million), by Material 2024 & 2032
- Figure 27: Europe APAC Alcoholic Drinks Packaging Market Revenue Share (%), by Material 2024 & 2032
- Figure 28: Europe APAC Alcoholic Drinks Packaging Market Revenue (Million), by Product Type 2024 & 2032
- Figure 29: Europe APAC Alcoholic Drinks Packaging Market Revenue Share (%), by Product Type 2024 & 2032
- Figure 30: Europe APAC Alcoholic Drinks Packaging Market Revenue (Million), by Country 2024 & 2032
- Figure 31: Europe APAC Alcoholic Drinks Packaging Market Revenue Share (%), by Country 2024 & 2032
- Figure 32: Middle East & Africa APAC Alcoholic Drinks Packaging Market Revenue (Million), by Material 2024 & 2032
- Figure 33: Middle East & Africa APAC Alcoholic Drinks Packaging Market Revenue Share (%), by Material 2024 & 2032
- Figure 34: Middle East & Africa APAC Alcoholic Drinks Packaging Market Revenue (Million), by Product Type 2024 & 2032
- Figure 35: Middle East & Africa APAC Alcoholic Drinks Packaging Market Revenue Share (%), by Product Type 2024 & 2032
- Figure 36: Middle East & Africa APAC Alcoholic Drinks Packaging Market Revenue (Million), by Country 2024 & 2032
- Figure 37: Middle East & Africa APAC Alcoholic Drinks Packaging Market Revenue Share (%), by Country 2024 & 2032
- Figure 38: Asia Pacific APAC Alcoholic Drinks Packaging Market Revenue (Million), by Material 2024 & 2032
- Figure 39: Asia Pacific APAC Alcoholic Drinks Packaging Market Revenue Share (%), by Material 2024 & 2032
- Figure 40: Asia Pacific APAC Alcoholic Drinks Packaging Market Revenue (Million), by Product Type 2024 & 2032
- Figure 41: Asia Pacific APAC Alcoholic Drinks Packaging Market Revenue Share (%), by Product Type 2024 & 2032
- Figure 42: Asia Pacific APAC Alcoholic Drinks Packaging Market Revenue (Million), by Country 2024 & 2032
- Figure 43: Asia Pacific APAC Alcoholic Drinks Packaging Market Revenue Share (%), by Country 2024 & 2032
List of Tables
- Table 1: Global APAC Alcoholic Drinks Packaging Market Revenue Million Forecast, by Region 2019 & 2032
- Table 2: Global APAC Alcoholic Drinks Packaging Market Revenue Million Forecast, by Material 2019 & 2032
- Table 3: Global APAC Alcoholic Drinks Packaging Market Revenue Million Forecast, by Product Type 2019 & 2032
- Table 4: Global APAC Alcoholic Drinks Packaging Market Revenue Million Forecast, by Region 2019 & 2032
- Table 5: Global APAC Alcoholic Drinks Packaging Market Revenue Million Forecast, by Country 2019 & 2032
- Table 6: APAC Alcoholic Drinks Packaging Market Revenue (Million) Forecast, by Application 2019 & 2032
- Table 7: Global APAC Alcoholic Drinks Packaging Market Revenue Million Forecast, by Country 2019 & 2032
- Table 8: APAC Alcoholic Drinks Packaging Market Revenue (Million) Forecast, by Application 2019 & 2032
- Table 9: Global APAC Alcoholic Drinks Packaging Market Revenue Million Forecast, by Country 2019 & 2032
- Table 10: APAC Alcoholic Drinks Packaging Market Revenue (Million) Forecast, by Application 2019 & 2032
- Table 11: Global APAC Alcoholic Drinks Packaging Market Revenue Million Forecast, by Country 2019 & 2032
- Table 12: APAC Alcoholic Drinks Packaging Market Revenue (Million) Forecast, by Application 2019 & 2032
- Table 13: Global APAC Alcoholic Drinks Packaging Market Revenue Million Forecast, by Country 2019 & 2032
- Table 14: APAC Alcoholic Drinks Packaging Market Revenue (Million) Forecast, by Application 2019 & 2032
- Table 15: Global APAC Alcoholic Drinks Packaging Market Revenue Million Forecast, by Country 2019 & 2032
- Table 16: APAC Alcoholic Drinks Packaging Market Revenue (Million) Forecast, by Application 2019 & 2032
- Table 17: Global APAC Alcoholic Drinks Packaging Market Revenue Million Forecast, by Material 2019 & 2032
- Table 18: Global APAC Alcoholic Drinks Packaging Market Revenue Million Forecast, by Product Type 2019 & 2032
- Table 19: Global APAC Alcoholic Drinks Packaging Market Revenue Million Forecast, by Country 2019 & 2032
- Table 20: United States APAC Alcoholic Drinks Packaging Market Revenue (Million) Forecast, by Application 2019 & 2032
- Table 21: Canada APAC Alcoholic Drinks Packaging Market Revenue (Million) Forecast, by Application 2019 & 2032
- Table 22: Mexico APAC Alcoholic Drinks Packaging Market Revenue (Million) Forecast, by Application 2019 & 2032
- Table 23: Global APAC Alcoholic Drinks Packaging Market Revenue Million Forecast, by Material 2019 & 2032
- Table 24: Global APAC Alcoholic Drinks Packaging Market Revenue Million Forecast, by Product Type 2019 & 2032
- Table 25: Global APAC Alcoholic Drinks Packaging Market Revenue Million Forecast, by Country 2019 & 2032
- Table 26: Brazil APAC Alcoholic Drinks Packaging Market Revenue (Million) Forecast, by Application 2019 & 2032
- Table 27: Argentina APAC Alcoholic Drinks Packaging Market Revenue (Million) Forecast, by Application 2019 & 2032
- Table 28: Rest of South America APAC Alcoholic Drinks Packaging Market Revenue (Million) Forecast, by Application 2019 & 2032
- Table 29: Global APAC Alcoholic Drinks Packaging Market Revenue Million Forecast, by Material 2019 & 2032
- Table 30: Global APAC Alcoholic Drinks Packaging Market Revenue Million Forecast, by Product Type 2019 & 2032
- Table 31: Global APAC Alcoholic Drinks Packaging Market Revenue Million Forecast, by Country 2019 & 2032
- Table 32: United Kingdom APAC Alcoholic Drinks Packaging Market Revenue (Million) Forecast, by Application 2019 & 2032
- Table 33: Germany APAC Alcoholic Drinks Packaging Market Revenue (Million) Forecast, by Application 2019 & 2032
- Table 34: France APAC Alcoholic Drinks Packaging Market Revenue (Million) Forecast, by Application 2019 & 2032
- Table 35: Italy APAC Alcoholic Drinks Packaging Market Revenue (Million) Forecast, by Application 2019 & 2032
- Table 36: Spain APAC Alcoholic Drinks Packaging Market Revenue (Million) Forecast, by Application 2019 & 2032
- Table 37: Russia APAC Alcoholic Drinks Packaging Market Revenue (Million) Forecast, by Application 2019 & 2032
- Table 38: Benelux APAC Alcoholic Drinks Packaging Market Revenue (Million) Forecast, by Application 2019 & 2032
- Table 39: Nordics APAC Alcoholic Drinks Packaging Market Revenue (Million) Forecast, by Application 2019 & 2032
- Table 40: Rest of Europe APAC Alcoholic Drinks Packaging Market Revenue (Million) Forecast, by Application 2019 & 2032
- Table 41: Global APAC Alcoholic Drinks Packaging Market Revenue Million Forecast, by Material 2019 & 2032
- Table 42: Global APAC Alcoholic Drinks Packaging Market Revenue Million Forecast, by Product Type 2019 & 2032
- Table 43: Global APAC Alcoholic Drinks Packaging Market Revenue Million Forecast, by Country 2019 & 2032
- Table 44: Turkey APAC Alcoholic Drinks Packaging Market Revenue (Million) Forecast, by Application 2019 & 2032
- Table 45: Israel APAC Alcoholic Drinks Packaging Market Revenue (Million) Forecast, by Application 2019 & 2032
- Table 46: GCC APAC Alcoholic Drinks Packaging Market Revenue (Million) Forecast, by Application 2019 & 2032
- Table 47: North Africa APAC Alcoholic Drinks Packaging Market Revenue (Million) Forecast, by Application 2019 & 2032
- Table 48: South Africa APAC Alcoholic Drinks Packaging Market Revenue (Million) Forecast, by Application 2019 & 2032
- Table 49: Rest of Middle East & Africa APAC Alcoholic Drinks Packaging Market Revenue (Million) Forecast, by Application 2019 & 2032
- Table 50: Global APAC Alcoholic Drinks Packaging Market Revenue Million Forecast, by Material 2019 & 2032
- Table 51: Global APAC Alcoholic Drinks Packaging Market Revenue Million Forecast, by Product Type 2019 & 2032
- Table 52: Global APAC Alcoholic Drinks Packaging Market Revenue Million Forecast, by Country 2019 & 2032
- Table 53: China APAC Alcoholic Drinks Packaging Market Revenue (Million) Forecast, by Application 2019 & 2032
- Table 54: India APAC Alcoholic Drinks Packaging Market Revenue (Million) Forecast, by Application 2019 & 2032
- Table 55: Japan APAC Alcoholic Drinks Packaging Market Revenue (Million) Forecast, by Application 2019 & 2032
- Table 56: South Korea APAC Alcoholic Drinks Packaging Market Revenue (Million) Forecast, by Application 2019 & 2032
- Table 57: ASEAN APAC Alcoholic Drinks Packaging Market Revenue (Million) Forecast, by Application 2019 & 2032
- Table 58: Oceania APAC Alcoholic Drinks Packaging Market Revenue (Million) Forecast, by Application 2019 & 2032
- Table 59: Rest of Asia Pacific APAC Alcoholic Drinks Packaging Market Revenue (Million) Forecast, by Application 2019 & 2032
Frequently Asked Questions
1. What is the projected Compound Annual Growth Rate (CAGR) of the APAC Alcoholic Drinks Packaging Market?
The projected CAGR is approximately 6.30%.
2. Which companies are prominent players in the APAC Alcoholic Drinks Packaging Market?
Key companies in the market include Hualian Glass Bottle, Ball Corporation, Crown Holdings Inc, AGI Glaspac*List Not Exhaustive, Amcor Group GmbH, Mondi Group, Gerresheimer AG.
3. What are the main segments of the APAC Alcoholic Drinks Packaging Market?
The market segments include Material, Product Type.
4. Can you provide details about the market size?
The market size is estimated to be USD 17.38 Million as of 2022.
5. What are some drivers contributing to market growth?
Increasing Demand for Sustainable Packaging; Increasing Consumption of Alcoholic Drinks in Asia.
6. What are the notable trends driving market growth?
Significant Growth in Metal Packaging to Boost the Market.
7. Are there any restraints impacting market growth?
Government Regulation for Plastic Usage.
8. Can you provide examples of recent developments in the market?
N/A
9. What pricing options are available for accessing the report?
Pricing options include single-user, multi-user, and enterprise licenses priced at USD 4750, USD 4950, and USD 6800 respectively.
10. Is the market size provided in terms of value or volume?
The market size is provided in terms of value, measured in Million.
11. Are there any specific market keywords associated with the report?
Yes, the market keyword associated with the report is "APAC Alcoholic Drinks Packaging Market," which aids in identifying and referencing the specific market segment covered.
12. How do I determine which pricing option suits my needs best?
The pricing options vary based on user requirements and access needs. Individual users may opt for single-user licenses, while businesses requiring broader access may choose multi-user or enterprise licenses for cost-effective access to the report.
13. Are there any additional resources or data provided in the APAC Alcoholic Drinks Packaging Market report?
While the report offers comprehensive insights, it's advisable to review the specific contents or supplementary materials provided to ascertain if additional resources or data are available.
14. How can I stay updated on further developments or reports in the APAC Alcoholic Drinks Packaging Market?
To stay informed about further developments, trends, and reports in the APAC Alcoholic Drinks Packaging Market, consider subscribing to industry newsletters, following relevant companies and organizations, or regularly checking reputable industry news sources and publications.
Methodology
Step 1 - Identification of Relevant Samples Size from Population Database


Step 2 - Approaches for Defining Global Market Size (Value, Volume* & Price*)

Note*: In applicable scenarios
Step 3 - Data Sources
Primary Research
- Web Analytics
- Survey Reports
- Research Institute
- Latest Research Reports
- Opinion Leaders
Secondary Research
- Annual Reports
- White Paper
- Latest Press Release
- Industry Association
- Paid Database
- Investor Presentations

Step 4 - Data Triangulation
Involves using different sources of information in order to increase the validity of a study
These sources are likely to be stakeholders in a program - participants, other researchers, program staff, other community members, and so on.
Then we put all data in single framework & apply various statistical tools to find out the dynamic on the market.
During the analysis stage, feedback from the stakeholder groups would be compared to determine areas of agreement as well as areas of divergence
