

Key Insights
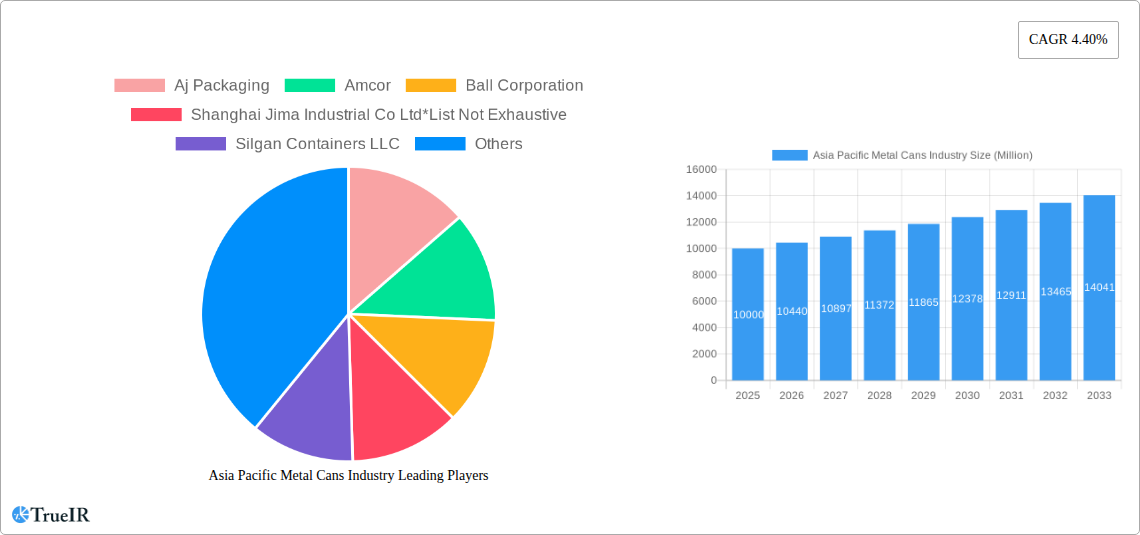
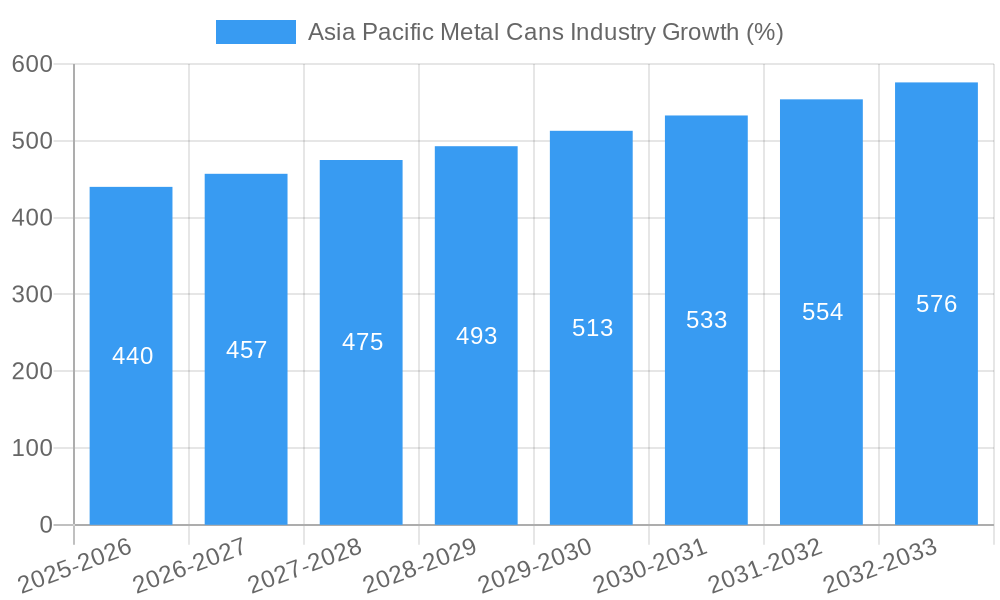
The Asia Pacific metal cans industry, currently experiencing robust growth, is projected to maintain a Compound Annual Growth Rate (CAGR) of 4.40% from 2025 to 2033. This expansion is fueled by several key factors. The rising demand for convenient and shelf-stable food and beverage products across the region, particularly in rapidly developing economies like India and China, significantly drives market growth. Increasing urbanization and changing consumer lifestyles are contributing to higher consumption of packaged goods, further boosting the demand for metal cans. Aluminum and steel, the primary materials used in can manufacturing, maintain a healthy balance in market share, influenced by price fluctuations and sustainability concerns. While steel offers cost advantages, aluminum's lightweight nature and recyclability are driving its adoption, particularly within the beverage sector. The segmentation within the industry reveals strong performance across various can types, including food cans, beverage cans (both alcoholic and non-alcoholic), and aerosol cans. Growth is expected to be particularly strong in the food and beverage segments, driven by increasing demand for processed foods and ready-to-drink beverages. Competition amongst major players like Amcor, Ball Corporation, and Crown Holdings is intense, promoting innovation and efficiency within the industry. However, challenges remain, including fluctuating raw material prices and environmental concerns related to manufacturing and disposal. Strategic initiatives focused on sustainability and circular economy principles are becoming crucial for companies seeking long-term success.
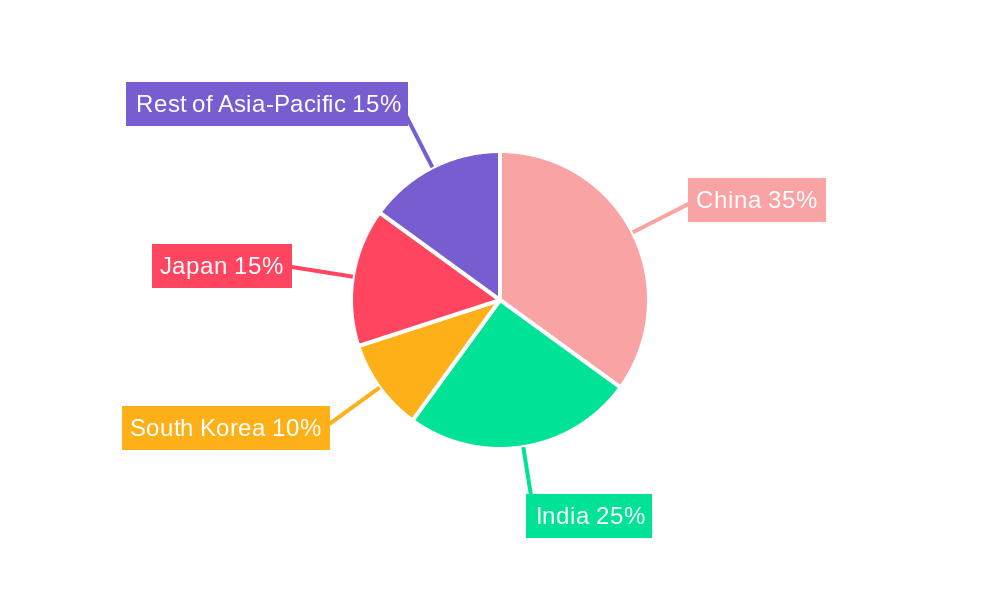
The forecast period (2025-2033) anticipates continued expansion, with notable growth anticipated in South Korea, India, and China, reflecting these nations' burgeoning economies and escalating consumer spending. While the "Rest of Asia-Pacific" segment also contributes meaningfully to overall market volume, the aforementioned countries will likely dominate in terms of growth percentage. The industry's success hinges on balancing cost-effectiveness with sustainability initiatives, fostering innovation in can design and manufacturing to meet evolving consumer preferences. This includes exploring lightweighting technologies and improved recycling infrastructure to mitigate environmental impact and maintain a competitive edge. The focus on expanding into newer markets within the Asia-Pacific region while retaining a stronghold on existing ones is essential for sustaining the projected growth trajectory.
Asia Pacific Metal Cans Industry Market Report: 2019-2033
This comprehensive report provides a detailed analysis of the Asia Pacific metal cans industry, covering market size, growth drivers, competitive landscape, and future outlook. The study period spans from 2019 to 2033, with a base year of 2025 and a forecast period from 2025 to 2033. The report leverages extensive research and data analysis to offer valuable insights for industry stakeholders, including manufacturers, suppliers, distributors, and investors. Key regions covered include India, China, and South Korea. Major players analyzed include Aj Packaging, Amcor, Ball Corporation, Shanghai Jima Industrial Co Ltd, Silgan Containers LLC, Crown Holdings, EBI Packaging, and BWAY. The report segments the market by can type (food, beverage, aerosol, other), material type (aluminum, steel), and end-user industry.
Asia Pacific Metal Cans Industry Market Structure & Competitive Landscape
The Asia Pacific metal cans industry exhibits a moderately concentrated market structure, with a few major players holding significant market share. However, the presence of numerous smaller regional players ensures a dynamic competitive landscape. Concentration ratios (e.g., CR4, CR8) will be calculated and presented within the full report. Innovation is a key driver, with companies investing in advanced manufacturing technologies to enhance efficiency and reduce production costs. Regulatory changes concerning material sourcing and environmental regulations significantly impact market dynamics. Aluminum and steel remain the dominant materials, although bio-based alternatives are emerging. Product substitution is limited due to the unique properties of metal cans for preserving food and beverage products. The industry witnesses frequent mergers and acquisitions (M&A) activity, particularly among smaller companies seeking to expand their market reach and product portfolios. The report will quantitatively assess M&A volumes over the historical period. Qualitative insights will highlight the impact of these activities on market consolidation and innovation.
- Market Concentration: Analysis of CR4 and CR8 to quantify market concentration.
- Innovation Drivers: Discussion of technological advancements in can manufacturing.
- Regulatory Impacts: Examination of relevant environmental and safety regulations.
- Product Substitutes: Assessment of alternative packaging solutions and their market penetration.
- End-User Segmentation: Detailed analysis of market share across various end-user industries.
- M&A Trends: Quantitative assessment of M&A activity and qualitative analysis of its impact.
Asia Pacific Metal Cans Industry Market Trends & Opportunities
The Asia Pacific metal cans market is experiencing robust growth, driven by factors such as increasing consumer demand for packaged food and beverages, particularly in rapidly developing economies. The report estimates a compound annual growth rate (CAGR) of xx% during the forecast period (2025-2033), with xx Million in estimated market value in 2025 and xx Million in projected market value by 2033. Technological advancements, such as lightweighting and improved printing techniques, are enhancing product appeal and efficiency. Consumer preferences towards convenient and sustainable packaging options are creating opportunities for innovative can designs and materials. However, fluctuating raw material prices and intense competition pose significant challenges. Market penetration rates will be detailed for key segments across different countries. The evolving regulatory landscape, especially concerning sustainability, presents both challenges and opportunities for industry players. The report will conduct a detailed SWOT analysis for the market, considering opportunities and threats based on market segmentation.
Dominant Markets & Segments in Asia Pacific Metal Cans Industry
China dominates the Asia Pacific metal cans market, followed by India and South Korea. This dominance stems from large populations, rapidly growing economies, and expanding food and beverage sectors.
Key Growth Drivers:
- China: Rapid urbanization, rising disposable incomes, and a burgeoning food and beverage industry.
- India: Expanding middle class, increased consumer spending, and a growing preference for packaged food.
- South Korea: High per capita consumption of packaged goods and a strong emphasis on food safety.
- Food Cans: The food segment dominates the market due to the demand for shelf-stable and convenient food products.
- Beverage Cans: Strong growth driven by the popularity of carbonated soft drinks, alcoholic beverages, and ready-to-drink teas.
- Aluminum: Aluminum cans offer lightweighting advantages, leading to cost savings in transportation and improved recyclability.
Steel remains a significant material due to its cost-effectiveness and durability. The report delves into a detailed regional and segmental analysis to illustrate market share and future growth potential.
Asia Pacific Metal Cans Industry Product Analysis
The Asia Pacific metal cans industry is witnessing significant product innovation, driven by advancements in material science, printing technology, and can manufacturing processes. Lightweighting techniques are enhancing efficiency and reducing material costs. Innovative can designs cater to diverse consumer preferences and improve product shelf life. Competition is fierce, with companies differentiating themselves through product features, packaging aesthetics, and sustainable practices. The report analyses the competitive advantages of different product offerings.
Key Drivers, Barriers & Challenges in Asia Pacific Metal Cans Industry
Key Drivers:
- Rising disposable incomes and urbanization in emerging economies are fueling demand for packaged goods.
- Technological advancements are improving can manufacturing efficiency and reducing costs.
- Growing preference for convenience and shelf-stable products drives market growth.
Challenges:
- Fluctuating raw material prices (aluminum and steel) impact profitability.
- Stringent environmental regulations necessitate sustainable packaging solutions.
- Intense competition requires continuous innovation and cost optimization. The report will quantify the impact of these challenges on market growth using relevant data and projections.
Growth Drivers in the Asia Pacific Metal Cans Industry Market
The Asia Pacific metal cans market is fueled by rising disposable incomes in rapidly developing economies and increased demand for convenient packaged food and beverages. Technological innovations, including lightweighting and enhanced printing techniques, are boosting product appeal and efficiency. Favorable government policies promoting domestic manufacturing and sustainable practices also contribute to market growth.
Challenges Impacting Asia Pacific Metal Cans Industry Growth
The industry faces challenges such as fluctuating raw material prices, especially aluminum and steel, impacting production costs. Stringent environmental regulations require manufacturers to adopt sustainable packaging solutions, adding to operational costs. Intense competition necessitates continuous innovation and cost optimization to maintain market share. Supply chain disruptions can also significantly impact production and delivery timelines.
Key Players Shaping the Asia Pacific Metal Cans Industry Market
- Aj Packaging
- Amcor
- Ball Corporation
- Shanghai Jima Industrial Co Ltd
- Silgan Containers LLC
- Crown Holdings
- EBI Packaging
- BWAY
Significant Asia Pacific Metal Cans Industry Industry Milestones
- February 2021: The central can testing laboratory of China's Sunrise Group (formerly Shengxing Group) in Anhui received official accreditation from PepsiCo, becoming the first company in China to achieve this status. This milestone signifies a push towards higher quality standards and increased investment in R&D within the industry.
Future Outlook for Asia Pacific Metal Cans Industry Market
The Asia Pacific metal cans industry is poised for sustained growth, driven by several factors including increasing disposable incomes, urbanization, and a growing preference for convenient, packaged food and beverages. Further technological advancements, especially in sustainable and lightweight materials, will provide new opportunities for market expansion. The industry’s response to environmental concerns and evolving consumer preferences will play a crucial role in shaping its future trajectory. The market is expected to witness significant innovation in can design and manufacturing, leading to enhanced product quality and sustainability.
Asia Pacific Metal Cans Industry Segmentation
-
1. Material Type
- 1.1. Aluminum
- 1.2. Steel
-
2. Can Types
-
2.1. Food
- 2.1.1. Vegetables
- 2.1.2. Fruits
- 2.1.3. Pet Food
- 2.1.4. Soups
- 2.1.5. Coffee
- 2.1.6. Other Types of Food Cans
-
2.2. Beverage
- 2.2.1. Alcoholic Beverages
- 2.2.2. Non-alcoholic Beverages
-
2.3. Aerosol
- 2.3.1. Cosmetic and Personal Care
- 2.3.2. Household
- 2.3.3. Pharmaceutical/Veterinary
- 2.3.4. Paints and Varnishes
- 2.3.5. Automotive/Industrial
- 2.3.6. Other End-user Industries
- 2.4. Other Can Types
-
2.1. Food
Asia Pacific Metal Cans Industry Segmentation By Geography
-
1. Asia Pacific
- 1.1. China
- 1.2. Japan
- 1.3. South Korea
- 1.4. India
- 1.5. Australia
- 1.6. New Zealand
- 1.7. Indonesia
- 1.8. Malaysia
- 1.9. Singapore
- 1.10. Thailand
- 1.11. Vietnam
- 1.12. Philippines
Asia Pacific Metal Cans Industry REPORT HIGHLIGHTS
| Aspects | Details |
|---|---|
| Study Period | 2019-2033 |
| Base Year | 2024 |
| Estimated Year | 2025 |
| Forecast Period | 2025-2033 |
| Historical Period | 2019-2024 |
| Growth Rate | CAGR of 4.40% from 2019-2033 |
| Segmentation |
|
Table of Contents
- 1. Introduction
- 1.1. Research Scope
- 1.2. Market Segmentation
- 1.3. Research Methodology
- 1.4. Definitions and Assumptions
- 2. Executive Summary
- 2.1. Introduction
- 3. Market Dynamics
- 3.1. Introduction
- 3.2. Market Drivers
- 3.2.1. High Recyclability Rates of Metal Packaging; Convenience and Lower Price Offered by Canned Food
- 3.3. Market Restrains
- 3.3.1. Presence of Alternate Packaging Solutions
- 3.4. Market Trends
- 3.4.1. Canned Food to dominate market share
- 4. Market Factor Analysis
- 4.1. Porters Five Forces
- 4.2. Supply/Value Chain
- 4.3. PESTEL analysis
- 4.4. Market Entropy
- 4.5. Patent/Trademark Analysis
- 5. Asia Pacific Metal Cans Industry Analysis, Insights and Forecast, 2019-2031
- 5.1. Market Analysis, Insights and Forecast - by Material Type
- 5.1.1. Aluminum
- 5.1.2. Steel
- 5.2. Market Analysis, Insights and Forecast - by Can Types
- 5.2.1. Food
- 5.2.1.1. Vegetables
- 5.2.1.2. Fruits
- 5.2.1.3. Pet Food
- 5.2.1.4. Soups
- 5.2.1.5. Coffee
- 5.2.1.6. Other Types of Food Cans
- 5.2.2. Beverage
- 5.2.2.1. Alcoholic Beverages
- 5.2.2.2. Non-alcoholic Beverages
- 5.2.3. Aerosol
- 5.2.3.1. Cosmetic and Personal Care
- 5.2.3.2. Household
- 5.2.3.3. Pharmaceutical/Veterinary
- 5.2.3.4. Paints and Varnishes
- 5.2.3.5. Automotive/Industrial
- 5.2.3.6. Other End-user Industries
- 5.2.4. Other Can Types
- 5.2.1. Food
- 5.3. Market Analysis, Insights and Forecast - by Region
- 5.3.1. Asia Pacific
- 5.1. Market Analysis, Insights and Forecast - by Material Type
- 6. China Asia Pacific Metal Cans Industry Analysis, Insights and Forecast, 2019-2031
- 7. Japan Asia Pacific Metal Cans Industry Analysis, Insights and Forecast, 2019-2031
- 8. India Asia Pacific Metal Cans Industry Analysis, Insights and Forecast, 2019-2031
- 9. South Korea Asia Pacific Metal Cans Industry Analysis, Insights and Forecast, 2019-2031
- 10. Taiwan Asia Pacific Metal Cans Industry Analysis, Insights and Forecast, 2019-2031
- 11. Australia Asia Pacific Metal Cans Industry Analysis, Insights and Forecast, 2019-2031
- 12. Rest of Asia-Pacific Asia Pacific Metal Cans Industry Analysis, Insights and Forecast, 2019-2031
- 13. Competitive Analysis
- 13.1. Market Share Analysis 2024
- 13.2. Company Profiles
- 13.2.1 Aj Packaging
- 13.2.1.1. Overview
- 13.2.1.2. Products
- 13.2.1.3. SWOT Analysis
- 13.2.1.4. Recent Developments
- 13.2.1.5. Financials (Based on Availability)
- 13.2.2 Amcor
- 13.2.2.1. Overview
- 13.2.2.2. Products
- 13.2.2.3. SWOT Analysis
- 13.2.2.4. Recent Developments
- 13.2.2.5. Financials (Based on Availability)
- 13.2.3 Ball Corporation
- 13.2.3.1. Overview
- 13.2.3.2. Products
- 13.2.3.3. SWOT Analysis
- 13.2.3.4. Recent Developments
- 13.2.3.5. Financials (Based on Availability)
- 13.2.4 Shanghai Jima Industrial Co Ltd*List Not Exhaustive
- 13.2.4.1. Overview
- 13.2.4.2. Products
- 13.2.4.3. SWOT Analysis
- 13.2.4.4. Recent Developments
- 13.2.4.5. Financials (Based on Availability)
- 13.2.5 Silgan Containers LLC
- 13.2.5.1. Overview
- 13.2.5.2. Products
- 13.2.5.3. SWOT Analysis
- 13.2.5.4. Recent Developments
- 13.2.5.5. Financials (Based on Availability)
- 13.2.6 Crown Holdings
- 13.2.6.1. Overview
- 13.2.6.2. Products
- 13.2.6.3. SWOT Analysis
- 13.2.6.4. Recent Developments
- 13.2.6.5. Financials (Based on Availability)
- 13.2.7 EBI Packaging
- 13.2.7.1. Overview
- 13.2.7.2. Products
- 13.2.7.3. SWOT Analysis
- 13.2.7.4. Recent Developments
- 13.2.7.5. Financials (Based on Availability)
- 13.2.8 BWAY
- 13.2.8.1. Overview
- 13.2.8.2. Products
- 13.2.8.3. SWOT Analysis
- 13.2.8.4. Recent Developments
- 13.2.8.5. Financials (Based on Availability)
- 13.2.1 Aj Packaging
List of Figures
- Figure 1: Asia Pacific Metal Cans Industry Revenue Breakdown (Million, %) by Product 2024 & 2032
- Figure 2: Asia Pacific Metal Cans Industry Share (%) by Company 2024
List of Tables
- Table 1: Asia Pacific Metal Cans Industry Revenue Million Forecast, by Region 2019 & 2032
- Table 2: Asia Pacific Metal Cans Industry Revenue Million Forecast, by Material Type 2019 & 2032
- Table 3: Asia Pacific Metal Cans Industry Revenue Million Forecast, by Can Types 2019 & 2032
- Table 4: Asia Pacific Metal Cans Industry Revenue Million Forecast, by Region 2019 & 2032
- Table 5: Asia Pacific Metal Cans Industry Revenue Million Forecast, by Country 2019 & 2032
- Table 6: China Asia Pacific Metal Cans Industry Revenue (Million) Forecast, by Application 2019 & 2032
- Table 7: Japan Asia Pacific Metal Cans Industry Revenue (Million) Forecast, by Application 2019 & 2032
- Table 8: India Asia Pacific Metal Cans Industry Revenue (Million) Forecast, by Application 2019 & 2032
- Table 9: South Korea Asia Pacific Metal Cans Industry Revenue (Million) Forecast, by Application 2019 & 2032
- Table 10: Taiwan Asia Pacific Metal Cans Industry Revenue (Million) Forecast, by Application 2019 & 2032
- Table 11: Australia Asia Pacific Metal Cans Industry Revenue (Million) Forecast, by Application 2019 & 2032
- Table 12: Rest of Asia-Pacific Asia Pacific Metal Cans Industry Revenue (Million) Forecast, by Application 2019 & 2032
- Table 13: Asia Pacific Metal Cans Industry Revenue Million Forecast, by Material Type 2019 & 2032
- Table 14: Asia Pacific Metal Cans Industry Revenue Million Forecast, by Can Types 2019 & 2032
- Table 15: Asia Pacific Metal Cans Industry Revenue Million Forecast, by Country 2019 & 2032
- Table 16: China Asia Pacific Metal Cans Industry Revenue (Million) Forecast, by Application 2019 & 2032
- Table 17: Japan Asia Pacific Metal Cans Industry Revenue (Million) Forecast, by Application 2019 & 2032
- Table 18: South Korea Asia Pacific Metal Cans Industry Revenue (Million) Forecast, by Application 2019 & 2032
- Table 19: India Asia Pacific Metal Cans Industry Revenue (Million) Forecast, by Application 2019 & 2032
- Table 20: Australia Asia Pacific Metal Cans Industry Revenue (Million) Forecast, by Application 2019 & 2032
- Table 21: New Zealand Asia Pacific Metal Cans Industry Revenue (Million) Forecast, by Application 2019 & 2032
- Table 22: Indonesia Asia Pacific Metal Cans Industry Revenue (Million) Forecast, by Application 2019 & 2032
- Table 23: Malaysia Asia Pacific Metal Cans Industry Revenue (Million) Forecast, by Application 2019 & 2032
- Table 24: Singapore Asia Pacific Metal Cans Industry Revenue (Million) Forecast, by Application 2019 & 2032
- Table 25: Thailand Asia Pacific Metal Cans Industry Revenue (Million) Forecast, by Application 2019 & 2032
- Table 26: Vietnam Asia Pacific Metal Cans Industry Revenue (Million) Forecast, by Application 2019 & 2032
- Table 27: Philippines Asia Pacific Metal Cans Industry Revenue (Million) Forecast, by Application 2019 & 2032
Frequently Asked Questions
1. What is the projected Compound Annual Growth Rate (CAGR) of the Asia Pacific Metal Cans Industry?
The projected CAGR is approximately 4.40%.
2. Which companies are prominent players in the Asia Pacific Metal Cans Industry?
Key companies in the market include Aj Packaging, Amcor, Ball Corporation, Shanghai Jima Industrial Co Ltd*List Not Exhaustive, Silgan Containers LLC, Crown Holdings, EBI Packaging, BWAY.
3. What are the main segments of the Asia Pacific Metal Cans Industry?
The market segments include Material Type, Can Types.
4. Can you provide details about the market size?
The market size is estimated to be USD XX Million as of 2022.
5. What are some drivers contributing to market growth?
High Recyclability Rates of Metal Packaging; Convenience and Lower Price Offered by Canned Food.
6. What are the notable trends driving market growth?
Canned Food to dominate market share.
7. Are there any restraints impacting market growth?
Presence of Alternate Packaging Solutions.
8. Can you provide examples of recent developments in the market?
February 2021 - the central can testing laboratory of China's Sunrise Group, formerly the Shengxing Group, in Anhui, was officially accredited by global food and drinks giant PepsiCo, and it became the first company in China to achieve this status. Therefore, companies are targeting to cut the cost of metal can production through the introduction of new technologies by building the required infrastructure for R&D and testing.
9. What pricing options are available for accessing the report?
Pricing options include single-user, multi-user, and enterprise licenses priced at USD 4750, USD 4950, and USD 6800 respectively.
10. Is the market size provided in terms of value or volume?
The market size is provided in terms of value, measured in Million.
11. Are there any specific market keywords associated with the report?
Yes, the market keyword associated with the report is "Asia Pacific Metal Cans Industry," which aids in identifying and referencing the specific market segment covered.
12. How do I determine which pricing option suits my needs best?
The pricing options vary based on user requirements and access needs. Individual users may opt for single-user licenses, while businesses requiring broader access may choose multi-user or enterprise licenses for cost-effective access to the report.
13. Are there any additional resources or data provided in the Asia Pacific Metal Cans Industry report?
While the report offers comprehensive insights, it's advisable to review the specific contents or supplementary materials provided to ascertain if additional resources or data are available.
14. How can I stay updated on further developments or reports in the Asia Pacific Metal Cans Industry?
To stay informed about further developments, trends, and reports in the Asia Pacific Metal Cans Industry, consider subscribing to industry newsletters, following relevant companies and organizations, or regularly checking reputable industry news sources and publications.
Methodology
Step 1 - Identification of Relevant Samples Size from Population Database


Step 2 - Approaches for Defining Global Market Size (Value, Volume* & Price*)

Note*: In applicable scenarios
Step 3 - Data Sources
Primary Research
- Web Analytics
- Survey Reports
- Research Institute
- Latest Research Reports
- Opinion Leaders
Secondary Research
- Annual Reports
- White Paper
- Latest Press Release
- Industry Association
- Paid Database
- Investor Presentations

Step 4 - Data Triangulation
Involves using different sources of information in order to increase the validity of a study
These sources are likely to be stakeholders in a program - participants, other researchers, program staff, other community members, and so on.
Then we put all data in single framework & apply various statistical tools to find out the dynamic on the market.
During the analysis stage, feedback from the stakeholder groups would be compared to determine areas of agreement as well as areas of divergence
