

Key Insights
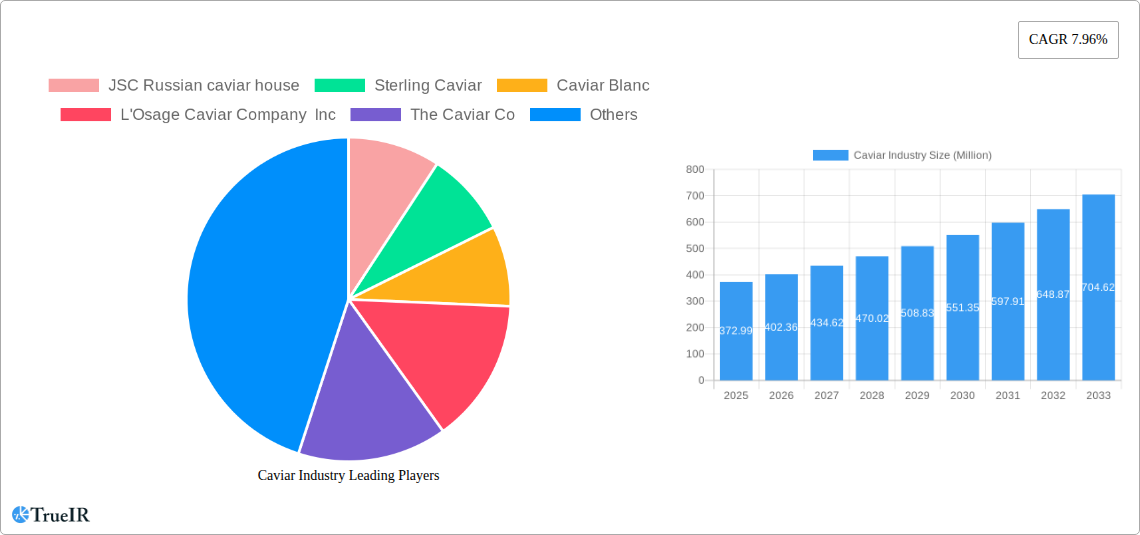
The global caviar market, valued at $372.99 million in 2025, is projected to experience robust growth, driven by increasing demand for luxury food products and rising disposable incomes in key regions. A Compound Annual Growth Rate (CAGR) of 7.96% from 2025 to 2033 indicates a significant expansion of this market over the forecast period. Several factors contribute to this positive outlook. The growing popularity of caviar in gourmet cuisine, its use in upscale restaurants and hotels (On-Trade channel), and its increasing availability through online retailers and specialty stores (Off-Trade channel) all fuel market expansion. Consumer preferences for premium, high-quality food experiences are key drivers, alongside targeted marketing campaigns that highlight caviar's unique taste and luxurious image. While price sensitivity remains a restraint, particularly in emerging markets, the ongoing diversification of caviar types (Sevruga, Osetra, Beluga, Sterlet, and others), along with innovative packaging and preservation methods (Fresh, Dried, Frozen), are mitigating this challenge. The market is segmented geographically, with North America, Europe, and Asia-Pacific representing major consumption hubs. Regional variations in consumer preferences and purchasing power contribute to the nuanced growth patterns observed across these areas. Key players in the market, including JSC Russian Caviar House, Sterling Caviar, and others, are actively engaged in strategic initiatives such as product diversification, acquisitions, and partnerships to capitalize on emerging market opportunities.
The continued emphasis on sustainable and ethically sourced caviar is a significant trend influencing the market. Consumers are increasingly aware of environmental and social considerations related to caviar production, leading to a growing demand for sustainably harvested and responsibly produced caviar. This trend is expected to shape future market dynamics, pushing producers to adopt eco-friendly practices and transparent sourcing methods. Furthermore, the rise of innovative culinary applications and fusion cuisine is expanding the appeal of caviar beyond its traditional uses, leading to new market opportunities. The evolving distribution channels and the use of e-commerce platforms are streamlining access to this luxury product, making it more readily available to a wider consumer base. Future growth will hinge on maintaining a balance between meeting the demand for this luxury food while ensuring responsible production and ethical sourcing.
Dynamic Caviar Industry Market Report: 2019-2033
This comprehensive report provides a deep dive into the global caviar market, offering invaluable insights for investors, industry professionals, and strategic decision-makers. With a detailed analysis spanning the period 2019-2033, including a base year of 2025 and a forecast period of 2025-2033, this report leverages extensive data and expert analysis to illuminate market trends, competitive dynamics, and future growth potential. The global caviar market is estimated to reach xx Million by 2033.
Caviar Industry Market Structure & Competitive Landscape
The global caviar market exhibits a moderately concentrated structure, with a few major players holding significant market share. However, the presence of numerous smaller, specialized producers contributes to a dynamic competitive landscape. The industry is characterized by significant innovation drivers, including sustainable aquaculture techniques and the development of new product offerings. Regulatory frameworks, particularly those concerning the conservation of sturgeon populations, exert considerable influence. Product substitutes, such as plant-based alternatives, are gaining traction, though they remain niche players in comparison to the luxury positioning of traditional caviar. End-user segmentation is primarily high-net-worth individuals and luxury restaurants, but rising consumer interest in gourmet foods suggests further expansion opportunities. M&A activity has been moderate, with xx Million in transactions recorded during the historical period (2019-2024), primarily focused on expanding production capabilities and geographical reach. The Herfindahl-Hirschman Index (HHI) for the market is estimated to be xx, indicating a moderately concentrated landscape.
Caviar Industry Market Trends & Opportunities
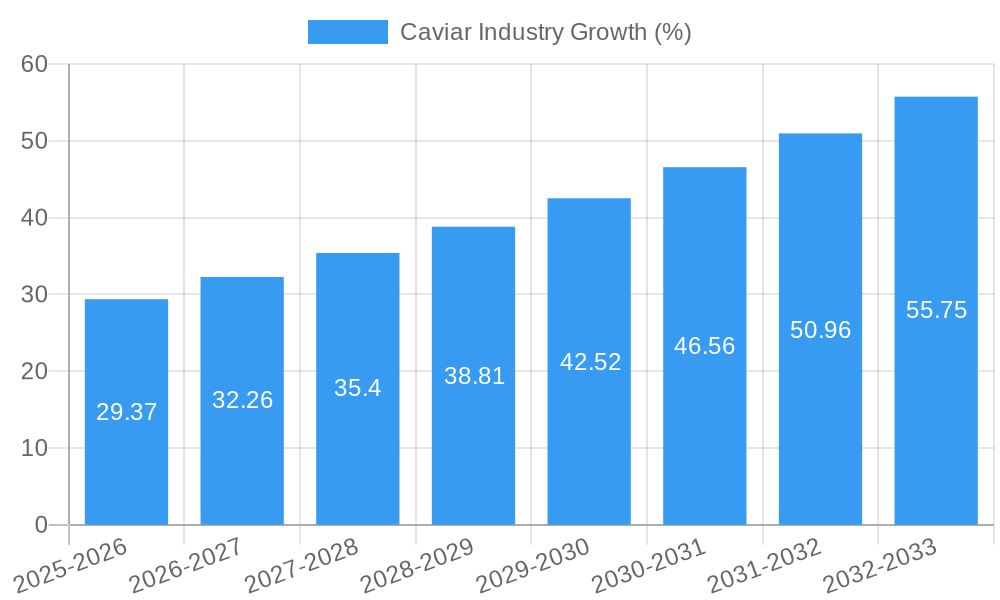
The global caviar market demonstrates a robust growth trajectory, with a projected Compound Annual Growth Rate (CAGR) of xx% during the forecast period (2025-2033). This growth is fueled by several factors, including rising disposable incomes in key markets, increased consumer demand for luxury food products, and a growing preference for sustainable and ethically sourced caviar. Technological advancements, particularly in sturgeon aquaculture, are playing a crucial role in ensuring supply and improving product consistency. Consumer preferences are shifting towards more sustainable and traceable products, which is pushing producers to adopt transparent and responsible production practices. Competitive dynamics are intensifying, with companies vying for market share through product differentiation, brand building, and strategic partnerships. Market penetration rate for premium caviar segments is currently estimated at xx%, with considerable potential for growth in emerging markets. Further analysis reveals a stronger preference for specific types, such as Osetra and Beluga, driving their premium market share.
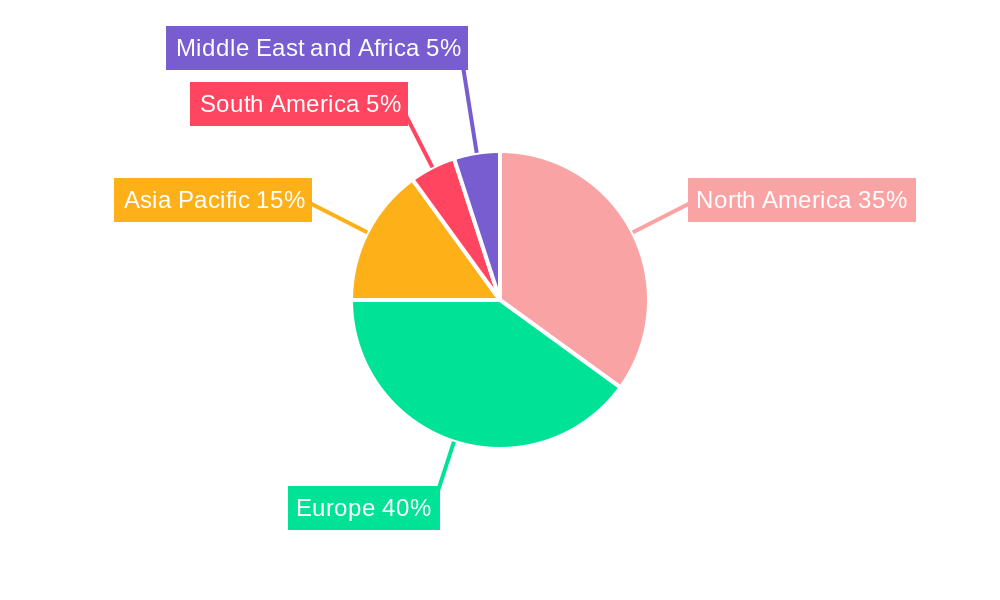
Dominant Markets & Segments in Caviar Industry
The dominant market for caviar remains concentrated in Europe and North America, with strong growth projected in Asia-Pacific, particularly China, due to increasing affluence and changing consumption patterns.
Key Growth Drivers:
- Rising Disposable Incomes: Increased purchasing power in developing economies.
- Luxury Food Trends: Growing consumer preference for premium and gourmet food items.
- Tourism and Gastronomy: Rising tourist arrivals in key caviar-consuming regions.
Market Dominance Analysis:
Within the product types, Beluga caviar maintains its position as the highest priced and most sought-after variety, while Osetra enjoys strong demand and contributes a significant portion of the overall market volume. Fresh caviar holds the largest market share amongst forms, however, frozen caviar shows strong growth potential due to convenience and extended shelf life. The On-Trade sales channel (restaurants and hotels) holds a significantly larger share than the Off-Trade (retail) sector, driven by the premium image of caviar consumption in high-end dining establishments.
Caviar Industry Product Analysis
Product innovation in the caviar industry focuses on enhancing sustainability, traceability, and consistency. Technological advancements in aquaculture, including selective breeding and improved feeding techniques, are leading to higher-quality caviar with consistent characteristics. The growing demand for organic and sustainably sourced caviar is driving the development of certification programs and traceability systems. These innovations are bolstering the premium positioning of caviar in the luxury food market, offering consumers a transparent and responsible product.
Key Drivers, Barriers & Challenges in Caviar Industry
Key Drivers:
- Rising Affluence: Increased disposable incomes drive luxury food consumption.
- Sustainable Aquaculture: Improved production methods address environmental concerns.
- Gourmet Food Culture: The growing global appreciation for high-end culinary experiences.
Challenges & Restraints:
- Regulatory Complexity: Strict regulations on sturgeon farming and caviar trade pose significant hurdles.
- Supply Chain Volatility: The delicate nature of caviar makes supply chain management critical.
- Price Volatility: Fluctuations in supply and demand create pricing instability. Estimated impact on overall market value is xx Million annually.
Growth Drivers in the Caviar Industry Market
The caviar market's growth is fueled by rising disposable incomes in key regions, increased demand for luxury food products, and advancements in sustainable aquaculture practices. The development of traceability systems and certification programs also enhances consumer confidence, bolstering demand for premium caviar. Government support for sustainable sturgeon farming and positive regulatory developments contribute to stable market growth.
Challenges Impacting Caviar Industry Growth
Challenges include fluctuating raw material prices, stringent regulations on sturgeon farming and trade, and the potential for disease outbreaks affecting production. Competitive pressures from substitutes and the high cost of production also pose constraints to market growth.
Key Players Shaping the Caviar Industry Market
- JSC Russian caviar house
- Sterling Caviar
- Caviar Blanc
- L'Osage Caviar Company Inc
- The Caviar Co
- Black River Caviar
- Labeyrie Fine Food
- Sepehr Dad Caviar GmbH
- Caviar Creator Inc
- Sasanian Caviar Inc
Significant Caviar Industry Milestones
- 2020: Several major caviar producers implemented new traceability systems to enhance transparency and consumer trust.
- 2022: A significant investment in sustainable aquaculture technology boosted production capabilities.
- 2023: Launch of a new line of organic caviar.
Future Outlook for Caviar Industry Market
The caviar market is poised for continued growth driven by rising consumer demand, innovation in sustainable aquaculture, and the growing appeal of luxury food experiences. Strategic opportunities exist in expanding into new markets, developing innovative products, and leveraging technology to enhance traceability and sustainability. The market is expected to reach xx Million by 2033.
Caviar Industry Segmentation
-
1. Type
- 1.1. Sevruga
- 1.2. Osetra
- 1.3. Beluga
- 1.4. Sterlet
- 1.5. Other Types
-
2. Form
- 2.1. Fresh
- 2.2. Dried
- 2.3. Frozen
-
3. Sales Channel
- 3.1. On-Trade
- 3.2. Off-Trade
Caviar Industry Segmentation By Geography
-
1. North America
- 1.1. United States
- 1.2. Canada
- 1.3. Mexico
- 1.4. Rest of North America
-
2. Europe
- 2.1. Spain
- 2.2. United Kingdom
- 2.3. Germany
- 2.4. France
- 2.5. Italy
- 2.6. Russia
- 2.7. Rest of Europe
-
3. Asia Pacific
- 3.1. China
- 3.2. Japan
- 3.3. India
- 3.4. Australia
- 3.5. Rest of Asia Pacific
-
4. South America
- 4.1. Brazil
- 4.2. Argentina
- 4.3. Rest of South America
-
5. Middle East and Africa
- 5.1. South Africa
- 5.2. Saudi Arabia
- 5.3. Rest of Middle East and Africa
Caviar Industry REPORT HIGHLIGHTS
| Aspects | Details |
|---|---|
| Study Period | 2019-2033 |
| Base Year | 2024 |
| Estimated Year | 2025 |
| Forecast Period | 2025-2033 |
| Historical Period | 2019-2024 |
| Growth Rate | CAGR of 7.96% from 2019-2033 |
| Segmentation |
|
Table of Contents
- 1. Introduction
- 1.1. Research Scope
- 1.2. Market Segmentation
- 1.3. Research Methodology
- 1.4. Definitions and Assumptions
- 2. Executive Summary
- 2.1. Introduction
- 3. Market Dynamics
- 3.1. Introduction
- 3.2. Market Drivers
- 3.2.1. Caviar's use in high-end cuisine and gourmet dining boosts its market presence
- 3.3. Market Restrains
- 3.3.1. High price of caviar limits its market to premium segment
- 3.4. Market Trends
- 3.4.1. Advances in aquaculture technology improve caviar quality and production efficiency
- 4. Market Factor Analysis
- 4.1. Porters Five Forces
- 4.2. Supply/Value Chain
- 4.3. PESTEL analysis
- 4.4. Market Entropy
- 4.5. Patent/Trademark Analysis
- 5. Global Caviar Industry Analysis, Insights and Forecast, 2019-2031
- 5.1. Market Analysis, Insights and Forecast - by Type
- 5.1.1. Sevruga
- 5.1.2. Osetra
- 5.1.3. Beluga
- 5.1.4. Sterlet
- 5.1.5. Other Types
- 5.2. Market Analysis, Insights and Forecast - by Form
- 5.2.1. Fresh
- 5.2.2. Dried
- 5.2.3. Frozen
- 5.3. Market Analysis, Insights and Forecast - by Sales Channel
- 5.3.1. On-Trade
- 5.3.2. Off-Trade
- 5.4. Market Analysis, Insights and Forecast - by Region
- 5.4.1. North America
- 5.4.2. Europe
- 5.4.3. Asia Pacific
- 5.4.4. South America
- 5.4.5. Middle East and Africa
- 5.1. Market Analysis, Insights and Forecast - by Type
- 6. North America Caviar Industry Analysis, Insights and Forecast, 2019-2031
- 6.1. Market Analysis, Insights and Forecast - by Type
- 6.1.1. Sevruga
- 6.1.2. Osetra
- 6.1.3. Beluga
- 6.1.4. Sterlet
- 6.1.5. Other Types
- 6.2. Market Analysis, Insights and Forecast - by Form
- 6.2.1. Fresh
- 6.2.2. Dried
- 6.2.3. Frozen
- 6.3. Market Analysis, Insights and Forecast - by Sales Channel
- 6.3.1. On-Trade
- 6.3.2. Off-Trade
- 6.1. Market Analysis, Insights and Forecast - by Type
- 7. Europe Caviar Industry Analysis, Insights and Forecast, 2019-2031
- 7.1. Market Analysis, Insights and Forecast - by Type
- 7.1.1. Sevruga
- 7.1.2. Osetra
- 7.1.3. Beluga
- 7.1.4. Sterlet
- 7.1.5. Other Types
- 7.2. Market Analysis, Insights and Forecast - by Form
- 7.2.1. Fresh
- 7.2.2. Dried
- 7.2.3. Frozen
- 7.3. Market Analysis, Insights and Forecast - by Sales Channel
- 7.3.1. On-Trade
- 7.3.2. Off-Trade
- 7.1. Market Analysis, Insights and Forecast - by Type
- 8. Asia Pacific Caviar Industry Analysis, Insights and Forecast, 2019-2031
- 8.1. Market Analysis, Insights and Forecast - by Type
- 8.1.1. Sevruga
- 8.1.2. Osetra
- 8.1.3. Beluga
- 8.1.4. Sterlet
- 8.1.5. Other Types
- 8.2. Market Analysis, Insights and Forecast - by Form
- 8.2.1. Fresh
- 8.2.2. Dried
- 8.2.3. Frozen
- 8.3. Market Analysis, Insights and Forecast - by Sales Channel
- 8.3.1. On-Trade
- 8.3.2. Off-Trade
- 8.1. Market Analysis, Insights and Forecast - by Type
- 9. South America Caviar Industry Analysis, Insights and Forecast, 2019-2031
- 9.1. Market Analysis, Insights and Forecast - by Type
- 9.1.1. Sevruga
- 9.1.2. Osetra
- 9.1.3. Beluga
- 9.1.4. Sterlet
- 9.1.5. Other Types
- 9.2. Market Analysis, Insights and Forecast - by Form
- 9.2.1. Fresh
- 9.2.2. Dried
- 9.2.3. Frozen
- 9.3. Market Analysis, Insights and Forecast - by Sales Channel
- 9.3.1. On-Trade
- 9.3.2. Off-Trade
- 9.1. Market Analysis, Insights and Forecast - by Type
- 10. Middle East and Africa Caviar Industry Analysis, Insights and Forecast, 2019-2031
- 10.1. Market Analysis, Insights and Forecast - by Type
- 10.1.1. Sevruga
- 10.1.2. Osetra
- 10.1.3. Beluga
- 10.1.4. Sterlet
- 10.1.5. Other Types
- 10.2. Market Analysis, Insights and Forecast - by Form
- 10.2.1. Fresh
- 10.2.2. Dried
- 10.2.3. Frozen
- 10.3. Market Analysis, Insights and Forecast - by Sales Channel
- 10.3.1. On-Trade
- 10.3.2. Off-Trade
- 10.1. Market Analysis, Insights and Forecast - by Type
- 11. North America Caviar Industry Analysis, Insights and Forecast, 2019-2031
- 11.1. Market Analysis, Insights and Forecast - By Country/Sub-region
- 11.1.1 United States
- 11.1.2 Canada
- 11.1.3 Mexico
- 11.1.4 Rest of North America
- 12. Europe Caviar Industry Analysis, Insights and Forecast, 2019-2031
- 12.1. Market Analysis, Insights and Forecast - By Country/Sub-region
- 12.1.1 Spain
- 12.1.2 United Kingdom
- 12.1.3 Germany
- 12.1.4 France
- 12.1.5 Italy
- 12.1.6 Russia
- 12.1.7 Rest of Europe
- 13. Asia Pacific Caviar Industry Analysis, Insights and Forecast, 2019-2031
- 13.1. Market Analysis, Insights and Forecast - By Country/Sub-region
- 13.1.1 China
- 13.1.2 Japan
- 13.1.3 India
- 13.1.4 Australia
- 13.1.5 Rest of Asia Pacific
- 14. South America Caviar Industry Analysis, Insights and Forecast, 2019-2031
- 14.1. Market Analysis, Insights and Forecast - By Country/Sub-region
- 14.1.1 Brazil
- 14.1.2 Argentina
- 14.1.3 Rest of South America
- 15. Middle East and Africa Caviar Industry Analysis, Insights and Forecast, 2019-2031
- 15.1. Market Analysis, Insights and Forecast - By Country/Sub-region
- 15.1.1 South Africa
- 15.1.2 Saudi Arabia
- 15.1.3 Rest of Middle East and Africa
- 16. Competitive Analysis
- 16.1. Global Market Share Analysis 2024
- 16.2. Company Profiles
- 16.2.1 JSC Russian caviar house
- 16.2.1.1. Overview
- 16.2.1.2. Products
- 16.2.1.3. SWOT Analysis
- 16.2.1.4. Recent Developments
- 16.2.1.5. Financials (Based on Availability)
- 16.2.2 Sterling Caviar
- 16.2.2.1. Overview
- 16.2.2.2. Products
- 16.2.2.3. SWOT Analysis
- 16.2.2.4. Recent Developments
- 16.2.2.5. Financials (Based on Availability)
- 16.2.3 Caviar Blanc
- 16.2.3.1. Overview
- 16.2.3.2. Products
- 16.2.3.3. SWOT Analysis
- 16.2.3.4. Recent Developments
- 16.2.3.5. Financials (Based on Availability)
- 16.2.4 L'Osage Caviar Company Inc
- 16.2.4.1. Overview
- 16.2.4.2. Products
- 16.2.4.3. SWOT Analysis
- 16.2.4.4. Recent Developments
- 16.2.4.5. Financials (Based on Availability)
- 16.2.5 The Caviar Co
- 16.2.5.1. Overview
- 16.2.5.2. Products
- 16.2.5.3. SWOT Analysis
- 16.2.5.4. Recent Developments
- 16.2.5.5. Financials (Based on Availability)
- 16.2.6 Black River Caviar
- 16.2.6.1. Overview
- 16.2.6.2. Products
- 16.2.6.3. SWOT Analysis
- 16.2.6.4. Recent Developments
- 16.2.6.5. Financials (Based on Availability)
- 16.2.7 Labeyrie Fine Food
- 16.2.7.1. Overview
- 16.2.7.2. Products
- 16.2.7.3. SWOT Analysis
- 16.2.7.4. Recent Developments
- 16.2.7.5. Financials (Based on Availability)
- 16.2.8 Sepehr Dad Caviar GmbH
- 16.2.8.1. Overview
- 16.2.8.2. Products
- 16.2.8.3. SWOT Analysis
- 16.2.8.4. Recent Developments
- 16.2.8.5. Financials (Based on Availability)
- 16.2.9 Caviar Creator Inc
- 16.2.9.1. Overview
- 16.2.9.2. Products
- 16.2.9.3. SWOT Analysis
- 16.2.9.4. Recent Developments
- 16.2.9.5. Financials (Based on Availability)
- 16.2.10 Sasanian Caviar Inc
- 16.2.10.1. Overview
- 16.2.10.2. Products
- 16.2.10.3. SWOT Analysis
- 16.2.10.4. Recent Developments
- 16.2.10.5. Financials (Based on Availability)
- 16.2.1 JSC Russian caviar house
List of Figures
- Figure 1: Global Caviar Industry Revenue Breakdown (Million, %) by Region 2024 & 2032
- Figure 2: North America Caviar Industry Revenue (Million), by Country 2024 & 2032
- Figure 3: North America Caviar Industry Revenue Share (%), by Country 2024 & 2032
- Figure 4: Europe Caviar Industry Revenue (Million), by Country 2024 & 2032
- Figure 5: Europe Caviar Industry Revenue Share (%), by Country 2024 & 2032
- Figure 6: Asia Pacific Caviar Industry Revenue (Million), by Country 2024 & 2032
- Figure 7: Asia Pacific Caviar Industry Revenue Share (%), by Country 2024 & 2032
- Figure 8: South America Caviar Industry Revenue (Million), by Country 2024 & 2032
- Figure 9: South America Caviar Industry Revenue Share (%), by Country 2024 & 2032
- Figure 10: Middle East and Africa Caviar Industry Revenue (Million), by Country 2024 & 2032
- Figure 11: Middle East and Africa Caviar Industry Revenue Share (%), by Country 2024 & 2032
- Figure 12: North America Caviar Industry Revenue (Million), by Type 2024 & 2032
- Figure 13: North America Caviar Industry Revenue Share (%), by Type 2024 & 2032
- Figure 14: North America Caviar Industry Revenue (Million), by Form 2024 & 2032
- Figure 15: North America Caviar Industry Revenue Share (%), by Form 2024 & 2032
- Figure 16: North America Caviar Industry Revenue (Million), by Sales Channel 2024 & 2032
- Figure 17: North America Caviar Industry Revenue Share (%), by Sales Channel 2024 & 2032
- Figure 18: North America Caviar Industry Revenue (Million), by Country 2024 & 2032
- Figure 19: North America Caviar Industry Revenue Share (%), by Country 2024 & 2032
- Figure 20: Europe Caviar Industry Revenue (Million), by Type 2024 & 2032
- Figure 21: Europe Caviar Industry Revenue Share (%), by Type 2024 & 2032
- Figure 22: Europe Caviar Industry Revenue (Million), by Form 2024 & 2032
- Figure 23: Europe Caviar Industry Revenue Share (%), by Form 2024 & 2032
- Figure 24: Europe Caviar Industry Revenue (Million), by Sales Channel 2024 & 2032
- Figure 25: Europe Caviar Industry Revenue Share (%), by Sales Channel 2024 & 2032
- Figure 26: Europe Caviar Industry Revenue (Million), by Country 2024 & 2032
- Figure 27: Europe Caviar Industry Revenue Share (%), by Country 2024 & 2032
- Figure 28: Asia Pacific Caviar Industry Revenue (Million), by Type 2024 & 2032
- Figure 29: Asia Pacific Caviar Industry Revenue Share (%), by Type 2024 & 2032
- Figure 30: Asia Pacific Caviar Industry Revenue (Million), by Form 2024 & 2032
- Figure 31: Asia Pacific Caviar Industry Revenue Share (%), by Form 2024 & 2032
- Figure 32: Asia Pacific Caviar Industry Revenue (Million), by Sales Channel 2024 & 2032
- Figure 33: Asia Pacific Caviar Industry Revenue Share (%), by Sales Channel 2024 & 2032
- Figure 34: Asia Pacific Caviar Industry Revenue (Million), by Country 2024 & 2032
- Figure 35: Asia Pacific Caviar Industry Revenue Share (%), by Country 2024 & 2032
- Figure 36: South America Caviar Industry Revenue (Million), by Type 2024 & 2032
- Figure 37: South America Caviar Industry Revenue Share (%), by Type 2024 & 2032
- Figure 38: South America Caviar Industry Revenue (Million), by Form 2024 & 2032
- Figure 39: South America Caviar Industry Revenue Share (%), by Form 2024 & 2032
- Figure 40: South America Caviar Industry Revenue (Million), by Sales Channel 2024 & 2032
- Figure 41: South America Caviar Industry Revenue Share (%), by Sales Channel 2024 & 2032
- Figure 42: South America Caviar Industry Revenue (Million), by Country 2024 & 2032
- Figure 43: South America Caviar Industry Revenue Share (%), by Country 2024 & 2032
- Figure 44: Middle East and Africa Caviar Industry Revenue (Million), by Type 2024 & 2032
- Figure 45: Middle East and Africa Caviar Industry Revenue Share (%), by Type 2024 & 2032
- Figure 46: Middle East and Africa Caviar Industry Revenue (Million), by Form 2024 & 2032
- Figure 47: Middle East and Africa Caviar Industry Revenue Share (%), by Form 2024 & 2032
- Figure 48: Middle East and Africa Caviar Industry Revenue (Million), by Sales Channel 2024 & 2032
- Figure 49: Middle East and Africa Caviar Industry Revenue Share (%), by Sales Channel 2024 & 2032
- Figure 50: Middle East and Africa Caviar Industry Revenue (Million), by Country 2024 & 2032
- Figure 51: Middle East and Africa Caviar Industry Revenue Share (%), by Country 2024 & 2032
List of Tables
- Table 1: Global Caviar Industry Revenue Million Forecast, by Region 2019 & 2032
- Table 2: Global Caviar Industry Revenue Million Forecast, by Type 2019 & 2032
- Table 3: Global Caviar Industry Revenue Million Forecast, by Form 2019 & 2032
- Table 4: Global Caviar Industry Revenue Million Forecast, by Sales Channel 2019 & 2032
- Table 5: Global Caviar Industry Revenue Million Forecast, by Region 2019 & 2032
- Table 6: Global Caviar Industry Revenue Million Forecast, by Country 2019 & 2032
- Table 7: United States Caviar Industry Revenue (Million) Forecast, by Application 2019 & 2032
- Table 8: Canada Caviar Industry Revenue (Million) Forecast, by Application 2019 & 2032
- Table 9: Mexico Caviar Industry Revenue (Million) Forecast, by Application 2019 & 2032
- Table 10: Rest of North America Caviar Industry Revenue (Million) Forecast, by Application 2019 & 2032
- Table 11: Global Caviar Industry Revenue Million Forecast, by Country 2019 & 2032
- Table 12: Spain Caviar Industry Revenue (Million) Forecast, by Application 2019 & 2032
- Table 13: United Kingdom Caviar Industry Revenue (Million) Forecast, by Application 2019 & 2032
- Table 14: Germany Caviar Industry Revenue (Million) Forecast, by Application 2019 & 2032
- Table 15: France Caviar Industry Revenue (Million) Forecast, by Application 2019 & 2032
- Table 16: Italy Caviar Industry Revenue (Million) Forecast, by Application 2019 & 2032
- Table 17: Russia Caviar Industry Revenue (Million) Forecast, by Application 2019 & 2032
- Table 18: Rest of Europe Caviar Industry Revenue (Million) Forecast, by Application 2019 & 2032
- Table 19: Global Caviar Industry Revenue Million Forecast, by Country 2019 & 2032
- Table 20: China Caviar Industry Revenue (Million) Forecast, by Application 2019 & 2032
- Table 21: Japan Caviar Industry Revenue (Million) Forecast, by Application 2019 & 2032
- Table 22: India Caviar Industry Revenue (Million) Forecast, by Application 2019 & 2032
- Table 23: Australia Caviar Industry Revenue (Million) Forecast, by Application 2019 & 2032
- Table 24: Rest of Asia Pacific Caviar Industry Revenue (Million) Forecast, by Application 2019 & 2032
- Table 25: Global Caviar Industry Revenue Million Forecast, by Country 2019 & 2032
- Table 26: Brazil Caviar Industry Revenue (Million) Forecast, by Application 2019 & 2032
- Table 27: Argentina Caviar Industry Revenue (Million) Forecast, by Application 2019 & 2032
- Table 28: Rest of South America Caviar Industry Revenue (Million) Forecast, by Application 2019 & 2032
- Table 29: Global Caviar Industry Revenue Million Forecast, by Country 2019 & 2032
- Table 30: South Africa Caviar Industry Revenue (Million) Forecast, by Application 2019 & 2032
- Table 31: Saudi Arabia Caviar Industry Revenue (Million) Forecast, by Application 2019 & 2032
- Table 32: Rest of Middle East and Africa Caviar Industry Revenue (Million) Forecast, by Application 2019 & 2032
- Table 33: Global Caviar Industry Revenue Million Forecast, by Type 2019 & 2032
- Table 34: Global Caviar Industry Revenue Million Forecast, by Form 2019 & 2032
- Table 35: Global Caviar Industry Revenue Million Forecast, by Sales Channel 2019 & 2032
- Table 36: Global Caviar Industry Revenue Million Forecast, by Country 2019 & 2032
- Table 37: United States Caviar Industry Revenue (Million) Forecast, by Application 2019 & 2032
- Table 38: Canada Caviar Industry Revenue (Million) Forecast, by Application 2019 & 2032
- Table 39: Mexico Caviar Industry Revenue (Million) Forecast, by Application 2019 & 2032
- Table 40: Rest of North America Caviar Industry Revenue (Million) Forecast, by Application 2019 & 2032
- Table 41: Global Caviar Industry Revenue Million Forecast, by Type 2019 & 2032
- Table 42: Global Caviar Industry Revenue Million Forecast, by Form 2019 & 2032
- Table 43: Global Caviar Industry Revenue Million Forecast, by Sales Channel 2019 & 2032
- Table 44: Global Caviar Industry Revenue Million Forecast, by Country 2019 & 2032
- Table 45: Spain Caviar Industry Revenue (Million) Forecast, by Application 2019 & 2032
- Table 46: United Kingdom Caviar Industry Revenue (Million) Forecast, by Application 2019 & 2032
- Table 47: Germany Caviar Industry Revenue (Million) Forecast, by Application 2019 & 2032
- Table 48: France Caviar Industry Revenue (Million) Forecast, by Application 2019 & 2032
- Table 49: Italy Caviar Industry Revenue (Million) Forecast, by Application 2019 & 2032
- Table 50: Russia Caviar Industry Revenue (Million) Forecast, by Application 2019 & 2032
- Table 51: Rest of Europe Caviar Industry Revenue (Million) Forecast, by Application 2019 & 2032
- Table 52: Global Caviar Industry Revenue Million Forecast, by Type 2019 & 2032
- Table 53: Global Caviar Industry Revenue Million Forecast, by Form 2019 & 2032
- Table 54: Global Caviar Industry Revenue Million Forecast, by Sales Channel 2019 & 2032
- Table 55: Global Caviar Industry Revenue Million Forecast, by Country 2019 & 2032
- Table 56: China Caviar Industry Revenue (Million) Forecast, by Application 2019 & 2032
- Table 57: Japan Caviar Industry Revenue (Million) Forecast, by Application 2019 & 2032
- Table 58: India Caviar Industry Revenue (Million) Forecast, by Application 2019 & 2032
- Table 59: Australia Caviar Industry Revenue (Million) Forecast, by Application 2019 & 2032
- Table 60: Rest of Asia Pacific Caviar Industry Revenue (Million) Forecast, by Application 2019 & 2032
- Table 61: Global Caviar Industry Revenue Million Forecast, by Type 2019 & 2032
- Table 62: Global Caviar Industry Revenue Million Forecast, by Form 2019 & 2032
- Table 63: Global Caviar Industry Revenue Million Forecast, by Sales Channel 2019 & 2032
- Table 64: Global Caviar Industry Revenue Million Forecast, by Country 2019 & 2032
- Table 65: Brazil Caviar Industry Revenue (Million) Forecast, by Application 2019 & 2032
- Table 66: Argentina Caviar Industry Revenue (Million) Forecast, by Application 2019 & 2032
- Table 67: Rest of South America Caviar Industry Revenue (Million) Forecast, by Application 2019 & 2032
- Table 68: Global Caviar Industry Revenue Million Forecast, by Type 2019 & 2032
- Table 69: Global Caviar Industry Revenue Million Forecast, by Form 2019 & 2032
- Table 70: Global Caviar Industry Revenue Million Forecast, by Sales Channel 2019 & 2032
- Table 71: Global Caviar Industry Revenue Million Forecast, by Country 2019 & 2032
- Table 72: South Africa Caviar Industry Revenue (Million) Forecast, by Application 2019 & 2032
- Table 73: Saudi Arabia Caviar Industry Revenue (Million) Forecast, by Application 2019 & 2032
- Table 74: Rest of Middle East and Africa Caviar Industry Revenue (Million) Forecast, by Application 2019 & 2032
Frequently Asked Questions
1. What is the projected Compound Annual Growth Rate (CAGR) of the Caviar Industry?
The projected CAGR is approximately 7.96%.
2. Which companies are prominent players in the Caviar Industry?
Key companies in the market include JSC Russian caviar house, Sterling Caviar, Caviar Blanc, L'Osage Caviar Company Inc, The Caviar Co, Black River Caviar, Labeyrie Fine Food, Sepehr Dad Caviar GmbH, Caviar Creator Inc, Sasanian Caviar Inc.
3. What are the main segments of the Caviar Industry?
The market segments include Type, Form, Sales Channel.
4. Can you provide details about the market size?
The market size is estimated to be USD 372.99 Million as of 2022.
5. What are some drivers contributing to market growth?
Caviar's use in high-end cuisine and gourmet dining boosts its market presence.
6. What are the notable trends driving market growth?
Advances in aquaculture technology improve caviar quality and production efficiency.
7. Are there any restraints impacting market growth?
High price of caviar limits its market to premium segment.
8. Can you provide examples of recent developments in the market?
N/A
9. What pricing options are available for accessing the report?
Pricing options include single-user, multi-user, and enterprise licenses priced at USD 4750, USD 5250, and USD 8750 respectively.
10. Is the market size provided in terms of value or volume?
The market size is provided in terms of value, measured in Million.
11. Are there any specific market keywords associated with the report?
Yes, the market keyword associated with the report is "Caviar Industry," which aids in identifying and referencing the specific market segment covered.
12. How do I determine which pricing option suits my needs best?
The pricing options vary based on user requirements and access needs. Individual users may opt for single-user licenses, while businesses requiring broader access may choose multi-user or enterprise licenses for cost-effective access to the report.
13. Are there any additional resources or data provided in the Caviar Industry report?
While the report offers comprehensive insights, it's advisable to review the specific contents or supplementary materials provided to ascertain if additional resources or data are available.
14. How can I stay updated on further developments or reports in the Caviar Industry?
To stay informed about further developments, trends, and reports in the Caviar Industry, consider subscribing to industry newsletters, following relevant companies and organizations, or regularly checking reputable industry news sources and publications.
Methodology
Step 1 - Identification of Relevant Samples Size from Population Database


Step 2 - Approaches for Defining Global Market Size (Value, Volume* & Price*)

Note*: In applicable scenarios
Step 3 - Data Sources
Primary Research
- Web Analytics
- Survey Reports
- Research Institute
- Latest Research Reports
- Opinion Leaders
Secondary Research
- Annual Reports
- White Paper
- Latest Press Release
- Industry Association
- Paid Database
- Investor Presentations

Step 4 - Data Triangulation
Involves using different sources of information in order to increase the validity of a study
These sources are likely to be stakeholders in a program - participants, other researchers, program staff, other community members, and so on.
Then we put all data in single framework & apply various statistical tools to find out the dynamic on the market.
During the analysis stage, feedback from the stakeholder groups would be compared to determine areas of agreement as well as areas of divergence
