

Key Insights
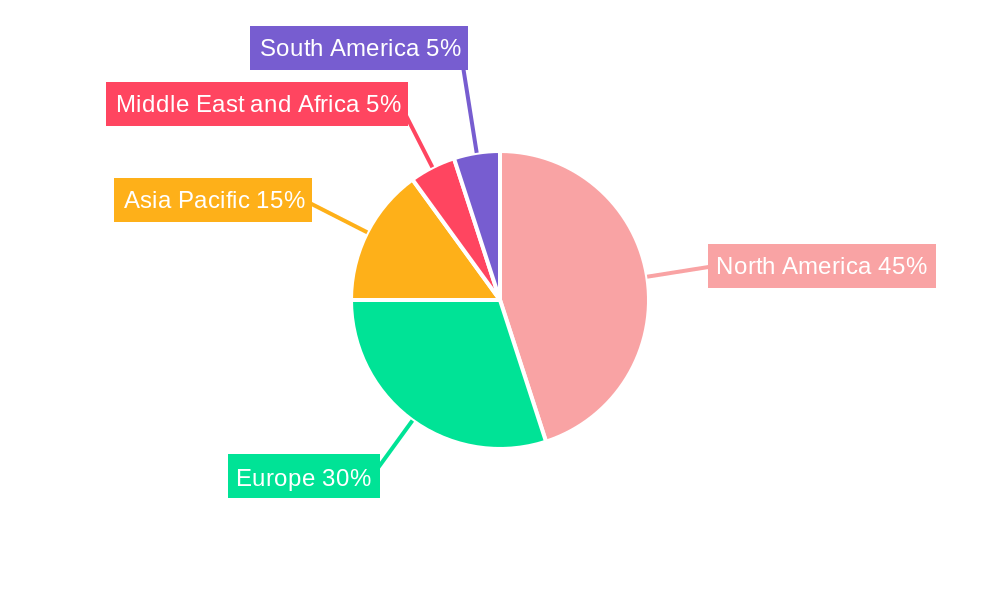
The global orthopedic regenerative surgical products market is experiencing robust growth, driven by an aging population, increasing prevalence of osteoarthritis and other degenerative joint diseases, and advancements in surgical techniques. The market's expansion is fueled by the rising demand for minimally invasive procedures, the growing preference for biologics over traditional synthetic implants, and a shift towards personalized medicine in orthopedic care. The market is segmented by product type (allograft, cell-based therapies, viscosupplements), application (orthopedic pain management, trauma repair, cartilage and tendon repair, joint reconstruction), and end-user (hospitals, ambulatory surgical centers). While all segments are contributing to growth, cell-based therapies and allografts are anticipated to witness significant expansion owing to their effectiveness in repairing damaged tissues and reducing recovery times. The North American region currently holds a dominant market share, owing to high healthcare expenditure, advanced medical infrastructure, and early adoption of innovative technologies. However, the Asia-Pacific region is projected to exhibit the fastest growth rate over the forecast period, driven by increasing disposable incomes, rising healthcare awareness, and expanding healthcare infrastructure in developing economies like India and China. Competition in this market is intense, with key players continually innovating to develop superior products and expand their market presence. The market is also witnessing an increasing number of strategic collaborations, mergers, and acquisitions aimed at accelerating product development and enhancing market reach.
The market's growth, however, is subject to certain restraints, including high product costs, stringent regulatory approvals, and potential risks associated with the use of biologics. Nonetheless, ongoing research and development efforts are focused on enhancing the efficacy and safety of these products, overcoming these challenges and driving further market expansion. The increasing focus on cost-effectiveness and the development of less invasive surgical techniques are also expected to contribute to market growth. Over the forecast period (2025-2033), the market is expected to maintain a healthy growth trajectory, driven by continuous innovation, improving healthcare infrastructure globally, and the growing awareness among patients regarding the benefits of regenerative therapies. The market is projected to benefit from the increasing adoption of advanced imaging techniques, leading to early disease detection and timely intervention.
Global Orthopedic Regenerative Surgical Products Market: A Comprehensive Report (2019-2033)
This dynamic report provides a detailed analysis of the global orthopedic regenerative surgical products market, offering invaluable insights for stakeholders across the medical device and healthcare sectors. With a comprehensive study period spanning 2019-2033 (base year 2025, forecast period 2025-2033), this report leverages rigorous data analysis and expert insights to uncover key trends, opportunities, and challenges within this rapidly evolving market. The report's value is enhanced through in-depth segment analysis (by product, application, and end-user), competitive landscape assessments, and future outlook projections.
Global Orthopedic Regenerative Surgical Products Market Market Structure & Competitive Landscape
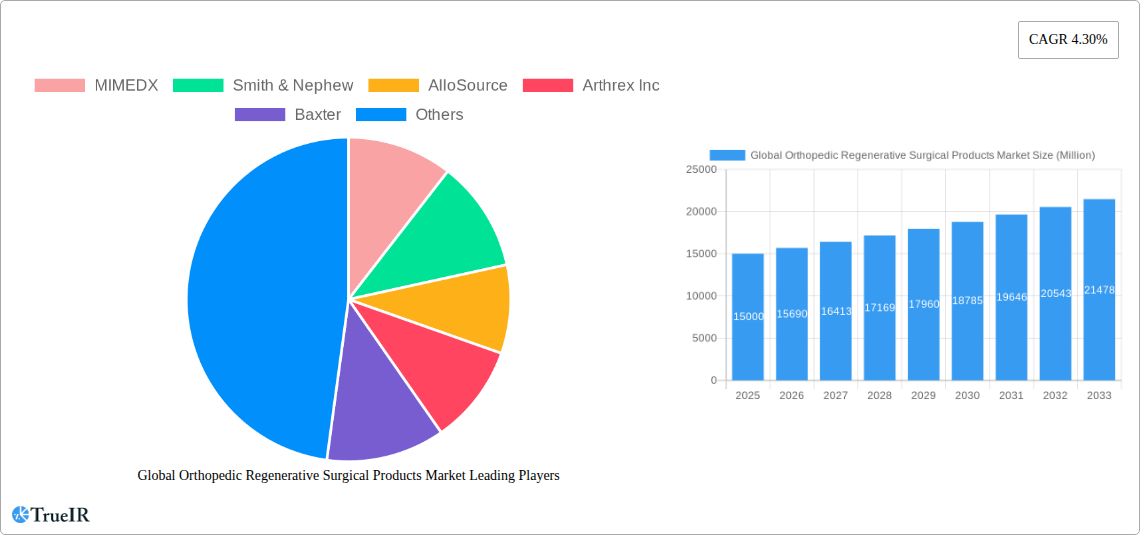
The global orthopedic regenerative surgical products market exhibits a moderately concentrated structure, with key players like MIMEDX, Smith & Nephew, AlloSource, Arthrex Inc, Baxter, Aptissen S.A, Stryker, Amniox Medical Inc, Anika Therapeutics Inc, Vericel Corporation, and Zimmer Biomet holding significant market share. The Herfindahl-Hirschman Index (HHI) is estimated at xx, indicating a moderately concentrated market.
- Innovation Drivers: The market is driven by continuous innovations in biomaterials, cell therapies, and minimally invasive surgical techniques. This includes the development of advanced allografts with enhanced biocompatibility, next-generation cell-based therapies, and sophisticated viscosupplements.
- Regulatory Impacts: Stringent regulatory approvals (e.g., FDA clearance for cell-based therapies) pose significant challenges but also ensure product safety and efficacy. Navigating these regulatory pathways influences market entry and growth strategies.
- Product Substitutes: Traditional surgical techniques and pharmacologic pain management pose competition to regenerative approaches. However, the increasing demand for less-invasive procedures and better long-term outcomes favors regenerative therapies.
- End-User Segmentation: Hospitals account for the largest end-user segment, followed by ambulatory surgical centers. The growing prevalence of ambulatory surgical procedures is expected to drive growth in this segment.
- M&A Trends: The market has witnessed several mergers and acquisitions in recent years, driven by companies aiming to expand their product portfolios and gain a competitive edge. The total M&A volume over the past five years is estimated at xx Million USD.
Global Orthopedic Regenerative Surgical Products Market Market Trends & Opportunities
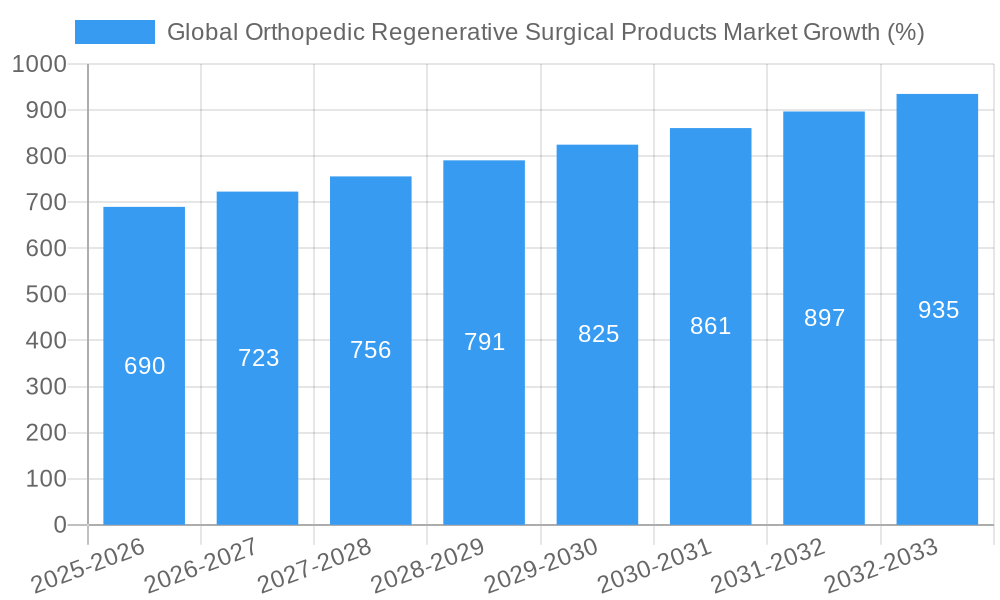
The global orthopedic regenerative surgical products market is experiencing robust growth, driven by several key factors. The market size is estimated at xx Million USD in 2025 and is projected to reach xx Million USD by 2033, exhibiting a Compound Annual Growth Rate (CAGR) of xx% during the forecast period. Several technological advancements, such as the development of 3D-printed scaffolds and personalized cell therapies, are reshaping the market landscape. Consumer preference is shifting toward minimally invasive, effective, and long-lasting solutions for orthopedic conditions. This has led to increased demand for regenerative therapies and a growing market penetration rate, currently at xx%. Increased prevalence of osteoarthritis and sports-related injuries further fuel market expansion. Intense competition among established players and emerging companies is leading to continuous innovation, product diversification, and strategic partnerships.
Dominant Markets & Segments in Global Orthopedic Regenerative Surgical Products Market
North America currently holds the largest market share, followed by Europe, primarily driven by high healthcare expenditure and the early adoption of advanced technologies. Within product segments, allografts dominate the market due to their established clinical use and relatively lower cost compared to cell-based therapies. However, the cell-based therapies segment exhibits high growth potential due to its superior therapeutic potential and ongoing research.
Key Growth Drivers:
- North America: High healthcare expenditure, advanced healthcare infrastructure, and early adoption of innovative technologies.
- Europe: Growing elderly population, increasing prevalence of orthopedic conditions, and supportive regulatory frameworks.
- Asia-Pacific: Rapidly developing healthcare infrastructure, rising disposable incomes, and increased awareness of orthopedic issues.
Dominant Segments:
- By Product: Allografts currently hold the largest market share, followed by viscosupplements and cell-based therapies. However, cell-based therapies are anticipated to register the fastest growth rate.
- By Application: Orthopedic pain management and cartilage and tendon repair constitute significant market segments, reflecting the high prevalence of these conditions. Joint reconstruction is another major application segment.
- By End-User: Hospitals remain the dominant end-user segment.
Global Orthopedic Regenerative Surgical Products Market Product Analysis
The orthopedic regenerative surgical products market features a diverse range of products catering to various orthopedic needs. Allografts provide readily available biological materials for tissue repair, while cell-based therapies offer the potential for greater tissue regeneration. Viscosupplements alleviate pain and improve joint function through lubrication. Continuous innovation focuses on enhancing biocompatibility, improving efficacy, and developing minimally invasive delivery methods. Competitive advantages are gained through superior product efficacy, cost-effectiveness, and broader applications. The market is witnessing a transition toward personalized medicine, with customized treatments tailored to individual patient needs.
Key Drivers, Barriers & Challenges in Global Orthopedic Regenerative Surgical Products Market
Key Drivers:
- The growing elderly population and associated rise in osteoarthritis prevalence are key drivers.
- Technological advancements resulting in safer and more effective treatments.
- Increasing demand for minimally invasive procedures.
- Favorable reimbursement policies in developed nations.
Challenges & Restraints:
- High cost of treatment restricts market penetration in developing nations.
- Strict regulatory frameworks and lengthy approval processes pose hurdles for new product launches. FDA approval for cell-based therapies, for example, is a major bottleneck.
- Potential variability in the quality and efficacy of allografts remains a concern.
- Intense competition among various product types and market participants. The market concentration ratio is moderately high suggesting a competitive environment.
Growth Drivers in the Global Orthopedic Regenerative Surgical Products Market Market
The market's growth is primarily propelled by the escalating prevalence of osteoarthritis and sports-related injuries. This coupled with technological advancements, like personalized medicine and 3D printing techniques creating improved products, stimulates growth. Furthermore, the rising geriatric population globally necessitates greater surgical options, boosting market demand. Lastly, expanding healthcare infrastructure, especially in emerging markets, opens avenues for market expansion.
Challenges Impacting Global Orthopedic Regenerative Surgical Products Market Growth
Significant challenges include the high cost associated with these treatments, limiting access for a large segment of the population. The stringent regulatory landscape for medical devices, including lengthy approval processes and demanding safety protocols, presents considerable hurdles. Moreover, the competitive landscape, characterized by both established players and emerging biotech companies, demands continuous innovation and efficient cost management to remain competitive.
Key Players Shaping the Global Orthopedic Regenerative Surgical Products Market Market
- MIMEDX
- Smith & Nephew
- AlloSource
- Arthrex Inc
- Baxter
- Aptissen S.A
- Stryker
- Amniox Medical Inc
- Anika Therapeutics Inc
- Vericel Corporation
- Zimmer Biomet
Significant Global Orthopedic Regenerative Surgical Products Market Industry Milestones
- 2020: FDA approves a novel cell-based therapy for cartilage repair.
- 2022: A major merger between two leading players expands the market's product portfolio.
- 2023: Several companies launch innovative biomaterials with enhanced biocompatibility and improved clinical outcomes.
Future Outlook for Global Orthopedic Regenerative Surgical Products Market Market
The global orthopedic regenerative surgical products market is poised for sustained growth, driven by technological advancements, expanding indications, and an aging population. The increasing focus on personalized medicine, the emergence of novel biomaterials, and improved access to these therapies in developing economies present significant strategic opportunities. The market is expected to experience substantial expansion, driven by increased adoption of minimally invasive procedures and enhanced treatment outcomes. New technologies and research and development efforts will ensure the ongoing development of safe and more effective therapies.
Global Orthopedic Regenerative Surgical Products Market Segmentation
-
1. Product
- 1.1. Allograft
- 1.2. Cell-based
- 1.3. Viscosupplements
-
2. Applications
- 2.1. Orthopedic Pain Management
- 2.2. Trauma Repair
- 2.3. Cartilage and Tendon Repair
- 2.4. Joint Reconstruction
- 2.5. Others
-
3. End-User
- 3.1. Hospitals
- 3.2. Ambulatory Surgical Centers
- 3.3. Others
Global Orthopedic Regenerative Surgical Products Market Segmentation By Geography
-
1. North America
- 1.1. United States
- 1.2. Canada
- 1.3. Mexico
-
2. Europe
- 2.1. Germany
- 2.2. United Kingdom
- 2.3. France
- 2.4. Italy
- 2.5. Spain
- 2.6. Rest of Europe
-
3. Asia Pacific
- 3.1. China
- 3.2. Japan
- 3.3. India
- 3.4. Australia
- 3.5. South Korea
- 3.6. Rest of Asia Pacific
-
4. Middle East and Africa
- 4.1. GCC
- 4.2. South Africa
- 4.3. Rest of Middle East and Africa
-
5. South America
- 5.1. Brazil
- 5.2. Argentina
- 5.3. Rest of South America
Global Orthopedic Regenerative Surgical Products Market REPORT HIGHLIGHTS
| Aspects | Details |
|---|---|
| Study Period | 2019-2033 |
| Base Year | 2024 |
| Estimated Year | 2025 |
| Forecast Period | 2025-2033 |
| Historical Period | 2019-2024 |
| Growth Rate | CAGR of 4.30% from 2019-2033 |
| Segmentation |
|
Table of Contents
- 1. Introduction
- 1.1. Research Scope
- 1.2. Market Segmentation
- 1.3. Research Methodology
- 1.4. Definitions and Assumptions
- 2. Executive Summary
- 2.1. Introduction
- 3. Market Dynamics
- 3.1. Introduction
- 3.2. Market Drivers
- 3.2.1. Rise in the Prevalence of Orthopedic Diseases; Increasing Geriatric Population; Technological Advancements in the Products
- 3.3. Market Restrains
- 3.3.1. High Cost of Products; Stringent Regulatory Scenario
- 3.4. Market Trends
- 3.4.1. Viscosupplements is Expected to Hold a Significant Share Over the Forecast Period
- 4. Market Factor Analysis
- 4.1. Porters Five Forces
- 4.2. Supply/Value Chain
- 4.3. PESTEL analysis
- 4.4. Market Entropy
- 4.5. Patent/Trademark Analysis
- 5. Global Orthopedic Regenerative Surgical Products Market Analysis, Insights and Forecast, 2019-2031
- 5.1. Market Analysis, Insights and Forecast - by Product
- 5.1.1. Allograft
- 5.1.2. Cell-based
- 5.1.3. Viscosupplements
- 5.2. Market Analysis, Insights and Forecast - by Applications
- 5.2.1. Orthopedic Pain Management
- 5.2.2. Trauma Repair
- 5.2.3. Cartilage and Tendon Repair
- 5.2.4. Joint Reconstruction
- 5.2.5. Others
- 5.3. Market Analysis, Insights and Forecast - by End-User
- 5.3.1. Hospitals
- 5.3.2. Ambulatory Surgical Centers
- 5.3.3. Others
- 5.4. Market Analysis, Insights and Forecast - by Region
- 5.4.1. North America
- 5.4.2. Europe
- 5.4.3. Asia Pacific
- 5.4.4. Middle East and Africa
- 5.4.5. South America
- 5.1. Market Analysis, Insights and Forecast - by Product
- 6. North America Global Orthopedic Regenerative Surgical Products Market Analysis, Insights and Forecast, 2019-2031
- 6.1. Market Analysis, Insights and Forecast - by Product
- 6.1.1. Allograft
- 6.1.2. Cell-based
- 6.1.3. Viscosupplements
- 6.2. Market Analysis, Insights and Forecast - by Applications
- 6.2.1. Orthopedic Pain Management
- 6.2.2. Trauma Repair
- 6.2.3. Cartilage and Tendon Repair
- 6.2.4. Joint Reconstruction
- 6.2.5. Others
- 6.3. Market Analysis, Insights and Forecast - by End-User
- 6.3.1. Hospitals
- 6.3.2. Ambulatory Surgical Centers
- 6.3.3. Others
- 6.1. Market Analysis, Insights and Forecast - by Product
- 7. Europe Global Orthopedic Regenerative Surgical Products Market Analysis, Insights and Forecast, 2019-2031
- 7.1. Market Analysis, Insights and Forecast - by Product
- 7.1.1. Allograft
- 7.1.2. Cell-based
- 7.1.3. Viscosupplements
- 7.2. Market Analysis, Insights and Forecast - by Applications
- 7.2.1. Orthopedic Pain Management
- 7.2.2. Trauma Repair
- 7.2.3. Cartilage and Tendon Repair
- 7.2.4. Joint Reconstruction
- 7.2.5. Others
- 7.3. Market Analysis, Insights and Forecast - by End-User
- 7.3.1. Hospitals
- 7.3.2. Ambulatory Surgical Centers
- 7.3.3. Others
- 7.1. Market Analysis, Insights and Forecast - by Product
- 8. Asia Pacific Global Orthopedic Regenerative Surgical Products Market Analysis, Insights and Forecast, 2019-2031
- 8.1. Market Analysis, Insights and Forecast - by Product
- 8.1.1. Allograft
- 8.1.2. Cell-based
- 8.1.3. Viscosupplements
- 8.2. Market Analysis, Insights and Forecast - by Applications
- 8.2.1. Orthopedic Pain Management
- 8.2.2. Trauma Repair
- 8.2.3. Cartilage and Tendon Repair
- 8.2.4. Joint Reconstruction
- 8.2.5. Others
- 8.3. Market Analysis, Insights and Forecast - by End-User
- 8.3.1. Hospitals
- 8.3.2. Ambulatory Surgical Centers
- 8.3.3. Others
- 8.1. Market Analysis, Insights and Forecast - by Product
- 9. Middle East and Africa Global Orthopedic Regenerative Surgical Products Market Analysis, Insights and Forecast, 2019-2031
- 9.1. Market Analysis, Insights and Forecast - by Product
- 9.1.1. Allograft
- 9.1.2. Cell-based
- 9.1.3. Viscosupplements
- 9.2. Market Analysis, Insights and Forecast - by Applications
- 9.2.1. Orthopedic Pain Management
- 9.2.2. Trauma Repair
- 9.2.3. Cartilage and Tendon Repair
- 9.2.4. Joint Reconstruction
- 9.2.5. Others
- 9.3. Market Analysis, Insights and Forecast - by End-User
- 9.3.1. Hospitals
- 9.3.2. Ambulatory Surgical Centers
- 9.3.3. Others
- 9.1. Market Analysis, Insights and Forecast - by Product
- 10. South America Global Orthopedic Regenerative Surgical Products Market Analysis, Insights and Forecast, 2019-2031
- 10.1. Market Analysis, Insights and Forecast - by Product
- 10.1.1. Allograft
- 10.1.2. Cell-based
- 10.1.3. Viscosupplements
- 10.2. Market Analysis, Insights and Forecast - by Applications
- 10.2.1. Orthopedic Pain Management
- 10.2.2. Trauma Repair
- 10.2.3. Cartilage and Tendon Repair
- 10.2.4. Joint Reconstruction
- 10.2.5. Others
- 10.3. Market Analysis, Insights and Forecast - by End-User
- 10.3.1. Hospitals
- 10.3.2. Ambulatory Surgical Centers
- 10.3.3. Others
- 10.1. Market Analysis, Insights and Forecast - by Product
- 11. North America Global Orthopedic Regenerative Surgical Products Market Analysis, Insights and Forecast, 2019-2031
- 11.1. Market Analysis, Insights and Forecast - By Country/Sub-region
- 11.1.1 United States
- 11.1.2 Canada
- 11.1.3 Mexico
- 12. Europe Global Orthopedic Regenerative Surgical Products Market Analysis, Insights and Forecast, 2019-2031
- 12.1. Market Analysis, Insights and Forecast - By Country/Sub-region
- 12.1.1 Germany
- 12.1.2 United Kingdom
- 12.1.3 France
- 12.1.4 Italy
- 12.1.5 Spain
- 12.1.6 Rest of Europe
- 13. Asia Pacific Global Orthopedic Regenerative Surgical Products Market Analysis, Insights and Forecast, 2019-2031
- 13.1. Market Analysis, Insights and Forecast - By Country/Sub-region
- 13.1.1 China
- 13.1.2 Japan
- 13.1.3 India
- 13.1.4 Australia
- 13.1.5 South Korea
- 13.1.6 Rest of Asia Pacific
- 14. Middle East and Africa Global Orthopedic Regenerative Surgical Products Market Analysis, Insights and Forecast, 2019-2031
- 14.1. Market Analysis, Insights and Forecast - By Country/Sub-region
- 14.1.1 GCC
- 14.1.2 South Africa
- 14.1.3 Rest of Middle East and Africa
- 15. South America Global Orthopedic Regenerative Surgical Products Market Analysis, Insights and Forecast, 2019-2031
- 15.1. Market Analysis, Insights and Forecast - By Country/Sub-region
- 15.1.1 Brazil
- 15.1.2 Argentina
- 15.1.3 Rest of South America
- 16. Competitive Analysis
- 16.1. Market Share Analysis 2024
- 16.2. Company Profiles
- 16.2.1 MIMEDX
- 16.2.1.1. Overview
- 16.2.1.2. Products
- 16.2.1.3. SWOT Analysis
- 16.2.1.4. Recent Developments
- 16.2.1.5. Financials (Based on Availability)
- 16.2.2 Smith & Nephew
- 16.2.2.1. Overview
- 16.2.2.2. Products
- 16.2.2.3. SWOT Analysis
- 16.2.2.4. Recent Developments
- 16.2.2.5. Financials (Based on Availability)
- 16.2.3 AlloSource
- 16.2.3.1. Overview
- 16.2.3.2. Products
- 16.2.3.3. SWOT Analysis
- 16.2.3.4. Recent Developments
- 16.2.3.5. Financials (Based on Availability)
- 16.2.4 Arthrex Inc
- 16.2.4.1. Overview
- 16.2.4.2. Products
- 16.2.4.3. SWOT Analysis
- 16.2.4.4. Recent Developments
- 16.2.4.5. Financials (Based on Availability)
- 16.2.5 Baxter
- 16.2.5.1. Overview
- 16.2.5.2. Products
- 16.2.5.3. SWOT Analysis
- 16.2.5.4. Recent Developments
- 16.2.5.5. Financials (Based on Availability)
- 16.2.6 Aptissen S A
- 16.2.6.1. Overview
- 16.2.6.2. Products
- 16.2.6.3. SWOT Analysis
- 16.2.6.4. Recent Developments
- 16.2.6.5. Financials (Based on Availability)
- 16.2.7 Stryker
- 16.2.7.1. Overview
- 16.2.7.2. Products
- 16.2.7.3. SWOT Analysis
- 16.2.7.4. Recent Developments
- 16.2.7.5. Financials (Based on Availability)
- 16.2.8 Amniox Medical Inc
- 16.2.8.1. Overview
- 16.2.8.2. Products
- 16.2.8.3. SWOT Analysis
- 16.2.8.4. Recent Developments
- 16.2.8.5. Financials (Based on Availability)
- 16.2.9 Anika Therapeutics Inc
- 16.2.9.1. Overview
- 16.2.9.2. Products
- 16.2.9.3. SWOT Analysis
- 16.2.9.4. Recent Developments
- 16.2.9.5. Financials (Based on Availability)
- 16.2.10 Vericel Corporation
- 16.2.10.1. Overview
- 16.2.10.2. Products
- 16.2.10.3. SWOT Analysis
- 16.2.10.4. Recent Developments
- 16.2.10.5. Financials (Based on Availability)
- 16.2.11 Zimmer Biomet
- 16.2.11.1. Overview
- 16.2.11.2. Products
- 16.2.11.3. SWOT Analysis
- 16.2.11.4. Recent Developments
- 16.2.11.5. Financials (Based on Availability)
- 16.2.1 MIMEDX
List of Figures
- Figure 1: Global Global Orthopedic Regenerative Surgical Products Market Revenue Breakdown (Million, %) by Region 2024 & 2032
- Figure 2: Global Global Orthopedic Regenerative Surgical Products Market Volume Breakdown (K Unit, %) by Region 2024 & 2032
- Figure 3: North America Global Orthopedic Regenerative Surgical Products Market Revenue (Million), by Country 2024 & 2032
- Figure 4: North America Global Orthopedic Regenerative Surgical Products Market Volume (K Unit), by Country 2024 & 2032
- Figure 5: North America Global Orthopedic Regenerative Surgical Products Market Revenue Share (%), by Country 2024 & 2032
- Figure 6: North America Global Orthopedic Regenerative Surgical Products Market Volume Share (%), by Country 2024 & 2032
- Figure 7: Europe Global Orthopedic Regenerative Surgical Products Market Revenue (Million), by Country 2024 & 2032
- Figure 8: Europe Global Orthopedic Regenerative Surgical Products Market Volume (K Unit), by Country 2024 & 2032
- Figure 9: Europe Global Orthopedic Regenerative Surgical Products Market Revenue Share (%), by Country 2024 & 2032
- Figure 10: Europe Global Orthopedic Regenerative Surgical Products Market Volume Share (%), by Country 2024 & 2032
- Figure 11: Asia Pacific Global Orthopedic Regenerative Surgical Products Market Revenue (Million), by Country 2024 & 2032
- Figure 12: Asia Pacific Global Orthopedic Regenerative Surgical Products Market Volume (K Unit), by Country 2024 & 2032
- Figure 13: Asia Pacific Global Orthopedic Regenerative Surgical Products Market Revenue Share (%), by Country 2024 & 2032
- Figure 14: Asia Pacific Global Orthopedic Regenerative Surgical Products Market Volume Share (%), by Country 2024 & 2032
- Figure 15: Middle East and Africa Global Orthopedic Regenerative Surgical Products Market Revenue (Million), by Country 2024 & 2032
- Figure 16: Middle East and Africa Global Orthopedic Regenerative Surgical Products Market Volume (K Unit), by Country 2024 & 2032
- Figure 17: Middle East and Africa Global Orthopedic Regenerative Surgical Products Market Revenue Share (%), by Country 2024 & 2032
- Figure 18: Middle East and Africa Global Orthopedic Regenerative Surgical Products Market Volume Share (%), by Country 2024 & 2032
- Figure 19: South America Global Orthopedic Regenerative Surgical Products Market Revenue (Million), by Country 2024 & 2032
- Figure 20: South America Global Orthopedic Regenerative Surgical Products Market Volume (K Unit), by Country 2024 & 2032
- Figure 21: South America Global Orthopedic Regenerative Surgical Products Market Revenue Share (%), by Country 2024 & 2032
- Figure 22: South America Global Orthopedic Regenerative Surgical Products Market Volume Share (%), by Country 2024 & 2032
- Figure 23: North America Global Orthopedic Regenerative Surgical Products Market Revenue (Million), by Product 2024 & 2032
- Figure 24: North America Global Orthopedic Regenerative Surgical Products Market Volume (K Unit), by Product 2024 & 2032
- Figure 25: North America Global Orthopedic Regenerative Surgical Products Market Revenue Share (%), by Product 2024 & 2032
- Figure 26: North America Global Orthopedic Regenerative Surgical Products Market Volume Share (%), by Product 2024 & 2032
- Figure 27: North America Global Orthopedic Regenerative Surgical Products Market Revenue (Million), by Applications 2024 & 2032
- Figure 28: North America Global Orthopedic Regenerative Surgical Products Market Volume (K Unit), by Applications 2024 & 2032
- Figure 29: North America Global Orthopedic Regenerative Surgical Products Market Revenue Share (%), by Applications 2024 & 2032
- Figure 30: North America Global Orthopedic Regenerative Surgical Products Market Volume Share (%), by Applications 2024 & 2032
- Figure 31: North America Global Orthopedic Regenerative Surgical Products Market Revenue (Million), by End-User 2024 & 2032
- Figure 32: North America Global Orthopedic Regenerative Surgical Products Market Volume (K Unit), by End-User 2024 & 2032
- Figure 33: North America Global Orthopedic Regenerative Surgical Products Market Revenue Share (%), by End-User 2024 & 2032
- Figure 34: North America Global Orthopedic Regenerative Surgical Products Market Volume Share (%), by End-User 2024 & 2032
- Figure 35: North America Global Orthopedic Regenerative Surgical Products Market Revenue (Million), by Country 2024 & 2032
- Figure 36: North America Global Orthopedic Regenerative Surgical Products Market Volume (K Unit), by Country 2024 & 2032
- Figure 37: North America Global Orthopedic Regenerative Surgical Products Market Revenue Share (%), by Country 2024 & 2032
- Figure 38: North America Global Orthopedic Regenerative Surgical Products Market Volume Share (%), by Country 2024 & 2032
- Figure 39: Europe Global Orthopedic Regenerative Surgical Products Market Revenue (Million), by Product 2024 & 2032
- Figure 40: Europe Global Orthopedic Regenerative Surgical Products Market Volume (K Unit), by Product 2024 & 2032
- Figure 41: Europe Global Orthopedic Regenerative Surgical Products Market Revenue Share (%), by Product 2024 & 2032
- Figure 42: Europe Global Orthopedic Regenerative Surgical Products Market Volume Share (%), by Product 2024 & 2032
- Figure 43: Europe Global Orthopedic Regenerative Surgical Products Market Revenue (Million), by Applications 2024 & 2032
- Figure 44: Europe Global Orthopedic Regenerative Surgical Products Market Volume (K Unit), by Applications 2024 & 2032
- Figure 45: Europe Global Orthopedic Regenerative Surgical Products Market Revenue Share (%), by Applications 2024 & 2032
- Figure 46: Europe Global Orthopedic Regenerative Surgical Products Market Volume Share (%), by Applications 2024 & 2032
- Figure 47: Europe Global Orthopedic Regenerative Surgical Products Market Revenue (Million), by End-User 2024 & 2032
- Figure 48: Europe Global Orthopedic Regenerative Surgical Products Market Volume (K Unit), by End-User 2024 & 2032
- Figure 49: Europe Global Orthopedic Regenerative Surgical Products Market Revenue Share (%), by End-User 2024 & 2032
- Figure 50: Europe Global Orthopedic Regenerative Surgical Products Market Volume Share (%), by End-User 2024 & 2032
- Figure 51: Europe Global Orthopedic Regenerative Surgical Products Market Revenue (Million), by Country 2024 & 2032
- Figure 52: Europe Global Orthopedic Regenerative Surgical Products Market Volume (K Unit), by Country 2024 & 2032
- Figure 53: Europe Global Orthopedic Regenerative Surgical Products Market Revenue Share (%), by Country 2024 & 2032
- Figure 54: Europe Global Orthopedic Regenerative Surgical Products Market Volume Share (%), by Country 2024 & 2032
- Figure 55: Asia Pacific Global Orthopedic Regenerative Surgical Products Market Revenue (Million), by Product 2024 & 2032
- Figure 56: Asia Pacific Global Orthopedic Regenerative Surgical Products Market Volume (K Unit), by Product 2024 & 2032
- Figure 57: Asia Pacific Global Orthopedic Regenerative Surgical Products Market Revenue Share (%), by Product 2024 & 2032
- Figure 58: Asia Pacific Global Orthopedic Regenerative Surgical Products Market Volume Share (%), by Product 2024 & 2032
- Figure 59: Asia Pacific Global Orthopedic Regenerative Surgical Products Market Revenue (Million), by Applications 2024 & 2032
- Figure 60: Asia Pacific Global Orthopedic Regenerative Surgical Products Market Volume (K Unit), by Applications 2024 & 2032
- Figure 61: Asia Pacific Global Orthopedic Regenerative Surgical Products Market Revenue Share (%), by Applications 2024 & 2032
- Figure 62: Asia Pacific Global Orthopedic Regenerative Surgical Products Market Volume Share (%), by Applications 2024 & 2032
- Figure 63: Asia Pacific Global Orthopedic Regenerative Surgical Products Market Revenue (Million), by End-User 2024 & 2032
- Figure 64: Asia Pacific Global Orthopedic Regenerative Surgical Products Market Volume (K Unit), by End-User 2024 & 2032
- Figure 65: Asia Pacific Global Orthopedic Regenerative Surgical Products Market Revenue Share (%), by End-User 2024 & 2032
- Figure 66: Asia Pacific Global Orthopedic Regenerative Surgical Products Market Volume Share (%), by End-User 2024 & 2032
- Figure 67: Asia Pacific Global Orthopedic Regenerative Surgical Products Market Revenue (Million), by Country 2024 & 2032
- Figure 68: Asia Pacific Global Orthopedic Regenerative Surgical Products Market Volume (K Unit), by Country 2024 & 2032
- Figure 69: Asia Pacific Global Orthopedic Regenerative Surgical Products Market Revenue Share (%), by Country 2024 & 2032
- Figure 70: Asia Pacific Global Orthopedic Regenerative Surgical Products Market Volume Share (%), by Country 2024 & 2032
- Figure 71: Middle East and Africa Global Orthopedic Regenerative Surgical Products Market Revenue (Million), by Product 2024 & 2032
- Figure 72: Middle East and Africa Global Orthopedic Regenerative Surgical Products Market Volume (K Unit), by Product 2024 & 2032
- Figure 73: Middle East and Africa Global Orthopedic Regenerative Surgical Products Market Revenue Share (%), by Product 2024 & 2032
- Figure 74: Middle East and Africa Global Orthopedic Regenerative Surgical Products Market Volume Share (%), by Product 2024 & 2032
- Figure 75: Middle East and Africa Global Orthopedic Regenerative Surgical Products Market Revenue (Million), by Applications 2024 & 2032
- Figure 76: Middle East and Africa Global Orthopedic Regenerative Surgical Products Market Volume (K Unit), by Applications 2024 & 2032
- Figure 77: Middle East and Africa Global Orthopedic Regenerative Surgical Products Market Revenue Share (%), by Applications 2024 & 2032
- Figure 78: Middle East and Africa Global Orthopedic Regenerative Surgical Products Market Volume Share (%), by Applications 2024 & 2032
- Figure 79: Middle East and Africa Global Orthopedic Regenerative Surgical Products Market Revenue (Million), by End-User 2024 & 2032
- Figure 80: Middle East and Africa Global Orthopedic Regenerative Surgical Products Market Volume (K Unit), by End-User 2024 & 2032
- Figure 81: Middle East and Africa Global Orthopedic Regenerative Surgical Products Market Revenue Share (%), by End-User 2024 & 2032
- Figure 82: Middle East and Africa Global Orthopedic Regenerative Surgical Products Market Volume Share (%), by End-User 2024 & 2032
- Figure 83: Middle East and Africa Global Orthopedic Regenerative Surgical Products Market Revenue (Million), by Country 2024 & 2032
- Figure 84: Middle East and Africa Global Orthopedic Regenerative Surgical Products Market Volume (K Unit), by Country 2024 & 2032
- Figure 85: Middle East and Africa Global Orthopedic Regenerative Surgical Products Market Revenue Share (%), by Country 2024 & 2032
- Figure 86: Middle East and Africa Global Orthopedic Regenerative Surgical Products Market Volume Share (%), by Country 2024 & 2032
- Figure 87: South America Global Orthopedic Regenerative Surgical Products Market Revenue (Million), by Product 2024 & 2032
- Figure 88: South America Global Orthopedic Regenerative Surgical Products Market Volume (K Unit), by Product 2024 & 2032
- Figure 89: South America Global Orthopedic Regenerative Surgical Products Market Revenue Share (%), by Product 2024 & 2032
- Figure 90: South America Global Orthopedic Regenerative Surgical Products Market Volume Share (%), by Product 2024 & 2032
- Figure 91: South America Global Orthopedic Regenerative Surgical Products Market Revenue (Million), by Applications 2024 & 2032
- Figure 92: South America Global Orthopedic Regenerative Surgical Products Market Volume (K Unit), by Applications 2024 & 2032
- Figure 93: South America Global Orthopedic Regenerative Surgical Products Market Revenue Share (%), by Applications 2024 & 2032
- Figure 94: South America Global Orthopedic Regenerative Surgical Products Market Volume Share (%), by Applications 2024 & 2032
- Figure 95: South America Global Orthopedic Regenerative Surgical Products Market Revenue (Million), by End-User 2024 & 2032
- Figure 96: South America Global Orthopedic Regenerative Surgical Products Market Volume (K Unit), by End-User 2024 & 2032
- Figure 97: South America Global Orthopedic Regenerative Surgical Products Market Revenue Share (%), by End-User 2024 & 2032
- Figure 98: South America Global Orthopedic Regenerative Surgical Products Market Volume Share (%), by End-User 2024 & 2032
- Figure 99: South America Global Orthopedic Regenerative Surgical Products Market Revenue (Million), by Country 2024 & 2032
- Figure 100: South America Global Orthopedic Regenerative Surgical Products Market Volume (K Unit), by Country 2024 & 2032
- Figure 101: South America Global Orthopedic Regenerative Surgical Products Market Revenue Share (%), by Country 2024 & 2032
- Figure 102: South America Global Orthopedic Regenerative Surgical Products Market Volume Share (%), by Country 2024 & 2032
List of Tables
- Table 1: Global Orthopedic Regenerative Surgical Products Market Revenue Million Forecast, by Region 2019 & 2032
- Table 2: Global Orthopedic Regenerative Surgical Products Market Volume K Unit Forecast, by Region 2019 & 2032
- Table 3: Global Orthopedic Regenerative Surgical Products Market Revenue Million Forecast, by Product 2019 & 2032
- Table 4: Global Orthopedic Regenerative Surgical Products Market Volume K Unit Forecast, by Product 2019 & 2032
- Table 5: Global Orthopedic Regenerative Surgical Products Market Revenue Million Forecast, by Applications 2019 & 2032
- Table 6: Global Orthopedic Regenerative Surgical Products Market Volume K Unit Forecast, by Applications 2019 & 2032
- Table 7: Global Orthopedic Regenerative Surgical Products Market Revenue Million Forecast, by End-User 2019 & 2032
- Table 8: Global Orthopedic Regenerative Surgical Products Market Volume K Unit Forecast, by End-User 2019 & 2032
- Table 9: Global Orthopedic Regenerative Surgical Products Market Revenue Million Forecast, by Region 2019 & 2032
- Table 10: Global Orthopedic Regenerative Surgical Products Market Volume K Unit Forecast, by Region 2019 & 2032
- Table 11: Global Orthopedic Regenerative Surgical Products Market Revenue Million Forecast, by Country 2019 & 2032
- Table 12: Global Orthopedic Regenerative Surgical Products Market Volume K Unit Forecast, by Country 2019 & 2032
- Table 13: United States Global Orthopedic Regenerative Surgical Products Market Revenue (Million) Forecast, by Application 2019 & 2032
- Table 14: United States Global Orthopedic Regenerative Surgical Products Market Volume (K Unit) Forecast, by Application 2019 & 2032
- Table 15: Canada Global Orthopedic Regenerative Surgical Products Market Revenue (Million) Forecast, by Application 2019 & 2032
- Table 16: Canada Global Orthopedic Regenerative Surgical Products Market Volume (K Unit) Forecast, by Application 2019 & 2032
- Table 17: Mexico Global Orthopedic Regenerative Surgical Products Market Revenue (Million) Forecast, by Application 2019 & 2032
- Table 18: Mexico Global Orthopedic Regenerative Surgical Products Market Volume (K Unit) Forecast, by Application 2019 & 2032
- Table 19: Global Orthopedic Regenerative Surgical Products Market Revenue Million Forecast, by Country 2019 & 2032
- Table 20: Global Orthopedic Regenerative Surgical Products Market Volume K Unit Forecast, by Country 2019 & 2032
- Table 21: Germany Global Orthopedic Regenerative Surgical Products Market Revenue (Million) Forecast, by Application 2019 & 2032
- Table 22: Germany Global Orthopedic Regenerative Surgical Products Market Volume (K Unit) Forecast, by Application 2019 & 2032
- Table 23: United Kingdom Global Orthopedic Regenerative Surgical Products Market Revenue (Million) Forecast, by Application 2019 & 2032
- Table 24: United Kingdom Global Orthopedic Regenerative Surgical Products Market Volume (K Unit) Forecast, by Application 2019 & 2032
- Table 25: France Global Orthopedic Regenerative Surgical Products Market Revenue (Million) Forecast, by Application 2019 & 2032
- Table 26: France Global Orthopedic Regenerative Surgical Products Market Volume (K Unit) Forecast, by Application 2019 & 2032
- Table 27: Italy Global Orthopedic Regenerative Surgical Products Market Revenue (Million) Forecast, by Application 2019 & 2032
- Table 28: Italy Global Orthopedic Regenerative Surgical Products Market Volume (K Unit) Forecast, by Application 2019 & 2032
- Table 29: Spain Global Orthopedic Regenerative Surgical Products Market Revenue (Million) Forecast, by Application 2019 & 2032
- Table 30: Spain Global Orthopedic Regenerative Surgical Products Market Volume (K Unit) Forecast, by Application 2019 & 2032
- Table 31: Rest of Europe Global Orthopedic Regenerative Surgical Products Market Revenue (Million) Forecast, by Application 2019 & 2032
- Table 32: Rest of Europe Global Orthopedic Regenerative Surgical Products Market Volume (K Unit) Forecast, by Application 2019 & 2032
- Table 33: Global Orthopedic Regenerative Surgical Products Market Revenue Million Forecast, by Country 2019 & 2032
- Table 34: Global Orthopedic Regenerative Surgical Products Market Volume K Unit Forecast, by Country 2019 & 2032
- Table 35: China Global Orthopedic Regenerative Surgical Products Market Revenue (Million) Forecast, by Application 2019 & 2032
- Table 36: China Global Orthopedic Regenerative Surgical Products Market Volume (K Unit) Forecast, by Application 2019 & 2032
- Table 37: Japan Global Orthopedic Regenerative Surgical Products Market Revenue (Million) Forecast, by Application 2019 & 2032
- Table 38: Japan Global Orthopedic Regenerative Surgical Products Market Volume (K Unit) Forecast, by Application 2019 & 2032
- Table 39: India Global Orthopedic Regenerative Surgical Products Market Revenue (Million) Forecast, by Application 2019 & 2032
- Table 40: India Global Orthopedic Regenerative Surgical Products Market Volume (K Unit) Forecast, by Application 2019 & 2032
- Table 41: Australia Global Orthopedic Regenerative Surgical Products Market Revenue (Million) Forecast, by Application 2019 & 2032
- Table 42: Australia Global Orthopedic Regenerative Surgical Products Market Volume (K Unit) Forecast, by Application 2019 & 2032
- Table 43: South Korea Global Orthopedic Regenerative Surgical Products Market Revenue (Million) Forecast, by Application 2019 & 2032
- Table 44: South Korea Global Orthopedic Regenerative Surgical Products Market Volume (K Unit) Forecast, by Application 2019 & 2032
- Table 45: Rest of Asia Pacific Global Orthopedic Regenerative Surgical Products Market Revenue (Million) Forecast, by Application 2019 & 2032
- Table 46: Rest of Asia Pacific Global Orthopedic Regenerative Surgical Products Market Volume (K Unit) Forecast, by Application 2019 & 2032
- Table 47: Global Orthopedic Regenerative Surgical Products Market Revenue Million Forecast, by Country 2019 & 2032
- Table 48: Global Orthopedic Regenerative Surgical Products Market Volume K Unit Forecast, by Country 2019 & 2032
- Table 49: GCC Global Orthopedic Regenerative Surgical Products Market Revenue (Million) Forecast, by Application 2019 & 2032
- Table 50: GCC Global Orthopedic Regenerative Surgical Products Market Volume (K Unit) Forecast, by Application 2019 & 2032
- Table 51: South Africa Global Orthopedic Regenerative Surgical Products Market Revenue (Million) Forecast, by Application 2019 & 2032
- Table 52: South Africa Global Orthopedic Regenerative Surgical Products Market Volume (K Unit) Forecast, by Application 2019 & 2032
- Table 53: Rest of Middle East and Africa Global Orthopedic Regenerative Surgical Products Market Revenue (Million) Forecast, by Application 2019 & 2032
- Table 54: Rest of Middle East and Africa Global Orthopedic Regenerative Surgical Products Market Volume (K Unit) Forecast, by Application 2019 & 2032
- Table 55: Global Orthopedic Regenerative Surgical Products Market Revenue Million Forecast, by Country 2019 & 2032
- Table 56: Global Orthopedic Regenerative Surgical Products Market Volume K Unit Forecast, by Country 2019 & 2032
- Table 57: Brazil Global Orthopedic Regenerative Surgical Products Market Revenue (Million) Forecast, by Application 2019 & 2032
- Table 58: Brazil Global Orthopedic Regenerative Surgical Products Market Volume (K Unit) Forecast, by Application 2019 & 2032
- Table 59: Argentina Global Orthopedic Regenerative Surgical Products Market Revenue (Million) Forecast, by Application 2019 & 2032
- Table 60: Argentina Global Orthopedic Regenerative Surgical Products Market Volume (K Unit) Forecast, by Application 2019 & 2032
- Table 61: Rest of South America Global Orthopedic Regenerative Surgical Products Market Revenue (Million) Forecast, by Application 2019 & 2032
- Table 62: Rest of South America Global Orthopedic Regenerative Surgical Products Market Volume (K Unit) Forecast, by Application 2019 & 2032
- Table 63: Global Orthopedic Regenerative Surgical Products Market Revenue Million Forecast, by Product 2019 & 2032
- Table 64: Global Orthopedic Regenerative Surgical Products Market Volume K Unit Forecast, by Product 2019 & 2032
- Table 65: Global Orthopedic Regenerative Surgical Products Market Revenue Million Forecast, by Applications 2019 & 2032
- Table 66: Global Orthopedic Regenerative Surgical Products Market Volume K Unit Forecast, by Applications 2019 & 2032
- Table 67: Global Orthopedic Regenerative Surgical Products Market Revenue Million Forecast, by End-User 2019 & 2032
- Table 68: Global Orthopedic Regenerative Surgical Products Market Volume K Unit Forecast, by End-User 2019 & 2032
- Table 69: Global Orthopedic Regenerative Surgical Products Market Revenue Million Forecast, by Country 2019 & 2032
- Table 70: Global Orthopedic Regenerative Surgical Products Market Volume K Unit Forecast, by Country 2019 & 2032
- Table 71: United States Global Orthopedic Regenerative Surgical Products Market Revenue (Million) Forecast, by Application 2019 & 2032
- Table 72: United States Global Orthopedic Regenerative Surgical Products Market Volume (K Unit) Forecast, by Application 2019 & 2032
- Table 73: Canada Global Orthopedic Regenerative Surgical Products Market Revenue (Million) Forecast, by Application 2019 & 2032
- Table 74: Canada Global Orthopedic Regenerative Surgical Products Market Volume (K Unit) Forecast, by Application 2019 & 2032
- Table 75: Mexico Global Orthopedic Regenerative Surgical Products Market Revenue (Million) Forecast, by Application 2019 & 2032
- Table 76: Mexico Global Orthopedic Regenerative Surgical Products Market Volume (K Unit) Forecast, by Application 2019 & 2032
- Table 77: Global Orthopedic Regenerative Surgical Products Market Revenue Million Forecast, by Product 2019 & 2032
- Table 78: Global Orthopedic Regenerative Surgical Products Market Volume K Unit Forecast, by Product 2019 & 2032
- Table 79: Global Orthopedic Regenerative Surgical Products Market Revenue Million Forecast, by Applications 2019 & 2032
- Table 80: Global Orthopedic Regenerative Surgical Products Market Volume K Unit Forecast, by Applications 2019 & 2032
- Table 81: Global Orthopedic Regenerative Surgical Products Market Revenue Million Forecast, by End-User 2019 & 2032
- Table 82: Global Orthopedic Regenerative Surgical Products Market Volume K Unit Forecast, by End-User 2019 & 2032
- Table 83: Global Orthopedic Regenerative Surgical Products Market Revenue Million Forecast, by Country 2019 & 2032
- Table 84: Global Orthopedic Regenerative Surgical Products Market Volume K Unit Forecast, by Country 2019 & 2032
- Table 85: Germany Global Orthopedic Regenerative Surgical Products Market Revenue (Million) Forecast, by Application 2019 & 2032
- Table 86: Germany Global Orthopedic Regenerative Surgical Products Market Volume (K Unit) Forecast, by Application 2019 & 2032
- Table 87: United Kingdom Global Orthopedic Regenerative Surgical Products Market Revenue (Million) Forecast, by Application 2019 & 2032
- Table 88: United Kingdom Global Orthopedic Regenerative Surgical Products Market Volume (K Unit) Forecast, by Application 2019 & 2032
- Table 89: France Global Orthopedic Regenerative Surgical Products Market Revenue (Million) Forecast, by Application 2019 & 2032
- Table 90: France Global Orthopedic Regenerative Surgical Products Market Volume (K Unit) Forecast, by Application 2019 & 2032
- Table 91: Italy Global Orthopedic Regenerative Surgical Products Market Revenue (Million) Forecast, by Application 2019 & 2032
- Table 92: Italy Global Orthopedic Regenerative Surgical Products Market Volume (K Unit) Forecast, by Application 2019 & 2032
- Table 93: Spain Global Orthopedic Regenerative Surgical Products Market Revenue (Million) Forecast, by Application 2019 & 2032
- Table 94: Spain Global Orthopedic Regenerative Surgical Products Market Volume (K Unit) Forecast, by Application 2019 & 2032
- Table 95: Rest of Europe Global Orthopedic Regenerative Surgical Products Market Revenue (Million) Forecast, by Application 2019 & 2032
- Table 96: Rest of Europe Global Orthopedic Regenerative Surgical Products Market Volume (K Unit) Forecast, by Application 2019 & 2032
- Table 97: Global Orthopedic Regenerative Surgical Products Market Revenue Million Forecast, by Product 2019 & 2032
- Table 98: Global Orthopedic Regenerative Surgical Products Market Volume K Unit Forecast, by Product 2019 & 2032
- Table 99: Global Orthopedic Regenerative Surgical Products Market Revenue Million Forecast, by Applications 2019 & 2032
- Table 100: Global Orthopedic Regenerative Surgical Products Market Volume K Unit Forecast, by Applications 2019 & 2032
- Table 101: Global Orthopedic Regenerative Surgical Products Market Revenue Million Forecast, by End-User 2019 & 2032
- Table 102: Global Orthopedic Regenerative Surgical Products Market Volume K Unit Forecast, by End-User 2019 & 2032
- Table 103: Global Orthopedic Regenerative Surgical Products Market Revenue Million Forecast, by Country 2019 & 2032
- Table 104: Global Orthopedic Regenerative Surgical Products Market Volume K Unit Forecast, by Country 2019 & 2032
- Table 105: China Global Orthopedic Regenerative Surgical Products Market Revenue (Million) Forecast, by Application 2019 & 2032
- Table 106: China Global Orthopedic Regenerative Surgical Products Market Volume (K Unit) Forecast, by Application 2019 & 2032
- Table 107: Japan Global Orthopedic Regenerative Surgical Products Market Revenue (Million) Forecast, by Application 2019 & 2032
- Table 108: Japan Global Orthopedic Regenerative Surgical Products Market Volume (K Unit) Forecast, by Application 2019 & 2032
- Table 109: India Global Orthopedic Regenerative Surgical Products Market Revenue (Million) Forecast, by Application 2019 & 2032
- Table 110: India Global Orthopedic Regenerative Surgical Products Market Volume (K Unit) Forecast, by Application 2019 & 2032
- Table 111: Australia Global Orthopedic Regenerative Surgical Products Market Revenue (Million) Forecast, by Application 2019 & 2032
- Table 112: Australia Global Orthopedic Regenerative Surgical Products Market Volume (K Unit) Forecast, by Application 2019 & 2032
- Table 113: South Korea Global Orthopedic Regenerative Surgical Products Market Revenue (Million) Forecast, by Application 2019 & 2032
- Table 114: South Korea Global Orthopedic Regenerative Surgical Products Market Volume (K Unit) Forecast, by Application 2019 & 2032
- Table 115: Rest of Asia Pacific Global Orthopedic Regenerative Surgical Products Market Revenue (Million) Forecast, by Application 2019 & 2032
- Table 116: Rest of Asia Pacific Global Orthopedic Regenerative Surgical Products Market Volume (K Unit) Forecast, by Application 2019 & 2032
- Table 117: Global Orthopedic Regenerative Surgical Products Market Revenue Million Forecast, by Product 2019 & 2032
- Table 118: Global Orthopedic Regenerative Surgical Products Market Volume K Unit Forecast, by Product 2019 & 2032
- Table 119: Global Orthopedic Regenerative Surgical Products Market Revenue Million Forecast, by Applications 2019 & 2032
- Table 120: Global Orthopedic Regenerative Surgical Products Market Volume K Unit Forecast, by Applications 2019 & 2032
- Table 121: Global Orthopedic Regenerative Surgical Products Market Revenue Million Forecast, by End-User 2019 & 2032
- Table 122: Global Orthopedic Regenerative Surgical Products Market Volume K Unit Forecast, by End-User 2019 & 2032
- Table 123: Global Orthopedic Regenerative Surgical Products Market Revenue Million Forecast, by Country 2019 & 2032
- Table 124: Global Orthopedic Regenerative Surgical Products Market Volume K Unit Forecast, by Country 2019 & 2032
- Table 125: GCC Global Orthopedic Regenerative Surgical Products Market Revenue (Million) Forecast, by Application 2019 & 2032
- Table 126: GCC Global Orthopedic Regenerative Surgical Products Market Volume (K Unit) Forecast, by Application 2019 & 2032
- Table 127: South Africa Global Orthopedic Regenerative Surgical Products Market Revenue (Million) Forecast, by Application 2019 & 2032
- Table 128: South Africa Global Orthopedic Regenerative Surgical Products Market Volume (K Unit) Forecast, by Application 2019 & 2032
- Table 129: Rest of Middle East and Africa Global Orthopedic Regenerative Surgical Products Market Revenue (Million) Forecast, by Application 2019 & 2032
- Table 130: Rest of Middle East and Africa Global Orthopedic Regenerative Surgical Products Market Volume (K Unit) Forecast, by Application 2019 & 2032
- Table 131: Global Orthopedic Regenerative Surgical Products Market Revenue Million Forecast, by Product 2019 & 2032
- Table 132: Global Orthopedic Regenerative Surgical Products Market Volume K Unit Forecast, by Product 2019 & 2032
- Table 133: Global Orthopedic Regenerative Surgical Products Market Revenue Million Forecast, by Applications 2019 & 2032
- Table 134: Global Orthopedic Regenerative Surgical Products Market Volume K Unit Forecast, by Applications 2019 & 2032
- Table 135: Global Orthopedic Regenerative Surgical Products Market Revenue Million Forecast, by End-User 2019 & 2032
- Table 136: Global Orthopedic Regenerative Surgical Products Market Volume K Unit Forecast, by End-User 2019 & 2032
- Table 137: Global Orthopedic Regenerative Surgical Products Market Revenue Million Forecast, by Country 2019 & 2032
- Table 138: Global Orthopedic Regenerative Surgical Products Market Volume K Unit Forecast, by Country 2019 & 2032
- Table 139: Brazil Global Orthopedic Regenerative Surgical Products Market Revenue (Million) Forecast, by Application 2019 & 2032
- Table 140: Brazil Global Orthopedic Regenerative Surgical Products Market Volume (K Unit) Forecast, by Application 2019 & 2032
- Table 141: Argentina Global Orthopedic Regenerative Surgical Products Market Revenue (Million) Forecast, by Application 2019 & 2032
- Table 142: Argentina Global Orthopedic Regenerative Surgical Products Market Volume (K Unit) Forecast, by Application 2019 & 2032
- Table 143: Rest of South America Global Orthopedic Regenerative Surgical Products Market Revenue (Million) Forecast, by Application 2019 & 2032
- Table 144: Rest of South America Global Orthopedic Regenerative Surgical Products Market Volume (K Unit) Forecast, by Application 2019 & 2032
Frequently Asked Questions
1. What is the projected Compound Annual Growth Rate (CAGR) of the Global Orthopedic Regenerative Surgical Products Market?
The projected CAGR is approximately 4.30%.
2. Which companies are prominent players in the Global Orthopedic Regenerative Surgical Products Market?
Key companies in the market include MIMEDX, Smith & Nephew, AlloSource, Arthrex Inc , Baxter, Aptissen S A, Stryker, Amniox Medical Inc, Anika Therapeutics Inc, Vericel Corporation, Zimmer Biomet.
3. What are the main segments of the Global Orthopedic Regenerative Surgical Products Market?
The market segments include Product, Applications, End-User.
4. Can you provide details about the market size?
The market size is estimated to be USD XX Million as of 2022.
5. What are some drivers contributing to market growth?
Rise in the Prevalence of Orthopedic Diseases; Increasing Geriatric Population; Technological Advancements in the Products.
6. What are the notable trends driving market growth?
Viscosupplements is Expected to Hold a Significant Share Over the Forecast Period.
7. Are there any restraints impacting market growth?
High Cost of Products; Stringent Regulatory Scenario.
8. Can you provide examples of recent developments in the market?
N/A
9. What pricing options are available for accessing the report?
Pricing options include single-user, multi-user, and enterprise licenses priced at USD 4750, USD 5250, and USD 8750 respectively.
10. Is the market size provided in terms of value or volume?
The market size is provided in terms of value, measured in Million and volume, measured in K Unit.
11. Are there any specific market keywords associated with the report?
Yes, the market keyword associated with the report is "Global Orthopedic Regenerative Surgical Products Market," which aids in identifying and referencing the specific market segment covered.
12. How do I determine which pricing option suits my needs best?
The pricing options vary based on user requirements and access needs. Individual users may opt for single-user licenses, while businesses requiring broader access may choose multi-user or enterprise licenses for cost-effective access to the report.
13. Are there any additional resources or data provided in the Global Orthopedic Regenerative Surgical Products Market report?
While the report offers comprehensive insights, it's advisable to review the specific contents or supplementary materials provided to ascertain if additional resources or data are available.
14. How can I stay updated on further developments or reports in the Global Orthopedic Regenerative Surgical Products Market?
To stay informed about further developments, trends, and reports in the Global Orthopedic Regenerative Surgical Products Market, consider subscribing to industry newsletters, following relevant companies and organizations, or regularly checking reputable industry news sources and publications.
Methodology
Step 1 - Identification of Relevant Samples Size from Population Database


Step 2 - Approaches for Defining Global Market Size (Value, Volume* & Price*)

Note*: In applicable scenarios
Step 3 - Data Sources
Primary Research
- Web Analytics
- Survey Reports
- Research Institute
- Latest Research Reports
- Opinion Leaders
Secondary Research
- Annual Reports
- White Paper
- Latest Press Release
- Industry Association
- Paid Database
- Investor Presentations

Step 4 - Data Triangulation
Involves using different sources of information in order to increase the validity of a study
These sources are likely to be stakeholders in a program - participants, other researchers, program staff, other community members, and so on.
Then we put all data in single framework & apply various statistical tools to find out the dynamic on the market.
During the analysis stage, feedback from the stakeholder groups would be compared to determine areas of agreement as well as areas of divergence
