

Key Insights
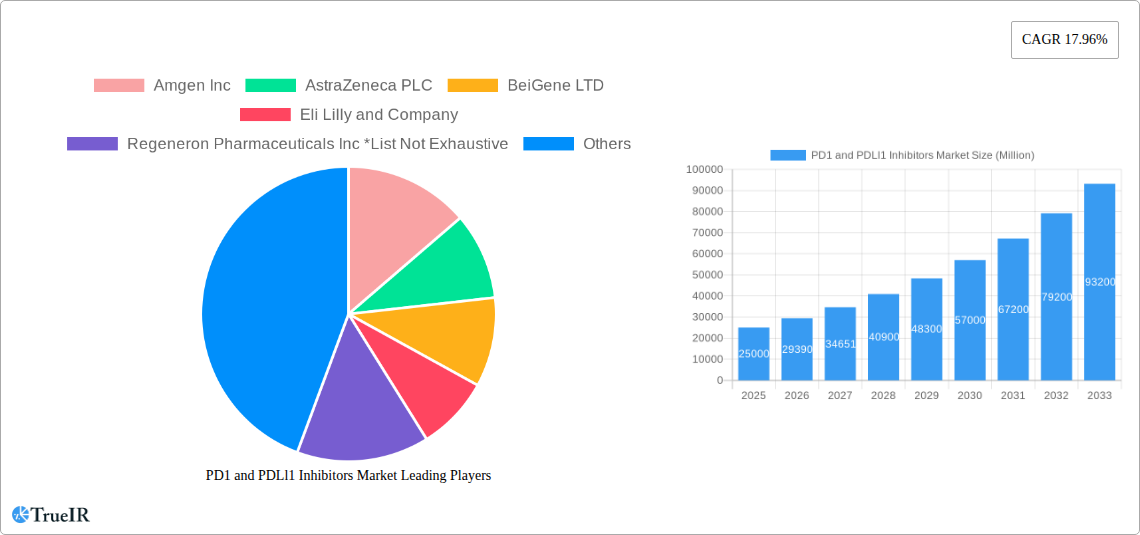
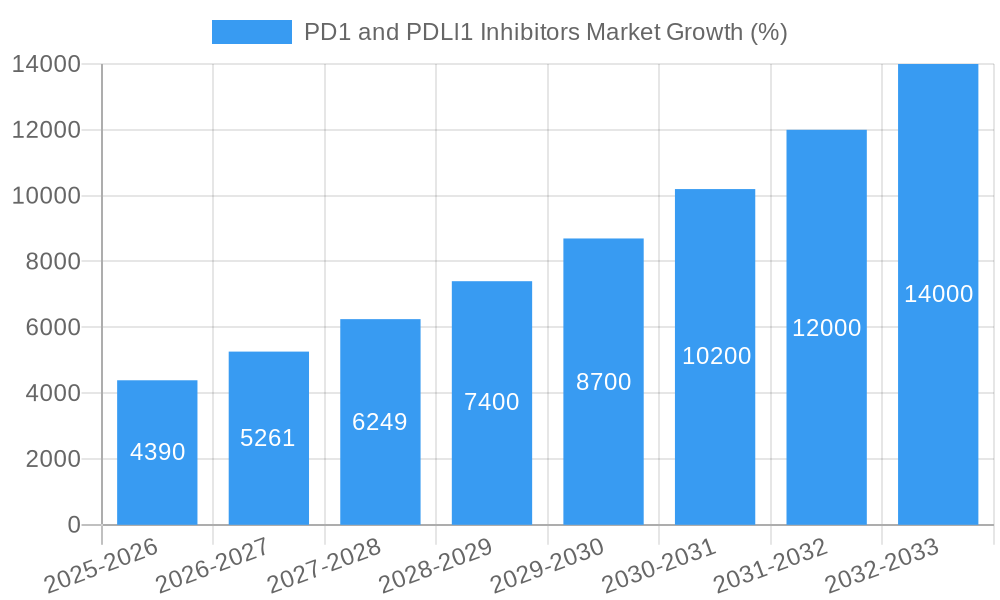
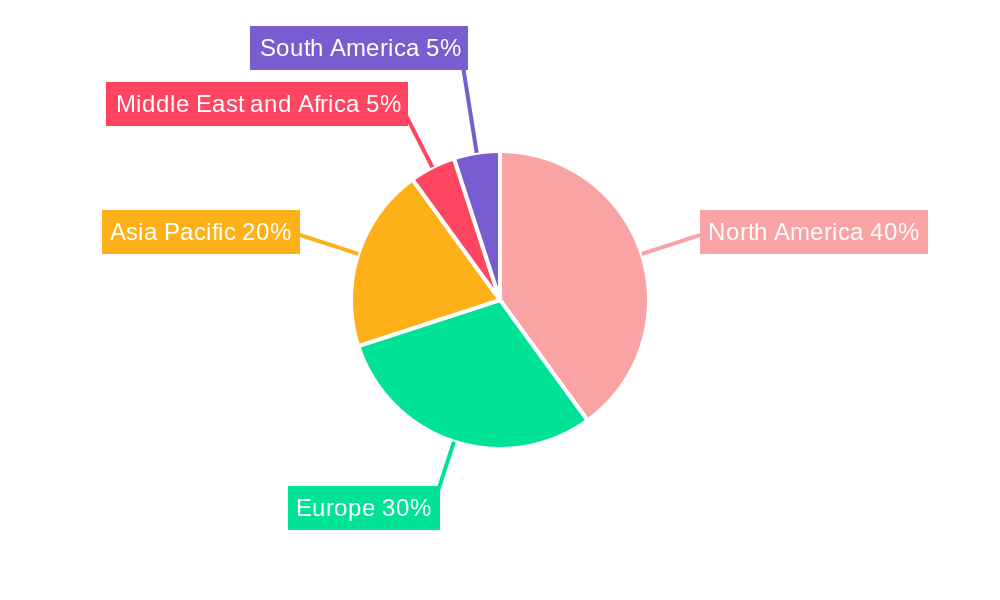
The PD-1 and PD-L1 inhibitors market is experiencing robust growth, driven by the rising incidence of cancers like melanoma, non-small cell lung cancer, and Hodgkin lymphoma, coupled with the increasing efficacy and approval of these targeted therapies. The market's Compound Annual Growth Rate (CAGR) of 17.96% from 2019 to 2024 suggests a significant expansion, projected to continue through 2033. This growth is fueled by several factors: a deeper understanding of the PD-1/PD-L1 pathway in cancer immunotherapy, ongoing clinical trials exploring new applications and combinations, and the increasing availability of these therapies in various healthcare settings, including hospital and retail pharmacies as well as online channels. The North American market currently holds a substantial share, benefiting from advanced healthcare infrastructure and higher per capita healthcare spending. However, the Asia-Pacific region is expected to witness the fastest growth rate due to rising cancer prevalence, increasing healthcare expenditure, and growing awareness of advanced treatment options. Competitive dynamics are intense, with major pharmaceutical companies like Bristol-Myers Squibb, Merck, Roche, and Pfizer leading the market, continuously investing in research and development to expand their product portfolios and enhance their market position. Challenges include the high cost of treatment, potential side effects, and the need for personalized medicine approaches to optimize treatment outcomes for individual patients.
The segmentation of the market by inhibitor type (PD-1 and PD-L1), cancer type, and distribution channel provides valuable insights into market dynamics. The PD-1 inhibitors segment is currently larger, but the PD-L1 inhibitors segment is expected to experience faster growth owing to ongoing research and development efforts. Melanoma, non-small cell lung cancer, and kidney cancer are significant application areas, each exhibiting unique growth trajectories based on disease prevalence and treatment response. Hospital pharmacies dominate the distribution channel currently, yet the growth of online pharmacies is expected to increase due to convenience and accessibility. Further expansion of the market will be influenced by the development of biosimilars, the exploration of combination therapies with other immunotherapies and chemotherapeutics, and the ongoing research into biomarkers to predict treatment response and reduce adverse effects. Continued focus on patient access and affordability is crucial for maximizing the benefits of these life-saving therapies.
PD1 and PDL1 Inhibitors Market: A Comprehensive Report (2019-2033)
This dynamic report provides a thorough analysis of the PD1 and PDL1 inhibitors market, offering invaluable insights for stakeholders across the pharmaceutical and healthcare industries. Leveraging extensive market research and data analysis from 2019-2024 (historical period), with a base year of 2025 and forecast period spanning 2025-2033, this report illuminates current market dynamics and future growth projections. The study period covers 2019-2033. Key companies analyzed include Amgen Inc, AstraZeneca PLC, BeiGene LTD, Eli Lilly and Company, Regeneron Pharmaceuticals Inc, F Hoffmann-La Roche AG, Merck & Co, Bristol-Myers Squibb Company, GlaxoSmithKline PLC, and Pfizer Inc. (List not exhaustive).
PD1 and PDL1 Inhibitors Market Market Structure & Competitive Landscape
The PD1 and PDL1 inhibitors market exhibits a moderately concentrated structure, with a few major players holding significant market share. The Herfindahl-Hirschman Index (HHI) is estimated at xx, indicating a moderately consolidated market. Innovation is a key driver, fueled by ongoing research into novel drug mechanisms and combination therapies. Regulatory approvals and pricing policies significantly impact market access and profitability. The market witnesses considerable M&A activity as larger companies acquire smaller biotech firms with promising pipeline assets. The estimated volume of M&A deals in the past five years was xx Million. Substitutes, such as chemotherapy and radiation therapy, still exist but the efficacy of PD1/PDL1 inhibitors in specific cancer types is driving market growth.
- Market Concentration: Moderately concentrated, with HHI estimated at xx.
- Innovation Drivers: Research into novel drug mechanisms, combination therapies.
- Regulatory Impacts: Approvals, pricing policies significantly affect market access.
- Product Substitutes: Chemotherapy, radiation therapy – however, PD1/PDL1 inhibitors offer superior efficacy in specific cases.
- End-User Segmentation: Oncology clinics, hospitals, specialized cancer centers.
- M&A Trends: High volume of M&A activity (xx Million in past five years).
PD1 and PDL1 Inhibitors Market Market Trends & Opportunities
The global PD1 and PDL1 inhibitors market is experiencing robust growth, driven by an increasing prevalence of cancer, rising awareness of targeted therapies, and continuous technological advancements. The market is expected to witness a Compound Annual Growth Rate (CAGR) of xx% during the forecast period (2025-2033), reaching a value of xx Million by 2033. This growth is propelled by factors including the increasing approval of new PD1/PDL1 inhibitors for various cancers, the growing adoption of immunotherapy, and increasing investment in research and development within this sector. Market penetration rates for PD1/PDL1 inhibitors vary significantly by cancer type and geographic region, with higher rates observed in developed countries with advanced healthcare infrastructure. The emergence of biosimilars is expected to further shape market competition and affordability in the coming years. Technological advancements, including personalized medicine approaches and combination therapies, are creating new opportunities for growth and improved patient outcomes. Competitive dynamics are intensified by the entry of new players and the development of innovative products.
Dominant Markets & Segments in PD1 and PDL1 Inhibitors Market
The North American region holds the largest market share, driven by high healthcare expenditure, early adoption of innovative therapies, and a relatively high prevalence of cancer. Within applications, Non-small cell lung cancer (NSCLC) and melanoma represent the largest segments due to significant treatment success with PD1/PDL1 inhibitors. Hospital pharmacies constitute the primary distribution channel owing to the complex administration and monitoring of these therapies.
- Leading Region: North America
- Leading Application: Non-small cell lung cancer (NSCLC) and melanoma
- Leading Distribution Channel: Hospital Pharmacies
Key Growth Drivers:
- High prevalence of cancer: Particularly NSCLC and melanoma.
- Advanced healthcare infrastructure: Enabling faster adoption of new therapies.
- Favorable regulatory environment: Expediting approvals of new drugs.
- Increased government and private investment in R&D.
PD1 and PDL1 Inhibitors Market Product Analysis
The market features a diverse range of PD-1 and PD-L1 inhibitors, each with unique characteristics and applications. Significant advancements include improved drug delivery systems, combination therapies, and personalized medicine approaches tailoring treatment to specific patient genetic profiles. Competition is driven by factors such as efficacy, safety profile, and pricing. Technological advancements such as targeted drug delivery and improved bioconjugates improve treatment success and minimize side effects. The market fit for these products is largely determined by their efficacy in treating specific cancer types and their relative safety and tolerability profiles.
Key Drivers, Barriers & Challenges in PD1 and PDL1 Inhibitors Market
Key Drivers:
- Rising cancer incidence.
- Technological advancements (combination therapies, improved drug delivery).
- Increasing R&D investment.
- Favorable regulatory environments.
Challenges and Restraints:
- High cost of treatment.
- Potential for adverse events (immuno-related adverse events).
- Complex regulatory approval processes.
- Supply chain challenges (particularly for raw materials).
- Competition from existing and emerging therapies.
Growth Drivers in the PD1 and PDLl1 Inhibitors Market Market
The key drivers mirror those discussed above. Rising cancer rates, particularly in developing nations, alongside continued innovation in drug development will fuel the growth of this market. Governmental initiatives supporting research and development and wider insurance coverage will further accelerate adoption.
Challenges Impacting PD1 and PDLl1 Inhibitors Market Growth
High drug costs present a significant barrier, limiting accessibility in low- and middle-income countries. The complex regulatory landscape, including the need for stringent clinical trials, poses a significant hurdle to market entry for new products. Furthermore, competition from other cancer therapies and the emergence of biosimilars will continue to intensify.
Key Players Shaping the PD1 and PDLl1 Inhibitors Market Market
- Amgen Inc
- AstraZeneca PLC
- BeiGene LTD
- Eli Lilly and Company
- Regeneron Pharmaceuticals Inc
- F Hoffmann-La Roche AG
- Merck & Co
- Bristol-Myers Squibb Company
- GlaxoSmithKline PLC
- Pfizer Inc
Significant PD1 and PDLl1 Inhibitors Market Industry Milestones
- January 2023: The FDA approved KEYTRUDA (pembrolizumab) as adjuvant treatment for Stage IB, II, or IIIA Non-Small Cell Lung Cancer (NSCLC) following surgical resection and platinum-based chemotherapy. This broadened the application of pembrolizumab, significantly impacting market growth.
- March 2023: Ono Pharmaceutical Co., Ltd. received supplemental approval for Opdivo (nivolumab) in Japan for neoadjuvant treatment of NSCLC in combination with chemotherapy. This approval extended the use of Opdivo to an earlier stage of treatment, potentially increasing its market share in Japan.
Future Outlook for PD1 and PDLl1 Inhibitors Market Market
The PD1 and PDL1 inhibitors market is poised for continued growth, driven by the factors outlined above. Strategic opportunities exist in developing novel combination therapies, expanding applications to additional cancer types, and focusing on personalized medicine approaches. The market holds substantial potential for further innovation and expansion, particularly in emerging economies where cancer rates are rising and access to advanced therapies is increasing.
PD1 and PDLl1 Inhibitors Market Segmentation
-
1. Type of Inhibitors
- 1.1. PD-1 Inhibitors
- 1.2. PD-L1 Inhibitors
-
2. Application
- 2.1. Hodgkin Lymphoma
- 2.2. Kidney Cancer
- 2.3. Melanoma
- 2.4. Non-small Cell Lung Cancer
- 2.5. Other Applications
-
3. Distribution Channel
- 3.1. Hospital Pharmacies
- 3.2. Retail Pharmacies
- 3.3. Online Pharmacies
PD1 and PDLl1 Inhibitors Market Segmentation By Geography
-
1. North America
- 1.1. United states
- 1.2. Canada
- 1.3. Mexico
-
2. Europe
- 2.1. Germany
- 2.2. United Kingdom
- 2.3. France
- 2.4. Italy
- 2.5. Spain
- 2.6. Rest of Europe
-
3. Asia Pacific
- 3.1. China
- 3.2. Japan
- 3.3. India
- 3.4. Australia
- 3.5. South Korea
- 3.6. Rest of Asia Pacific
-
4. Middle East and Africa
- 4.1. GCC
- 4.2. South Africa
- 4.3. Rest of Middle East and Africa
-
5. South America
- 5.1. Brazil
- 5.2. Argentina
- 5.3. Rest of South America
PD1 and PDLl1 Inhibitors Market REPORT HIGHLIGHTS
| Aspects | Details |
|---|---|
| Study Period | 2019-2033 |
| Base Year | 2024 |
| Estimated Year | 2025 |
| Forecast Period | 2025-2033 |
| Historical Period | 2019-2024 |
| Growth Rate | CAGR of 17.96% from 2019-2033 |
| Segmentation |
|
Table of Contents
- 1. Introduction
- 1.1. Research Scope
- 1.2. Market Segmentation
- 1.3. Research Methodology
- 1.4. Definitions and Assumptions
- 2. Executive Summary
- 2.1. Introduction
- 3. Market Dynamics
- 3.1. Introduction
- 3.2. Market Drivers
- 3.2.1. Rising Investments in R&D and Clinical Trials by Bio-pharmaceutical Industries; Increased Encouragement Initiatives by the Regulatory Authorities with Favorable Approvals and Special Designations; Growing Burden of Different Cancers
- 3.3. Market Restrains
- 3.3.1. Risk of Complications Associated with the Highly Expensive Oncology Treatment; Challenges in Development with Uncertainty in Regulatory Process and High Costs of Tedious Clinical Trials
- 3.4. Market Trends
- 3.4.1. PD-1 Inhibitors Segment is Expected to Witness Significant Growth Over the Forecast Period
- 4. Market Factor Analysis
- 4.1. Porters Five Forces
- 4.2. Supply/Value Chain
- 4.3. PESTEL analysis
- 4.4. Market Entropy
- 4.5. Patent/Trademark Analysis
- 5. Global PD1 and PDLl1 Inhibitors Market Analysis, Insights and Forecast, 2019-2031
- 5.1. Market Analysis, Insights and Forecast - by Type of Inhibitors
- 5.1.1. PD-1 Inhibitors
- 5.1.2. PD-L1 Inhibitors
- 5.2. Market Analysis, Insights and Forecast - by Application
- 5.2.1. Hodgkin Lymphoma
- 5.2.2. Kidney Cancer
- 5.2.3. Melanoma
- 5.2.4. Non-small Cell Lung Cancer
- 5.2.5. Other Applications
- 5.3. Market Analysis, Insights and Forecast - by Distribution Channel
- 5.3.1. Hospital Pharmacies
- 5.3.2. Retail Pharmacies
- 5.3.3. Online Pharmacies
- 5.4. Market Analysis, Insights and Forecast - by Region
- 5.4.1. North America
- 5.4.2. Europe
- 5.4.3. Asia Pacific
- 5.4.4. Middle East and Africa
- 5.4.5. South America
- 5.1. Market Analysis, Insights and Forecast - by Type of Inhibitors
- 6. North America PD1 and PDLl1 Inhibitors Market Analysis, Insights and Forecast, 2019-2031
- 6.1. Market Analysis, Insights and Forecast - by Type of Inhibitors
- 6.1.1. PD-1 Inhibitors
- 6.1.2. PD-L1 Inhibitors
- 6.2. Market Analysis, Insights and Forecast - by Application
- 6.2.1. Hodgkin Lymphoma
- 6.2.2. Kidney Cancer
- 6.2.3. Melanoma
- 6.2.4. Non-small Cell Lung Cancer
- 6.2.5. Other Applications
- 6.3. Market Analysis, Insights and Forecast - by Distribution Channel
- 6.3.1. Hospital Pharmacies
- 6.3.2. Retail Pharmacies
- 6.3.3. Online Pharmacies
- 6.1. Market Analysis, Insights and Forecast - by Type of Inhibitors
- 7. Europe PD1 and PDLl1 Inhibitors Market Analysis, Insights and Forecast, 2019-2031
- 7.1. Market Analysis, Insights and Forecast - by Type of Inhibitors
- 7.1.1. PD-1 Inhibitors
- 7.1.2. PD-L1 Inhibitors
- 7.2. Market Analysis, Insights and Forecast - by Application
- 7.2.1. Hodgkin Lymphoma
- 7.2.2. Kidney Cancer
- 7.2.3. Melanoma
- 7.2.4. Non-small Cell Lung Cancer
- 7.2.5. Other Applications
- 7.3. Market Analysis, Insights and Forecast - by Distribution Channel
- 7.3.1. Hospital Pharmacies
- 7.3.2. Retail Pharmacies
- 7.3.3. Online Pharmacies
- 7.1. Market Analysis, Insights and Forecast - by Type of Inhibitors
- 8. Asia Pacific PD1 and PDLl1 Inhibitors Market Analysis, Insights and Forecast, 2019-2031
- 8.1. Market Analysis, Insights and Forecast - by Type of Inhibitors
- 8.1.1. PD-1 Inhibitors
- 8.1.2. PD-L1 Inhibitors
- 8.2. Market Analysis, Insights and Forecast - by Application
- 8.2.1. Hodgkin Lymphoma
- 8.2.2. Kidney Cancer
- 8.2.3. Melanoma
- 8.2.4. Non-small Cell Lung Cancer
- 8.2.5. Other Applications
- 8.3. Market Analysis, Insights and Forecast - by Distribution Channel
- 8.3.1. Hospital Pharmacies
- 8.3.2. Retail Pharmacies
- 8.3.3. Online Pharmacies
- 8.1. Market Analysis, Insights and Forecast - by Type of Inhibitors
- 9. Middle East and Africa PD1 and PDLl1 Inhibitors Market Analysis, Insights and Forecast, 2019-2031
- 9.1. Market Analysis, Insights and Forecast - by Type of Inhibitors
- 9.1.1. PD-1 Inhibitors
- 9.1.2. PD-L1 Inhibitors
- 9.2. Market Analysis, Insights and Forecast - by Application
- 9.2.1. Hodgkin Lymphoma
- 9.2.2. Kidney Cancer
- 9.2.3. Melanoma
- 9.2.4. Non-small Cell Lung Cancer
- 9.2.5. Other Applications
- 9.3. Market Analysis, Insights and Forecast - by Distribution Channel
- 9.3.1. Hospital Pharmacies
- 9.3.2. Retail Pharmacies
- 9.3.3. Online Pharmacies
- 9.1. Market Analysis, Insights and Forecast - by Type of Inhibitors
- 10. South America PD1 and PDLl1 Inhibitors Market Analysis, Insights and Forecast, 2019-2031
- 10.1. Market Analysis, Insights and Forecast - by Type of Inhibitors
- 10.1.1. PD-1 Inhibitors
- 10.1.2. PD-L1 Inhibitors
- 10.2. Market Analysis, Insights and Forecast - by Application
- 10.2.1. Hodgkin Lymphoma
- 10.2.2. Kidney Cancer
- 10.2.3. Melanoma
- 10.2.4. Non-small Cell Lung Cancer
- 10.2.5. Other Applications
- 10.3. Market Analysis, Insights and Forecast - by Distribution Channel
- 10.3.1. Hospital Pharmacies
- 10.3.2. Retail Pharmacies
- 10.3.3. Online Pharmacies
- 10.1. Market Analysis, Insights and Forecast - by Type of Inhibitors
- 11. North America PD1 and PDLl1 Inhibitors Market Analysis, Insights and Forecast, 2019-2031
- 11.1. Market Analysis, Insights and Forecast - By Country/Sub-region
- 11.1.1 United states
- 11.1.2 Canada
- 11.1.3 Mexico
- 12. Europe PD1 and PDLl1 Inhibitors Market Analysis, Insights and Forecast, 2019-2031
- 12.1. Market Analysis, Insights and Forecast - By Country/Sub-region
- 12.1.1 Germany
- 12.1.2 United Kingdom
- 12.1.3 France
- 12.1.4 Italy
- 12.1.5 Spain
- 12.1.6 Rest of Europe
- 13. Asia Pacific PD1 and PDLl1 Inhibitors Market Analysis, Insights and Forecast, 2019-2031
- 13.1. Market Analysis, Insights and Forecast - By Country/Sub-region
- 13.1.1 China
- 13.1.2 Japan
- 13.1.3 India
- 13.1.4 Australia
- 13.1.5 South Korea
- 13.1.6 Rest of Asia Pacific
- 14. Middle East and Africa PD1 and PDLl1 Inhibitors Market Analysis, Insights and Forecast, 2019-2031
- 14.1. Market Analysis, Insights and Forecast - By Country/Sub-region
- 14.1.1 GCC
- 14.1.2 South Africa
- 14.1.3 Rest of Middle East and Africa
- 15. South America PD1 and PDLl1 Inhibitors Market Analysis, Insights and Forecast, 2019-2031
- 15.1. Market Analysis, Insights and Forecast - By Country/Sub-region
- 15.1.1 Brazil
- 15.1.2 Argentina
- 15.1.3 Rest of South America
- 16. Competitive Analysis
- 16.1. Global Market Share Analysis 2024
- 16.2. Company Profiles
- 16.2.1 Amgen Inc
- 16.2.1.1. Overview
- 16.2.1.2. Products
- 16.2.1.3. SWOT Analysis
- 16.2.1.4. Recent Developments
- 16.2.1.5. Financials (Based on Availability)
- 16.2.2 AstraZeneca PLC
- 16.2.2.1. Overview
- 16.2.2.2. Products
- 16.2.2.3. SWOT Analysis
- 16.2.2.4. Recent Developments
- 16.2.2.5. Financials (Based on Availability)
- 16.2.3 BeiGene LTD
- 16.2.3.1. Overview
- 16.2.3.2. Products
- 16.2.3.3. SWOT Analysis
- 16.2.3.4. Recent Developments
- 16.2.3.5. Financials (Based on Availability)
- 16.2.4 Eli Lilly and Company
- 16.2.4.1. Overview
- 16.2.4.2. Products
- 16.2.4.3. SWOT Analysis
- 16.2.4.4. Recent Developments
- 16.2.4.5. Financials (Based on Availability)
- 16.2.5 Regeneron Pharmaceuticals Inc *List Not Exhaustive
- 16.2.5.1. Overview
- 16.2.5.2. Products
- 16.2.5.3. SWOT Analysis
- 16.2.5.4. Recent Developments
- 16.2.5.5. Financials (Based on Availability)
- 16.2.6 F Hoffmann-La Roche AG
- 16.2.6.1. Overview
- 16.2.6.2. Products
- 16.2.6.3. SWOT Analysis
- 16.2.6.4. Recent Developments
- 16.2.6.5. Financials (Based on Availability)
- 16.2.7 Merck & Co
- 16.2.7.1. Overview
- 16.2.7.2. Products
- 16.2.7.3. SWOT Analysis
- 16.2.7.4. Recent Developments
- 16.2.7.5. Financials (Based on Availability)
- 16.2.8 Bristol-Myers Squibb Company
- 16.2.8.1. Overview
- 16.2.8.2. Products
- 16.2.8.3. SWOT Analysis
- 16.2.8.4. Recent Developments
- 16.2.8.5. Financials (Based on Availability)
- 16.2.9 GlaxoSmithKline PLC
- 16.2.9.1. Overview
- 16.2.9.2. Products
- 16.2.9.3. SWOT Analysis
- 16.2.9.4. Recent Developments
- 16.2.9.5. Financials (Based on Availability)
- 16.2.10 Pfizer Inc
- 16.2.10.1. Overview
- 16.2.10.2. Products
- 16.2.10.3. SWOT Analysis
- 16.2.10.4. Recent Developments
- 16.2.10.5. Financials (Based on Availability)
- 16.2.1 Amgen Inc
List of Figures
- Figure 1: Global PD1 and PDLl1 Inhibitors Market Revenue Breakdown (Million, %) by Region 2024 & 2032
- Figure 2: North America PD1 and PDLl1 Inhibitors Market Revenue (Million), by Country 2024 & 2032
- Figure 3: North America PD1 and PDLl1 Inhibitors Market Revenue Share (%), by Country 2024 & 2032
- Figure 4: Europe PD1 and PDLl1 Inhibitors Market Revenue (Million), by Country 2024 & 2032
- Figure 5: Europe PD1 and PDLl1 Inhibitors Market Revenue Share (%), by Country 2024 & 2032
- Figure 6: Asia Pacific PD1 and PDLl1 Inhibitors Market Revenue (Million), by Country 2024 & 2032
- Figure 7: Asia Pacific PD1 and PDLl1 Inhibitors Market Revenue Share (%), by Country 2024 & 2032
- Figure 8: Middle East and Africa PD1 and PDLl1 Inhibitors Market Revenue (Million), by Country 2024 & 2032
- Figure 9: Middle East and Africa PD1 and PDLl1 Inhibitors Market Revenue Share (%), by Country 2024 & 2032
- Figure 10: South America PD1 and PDLl1 Inhibitors Market Revenue (Million), by Country 2024 & 2032
- Figure 11: South America PD1 and PDLl1 Inhibitors Market Revenue Share (%), by Country 2024 & 2032
- Figure 12: North America PD1 and PDLl1 Inhibitors Market Revenue (Million), by Type of Inhibitors 2024 & 2032
- Figure 13: North America PD1 and PDLl1 Inhibitors Market Revenue Share (%), by Type of Inhibitors 2024 & 2032
- Figure 14: North America PD1 and PDLl1 Inhibitors Market Revenue (Million), by Application 2024 & 2032
- Figure 15: North America PD1 and PDLl1 Inhibitors Market Revenue Share (%), by Application 2024 & 2032
- Figure 16: North America PD1 and PDLl1 Inhibitors Market Revenue (Million), by Distribution Channel 2024 & 2032
- Figure 17: North America PD1 and PDLl1 Inhibitors Market Revenue Share (%), by Distribution Channel 2024 & 2032
- Figure 18: North America PD1 and PDLl1 Inhibitors Market Revenue (Million), by Country 2024 & 2032
- Figure 19: North America PD1 and PDLl1 Inhibitors Market Revenue Share (%), by Country 2024 & 2032
- Figure 20: Europe PD1 and PDLl1 Inhibitors Market Revenue (Million), by Type of Inhibitors 2024 & 2032
- Figure 21: Europe PD1 and PDLl1 Inhibitors Market Revenue Share (%), by Type of Inhibitors 2024 & 2032
- Figure 22: Europe PD1 and PDLl1 Inhibitors Market Revenue (Million), by Application 2024 & 2032
- Figure 23: Europe PD1 and PDLl1 Inhibitors Market Revenue Share (%), by Application 2024 & 2032
- Figure 24: Europe PD1 and PDLl1 Inhibitors Market Revenue (Million), by Distribution Channel 2024 & 2032
- Figure 25: Europe PD1 and PDLl1 Inhibitors Market Revenue Share (%), by Distribution Channel 2024 & 2032
- Figure 26: Europe PD1 and PDLl1 Inhibitors Market Revenue (Million), by Country 2024 & 2032
- Figure 27: Europe PD1 and PDLl1 Inhibitors Market Revenue Share (%), by Country 2024 & 2032
- Figure 28: Asia Pacific PD1 and PDLl1 Inhibitors Market Revenue (Million), by Type of Inhibitors 2024 & 2032
- Figure 29: Asia Pacific PD1 and PDLl1 Inhibitors Market Revenue Share (%), by Type of Inhibitors 2024 & 2032
- Figure 30: Asia Pacific PD1 and PDLl1 Inhibitors Market Revenue (Million), by Application 2024 & 2032
- Figure 31: Asia Pacific PD1 and PDLl1 Inhibitors Market Revenue Share (%), by Application 2024 & 2032
- Figure 32: Asia Pacific PD1 and PDLl1 Inhibitors Market Revenue (Million), by Distribution Channel 2024 & 2032
- Figure 33: Asia Pacific PD1 and PDLl1 Inhibitors Market Revenue Share (%), by Distribution Channel 2024 & 2032
- Figure 34: Asia Pacific PD1 and PDLl1 Inhibitors Market Revenue (Million), by Country 2024 & 2032
- Figure 35: Asia Pacific PD1 and PDLl1 Inhibitors Market Revenue Share (%), by Country 2024 & 2032
- Figure 36: Middle East and Africa PD1 and PDLl1 Inhibitors Market Revenue (Million), by Type of Inhibitors 2024 & 2032
- Figure 37: Middle East and Africa PD1 and PDLl1 Inhibitors Market Revenue Share (%), by Type of Inhibitors 2024 & 2032
- Figure 38: Middle East and Africa PD1 and PDLl1 Inhibitors Market Revenue (Million), by Application 2024 & 2032
- Figure 39: Middle East and Africa PD1 and PDLl1 Inhibitors Market Revenue Share (%), by Application 2024 & 2032
- Figure 40: Middle East and Africa PD1 and PDLl1 Inhibitors Market Revenue (Million), by Distribution Channel 2024 & 2032
- Figure 41: Middle East and Africa PD1 and PDLl1 Inhibitors Market Revenue Share (%), by Distribution Channel 2024 & 2032
- Figure 42: Middle East and Africa PD1 and PDLl1 Inhibitors Market Revenue (Million), by Country 2024 & 2032
- Figure 43: Middle East and Africa PD1 and PDLl1 Inhibitors Market Revenue Share (%), by Country 2024 & 2032
- Figure 44: South America PD1 and PDLl1 Inhibitors Market Revenue (Million), by Type of Inhibitors 2024 & 2032
- Figure 45: South America PD1 and PDLl1 Inhibitors Market Revenue Share (%), by Type of Inhibitors 2024 & 2032
- Figure 46: South America PD1 and PDLl1 Inhibitors Market Revenue (Million), by Application 2024 & 2032
- Figure 47: South America PD1 and PDLl1 Inhibitors Market Revenue Share (%), by Application 2024 & 2032
- Figure 48: South America PD1 and PDLl1 Inhibitors Market Revenue (Million), by Distribution Channel 2024 & 2032
- Figure 49: South America PD1 and PDLl1 Inhibitors Market Revenue Share (%), by Distribution Channel 2024 & 2032
- Figure 50: South America PD1 and PDLl1 Inhibitors Market Revenue (Million), by Country 2024 & 2032
- Figure 51: South America PD1 and PDLl1 Inhibitors Market Revenue Share (%), by Country 2024 & 2032
List of Tables
- Table 1: Global PD1 and PDLl1 Inhibitors Market Revenue Million Forecast, by Region 2019 & 2032
- Table 2: Global PD1 and PDLl1 Inhibitors Market Revenue Million Forecast, by Type of Inhibitors 2019 & 2032
- Table 3: Global PD1 and PDLl1 Inhibitors Market Revenue Million Forecast, by Application 2019 & 2032
- Table 4: Global PD1 and PDLl1 Inhibitors Market Revenue Million Forecast, by Distribution Channel 2019 & 2032
- Table 5: Global PD1 and PDLl1 Inhibitors Market Revenue Million Forecast, by Region 2019 & 2032
- Table 6: Global PD1 and PDLl1 Inhibitors Market Revenue Million Forecast, by Country 2019 & 2032
- Table 7: United states PD1 and PDLl1 Inhibitors Market Revenue (Million) Forecast, by Application 2019 & 2032
- Table 8: Canada PD1 and PDLl1 Inhibitors Market Revenue (Million) Forecast, by Application 2019 & 2032
- Table 9: Mexico PD1 and PDLl1 Inhibitors Market Revenue (Million) Forecast, by Application 2019 & 2032
- Table 10: Global PD1 and PDLl1 Inhibitors Market Revenue Million Forecast, by Country 2019 & 2032
- Table 11: Germany PD1 and PDLl1 Inhibitors Market Revenue (Million) Forecast, by Application 2019 & 2032
- Table 12: United Kingdom PD1 and PDLl1 Inhibitors Market Revenue (Million) Forecast, by Application 2019 & 2032
- Table 13: France PD1 and PDLl1 Inhibitors Market Revenue (Million) Forecast, by Application 2019 & 2032
- Table 14: Italy PD1 and PDLl1 Inhibitors Market Revenue (Million) Forecast, by Application 2019 & 2032
- Table 15: Spain PD1 and PDLl1 Inhibitors Market Revenue (Million) Forecast, by Application 2019 & 2032
- Table 16: Rest of Europe PD1 and PDLl1 Inhibitors Market Revenue (Million) Forecast, by Application 2019 & 2032
- Table 17: Global PD1 and PDLl1 Inhibitors Market Revenue Million Forecast, by Country 2019 & 2032
- Table 18: China PD1 and PDLl1 Inhibitors Market Revenue (Million) Forecast, by Application 2019 & 2032
- Table 19: Japan PD1 and PDLl1 Inhibitors Market Revenue (Million) Forecast, by Application 2019 & 2032
- Table 20: India PD1 and PDLl1 Inhibitors Market Revenue (Million) Forecast, by Application 2019 & 2032
- Table 21: Australia PD1 and PDLl1 Inhibitors Market Revenue (Million) Forecast, by Application 2019 & 2032
- Table 22: South Korea PD1 and PDLl1 Inhibitors Market Revenue (Million) Forecast, by Application 2019 & 2032
- Table 23: Rest of Asia Pacific PD1 and PDLl1 Inhibitors Market Revenue (Million) Forecast, by Application 2019 & 2032
- Table 24: Global PD1 and PDLl1 Inhibitors Market Revenue Million Forecast, by Country 2019 & 2032
- Table 25: GCC PD1 and PDLl1 Inhibitors Market Revenue (Million) Forecast, by Application 2019 & 2032
- Table 26: South Africa PD1 and PDLl1 Inhibitors Market Revenue (Million) Forecast, by Application 2019 & 2032
- Table 27: Rest of Middle East and Africa PD1 and PDLl1 Inhibitors Market Revenue (Million) Forecast, by Application 2019 & 2032
- Table 28: Global PD1 and PDLl1 Inhibitors Market Revenue Million Forecast, by Country 2019 & 2032
- Table 29: Brazil PD1 and PDLl1 Inhibitors Market Revenue (Million) Forecast, by Application 2019 & 2032
- Table 30: Argentina PD1 and PDLl1 Inhibitors Market Revenue (Million) Forecast, by Application 2019 & 2032
- Table 31: Rest of South America PD1 and PDLl1 Inhibitors Market Revenue (Million) Forecast, by Application 2019 & 2032
- Table 32: Global PD1 and PDLl1 Inhibitors Market Revenue Million Forecast, by Type of Inhibitors 2019 & 2032
- Table 33: Global PD1 and PDLl1 Inhibitors Market Revenue Million Forecast, by Application 2019 & 2032
- Table 34: Global PD1 and PDLl1 Inhibitors Market Revenue Million Forecast, by Distribution Channel 2019 & 2032
- Table 35: Global PD1 and PDLl1 Inhibitors Market Revenue Million Forecast, by Country 2019 & 2032
- Table 36: United states PD1 and PDLl1 Inhibitors Market Revenue (Million) Forecast, by Application 2019 & 2032
- Table 37: Canada PD1 and PDLl1 Inhibitors Market Revenue (Million) Forecast, by Application 2019 & 2032
- Table 38: Mexico PD1 and PDLl1 Inhibitors Market Revenue (Million) Forecast, by Application 2019 & 2032
- Table 39: Global PD1 and PDLl1 Inhibitors Market Revenue Million Forecast, by Type of Inhibitors 2019 & 2032
- Table 40: Global PD1 and PDLl1 Inhibitors Market Revenue Million Forecast, by Application 2019 & 2032
- Table 41: Global PD1 and PDLl1 Inhibitors Market Revenue Million Forecast, by Distribution Channel 2019 & 2032
- Table 42: Global PD1 and PDLl1 Inhibitors Market Revenue Million Forecast, by Country 2019 & 2032
- Table 43: Germany PD1 and PDLl1 Inhibitors Market Revenue (Million) Forecast, by Application 2019 & 2032
- Table 44: United Kingdom PD1 and PDLl1 Inhibitors Market Revenue (Million) Forecast, by Application 2019 & 2032
- Table 45: France PD1 and PDLl1 Inhibitors Market Revenue (Million) Forecast, by Application 2019 & 2032
- Table 46: Italy PD1 and PDLl1 Inhibitors Market Revenue (Million) Forecast, by Application 2019 & 2032
- Table 47: Spain PD1 and PDLl1 Inhibitors Market Revenue (Million) Forecast, by Application 2019 & 2032
- Table 48: Rest of Europe PD1 and PDLl1 Inhibitors Market Revenue (Million) Forecast, by Application 2019 & 2032
- Table 49: Global PD1 and PDLl1 Inhibitors Market Revenue Million Forecast, by Type of Inhibitors 2019 & 2032
- Table 50: Global PD1 and PDLl1 Inhibitors Market Revenue Million Forecast, by Application 2019 & 2032
- Table 51: Global PD1 and PDLl1 Inhibitors Market Revenue Million Forecast, by Distribution Channel 2019 & 2032
- Table 52: Global PD1 and PDLl1 Inhibitors Market Revenue Million Forecast, by Country 2019 & 2032
- Table 53: China PD1 and PDLl1 Inhibitors Market Revenue (Million) Forecast, by Application 2019 & 2032
- Table 54: Japan PD1 and PDLl1 Inhibitors Market Revenue (Million) Forecast, by Application 2019 & 2032
- Table 55: India PD1 and PDLl1 Inhibitors Market Revenue (Million) Forecast, by Application 2019 & 2032
- Table 56: Australia PD1 and PDLl1 Inhibitors Market Revenue (Million) Forecast, by Application 2019 & 2032
- Table 57: South Korea PD1 and PDLl1 Inhibitors Market Revenue (Million) Forecast, by Application 2019 & 2032
- Table 58: Rest of Asia Pacific PD1 and PDLl1 Inhibitors Market Revenue (Million) Forecast, by Application 2019 & 2032
- Table 59: Global PD1 and PDLl1 Inhibitors Market Revenue Million Forecast, by Type of Inhibitors 2019 & 2032
- Table 60: Global PD1 and PDLl1 Inhibitors Market Revenue Million Forecast, by Application 2019 & 2032
- Table 61: Global PD1 and PDLl1 Inhibitors Market Revenue Million Forecast, by Distribution Channel 2019 & 2032
- Table 62: Global PD1 and PDLl1 Inhibitors Market Revenue Million Forecast, by Country 2019 & 2032
- Table 63: GCC PD1 and PDLl1 Inhibitors Market Revenue (Million) Forecast, by Application 2019 & 2032
- Table 64: South Africa PD1 and PDLl1 Inhibitors Market Revenue (Million) Forecast, by Application 2019 & 2032
- Table 65: Rest of Middle East and Africa PD1 and PDLl1 Inhibitors Market Revenue (Million) Forecast, by Application 2019 & 2032
- Table 66: Global PD1 and PDLl1 Inhibitors Market Revenue Million Forecast, by Type of Inhibitors 2019 & 2032
- Table 67: Global PD1 and PDLl1 Inhibitors Market Revenue Million Forecast, by Application 2019 & 2032
- Table 68: Global PD1 and PDLl1 Inhibitors Market Revenue Million Forecast, by Distribution Channel 2019 & 2032
- Table 69: Global PD1 and PDLl1 Inhibitors Market Revenue Million Forecast, by Country 2019 & 2032
- Table 70: Brazil PD1 and PDLl1 Inhibitors Market Revenue (Million) Forecast, by Application 2019 & 2032
- Table 71: Argentina PD1 and PDLl1 Inhibitors Market Revenue (Million) Forecast, by Application 2019 & 2032
- Table 72: Rest of South America PD1 and PDLl1 Inhibitors Market Revenue (Million) Forecast, by Application 2019 & 2032
Frequently Asked Questions
1. What is the projected Compound Annual Growth Rate (CAGR) of the PD1 and PDLl1 Inhibitors Market?
The projected CAGR is approximately 17.96%.
2. Which companies are prominent players in the PD1 and PDLl1 Inhibitors Market?
Key companies in the market include Amgen Inc, AstraZeneca PLC, BeiGene LTD, Eli Lilly and Company, Regeneron Pharmaceuticals Inc *List Not Exhaustive, F Hoffmann-La Roche AG, Merck & Co, Bristol-Myers Squibb Company, GlaxoSmithKline PLC, Pfizer Inc.
3. What are the main segments of the PD1 and PDLl1 Inhibitors Market?
The market segments include Type of Inhibitors, Application, Distribution Channel.
4. Can you provide details about the market size?
The market size is estimated to be USD XX Million as of 2022.
5. What are some drivers contributing to market growth?
Rising Investments in R&D and Clinical Trials by Bio-pharmaceutical Industries; Increased Encouragement Initiatives by the Regulatory Authorities with Favorable Approvals and Special Designations; Growing Burden of Different Cancers.
6. What are the notable trends driving market growth?
PD-1 Inhibitors Segment is Expected to Witness Significant Growth Over the Forecast Period.
7. Are there any restraints impacting market growth?
Risk of Complications Associated with the Highly Expensive Oncology Treatment; Challenges in Development with Uncertainty in Regulatory Process and High Costs of Tedious Clinical Trials.
8. Can you provide examples of recent developments in the market?
March 2023: Ono Pharmaceutical Co., Ltd. received supplemental approval for Opdivo (nivolumab) Intravenous Infusion, a human anti-human PD-1 monoclonal antibody in Japan for the neoadjuvant treatment of non-small cell lung cancer in combination with chemotherapy.
9. What pricing options are available for accessing the report?
Pricing options include single-user, multi-user, and enterprise licenses priced at USD 4750, USD 5250, and USD 8750 respectively.
10. Is the market size provided in terms of value or volume?
The market size is provided in terms of value, measured in Million.
11. Are there any specific market keywords associated with the report?
Yes, the market keyword associated with the report is "PD1 and PDLl1 Inhibitors Market," which aids in identifying and referencing the specific market segment covered.
12. How do I determine which pricing option suits my needs best?
The pricing options vary based on user requirements and access needs. Individual users may opt for single-user licenses, while businesses requiring broader access may choose multi-user or enterprise licenses for cost-effective access to the report.
13. Are there any additional resources or data provided in the PD1 and PDLl1 Inhibitors Market report?
While the report offers comprehensive insights, it's advisable to review the specific contents or supplementary materials provided to ascertain if additional resources or data are available.
14. How can I stay updated on further developments or reports in the PD1 and PDLl1 Inhibitors Market?
To stay informed about further developments, trends, and reports in the PD1 and PDLl1 Inhibitors Market, consider subscribing to industry newsletters, following relevant companies and organizations, or regularly checking reputable industry news sources and publications.
Methodology
Step 1 - Identification of Relevant Samples Size from Population Database


Step 2 - Approaches for Defining Global Market Size (Value, Volume* & Price*)

Note*: In applicable scenarios
Step 3 - Data Sources
Primary Research
- Web Analytics
- Survey Reports
- Research Institute
- Latest Research Reports
- Opinion Leaders
Secondary Research
- Annual Reports
- White Paper
- Latest Press Release
- Industry Association
- Paid Database
- Investor Presentations

Step 4 - Data Triangulation
Involves using different sources of information in order to increase the validity of a study
These sources are likely to be stakeholders in a program - participants, other researchers, program staff, other community members, and so on.
Then we put all data in single framework & apply various statistical tools to find out the dynamic on the market.
During the analysis stage, feedback from the stakeholder groups would be compared to determine areas of agreement as well as areas of divergence
