

Key Insights
The Oil and Gas Magnetic Ranging Market is poised for significant expansion, driven by escalating exploration and production activities across onshore and offshore domains. With a projected Compound Annual Growth Rate (CAGR) of 8.8%, the demand for accurate and efficient magnetic ranging solutions is consistently increasing. Key growth catalysts include the imperative for precise well placement and directional drilling in complex geological formations, the growing adoption of advanced drilling technologies leveraging real-time magnetic data, and stringent regulatory mandates for enhanced safety and environmental stewardship in oil and gas operations. The market is segmented by deployment type (onshore and offshore), with North America, Europe, and Asia-Pacific currently dominating market share. Leading competitors include Halliburton and Weatherford, complemented by specialized providers such as Bartington Instruments and GMW Associates. Continuous technological advancements in sensor technology, data processing, and integration with drilling equipment are shaping market trends, leading to enhanced precision and reliability in ranging systems. However, market dynamics are influenced by the volatility of oil and gas prices and the inherent risks of offshore operations.
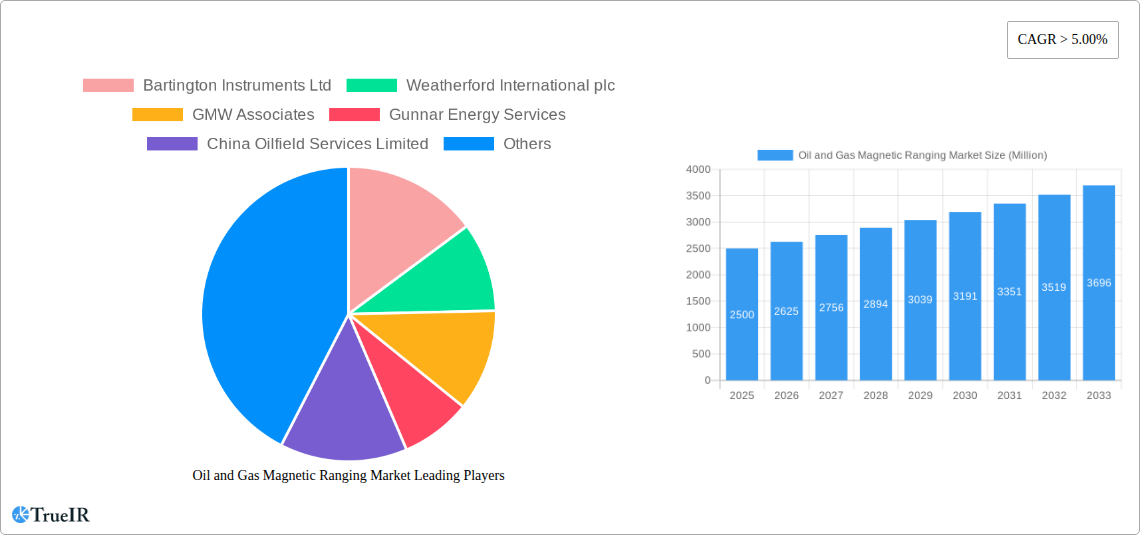
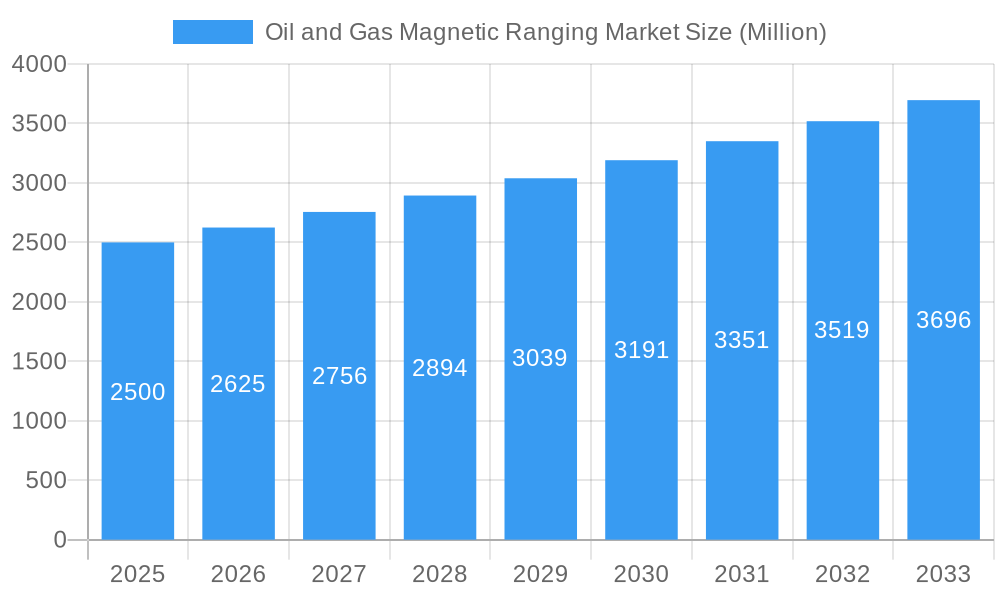
Oil and Gas Magnetic Ranging Market Market Size (In Million)
The market is forecasted for sustained growth from 2024 to 2033, with robust expansion anticipated in emerging markets within Asia-Pacific and the Middle East and Africa. A heightened emphasis on operational efficiency, cost reduction in drilling, and maximizing hydrocarbon recovery will fuel persistent demand. Ongoing innovation in magnetic ranging technology, including the development of more resilient and adaptable systems, will be critical for maintaining competitive advantage. Despite existing challenges, the overall market outlook is positive, underpinned by the enduring global requirement for dependable and precise well placement solutions in the oil and gas sector. The global market size is estimated at $580 million.
Oil and Gas Magnetic Ranging Market Company Market Share
Oil and Gas Magnetic Ranging Market: A Comprehensive Market Report (2019-2033)
This dynamic report offers a deep dive into the Oil and Gas Magnetic Ranging Market, providing a comprehensive analysis of its current state, future trajectory, and key players. With a focus on crucial industry trends and insightful data spanning the period 2019-2033 (Base Year: 2025, Forecast Period: 2025-2033), this report is an indispensable resource for industry professionals, investors, and strategic decision-makers. The market is projected to reach xx Million by 2033, exhibiting a CAGR of xx% during the forecast period.
Oil and Gas Magnetic Ranging Market Market Structure & Competitive Landscape
The Oil and Gas Magnetic Ranging market exhibits a moderately consolidated structure, with a few key players holding significant market share. The Herfindahl-Hirschman Index (HHI) is estimated at xx, indicating a relatively competitive landscape. However, the market is witnessing increasing consolidation through mergers and acquisitions (M&A). Over the historical period (2019-2024), the total M&A volume in the sector reached approximately xx Million, driven by the pursuit of economies of scale and technological advancements. Innovation plays a crucial role, with companies investing heavily in R&D to improve accuracy, efficiency, and functionality of magnetic ranging systems. Regulatory compliance, particularly concerning safety and environmental standards, significantly impacts market operations. The market is susceptible to the availability of substitute technologies, although currently, magnetic ranging retains significant competitive advantages in specific applications. End-user segmentation is primarily based on the size and type of oil and gas operations, with large multinational corporations and independent producers forming distinct segments.
- Market Concentration: HHI estimated at xx.
- Innovation Drivers: R&D investments in accuracy, efficiency, and new applications.
- Regulatory Impacts: Stringent safety and environmental regulations.
- Product Substitutes: Limited, but potential threat from alternative technologies.
- End-User Segmentation: Large multinationals vs. independent producers.
- M&A Trends: xx Million in M&A volume during 2019-2024, driving consolidation.
Oil and Gas Magnetic Ranging Market Market Trends & Opportunities
The Oil and Gas Magnetic Ranging market is experiencing robust growth, driven by the increasing demand for precise wellbore positioning and directional drilling in both onshore and offshore operations. The market size is estimated to be xx Million in 2025 and is projected to reach xx Million by 2033, showcasing significant potential for growth. Technological advancements, such as the integration of advanced sensors and data analytics, are enhancing the accuracy and efficiency of magnetic ranging systems. The growing adoption of automation and remote operations in the oil and gas industry further fuels market expansion. However, fluctuating oil and gas prices and intense competition among key players create both opportunities and challenges. The market penetration rate for magnetic ranging systems in directional drilling is currently at approximately xx%, with considerable room for future growth, particularly in emerging markets.
Dominant Markets & Segments in Oil and Gas Magnetic Ranging Market
The North American region currently holds the largest market share in the Oil and Gas Magnetic Ranging Market, driven by significant oil and gas exploration and production activities, coupled with robust technological advancements. The offshore segment also displays strong growth potential, driven by the increasing exploration and development of deepwater resources.
Key Growth Drivers:
- North America: Established oil and gas infrastructure, technological innovation.
- Offshore Segment: Growing deepwater exploration and production activities.
- Asia-Pacific: Rising energy demand and investments in oil and gas infrastructure.
Market Dominance Analysis:
North America’s dominance stems from a mature oil and gas industry with extensive infrastructure and a high concentration of major operators. The offshore segment benefits from the high value and technological complexity of deepwater projects, where precise wellbore positioning is critical. The Asia-Pacific region is witnessing rapid growth, driven by increasing energy demand and government investments in oil and gas exploration and development.
Oil and Gas Magnetic Ranging Market Product Analysis
The Oil and Gas Magnetic Ranging market encompasses a range of products tailored to diverse applications in directional drilling and wellbore surveying. Recent innovations focus on enhanced accuracy, improved data processing capabilities, and integration with other downhole technologies. These improvements lead to more efficient drilling operations, reduced non-productive time, and increased safety standards. The market is witnessing the emergence of smart sensors and AI-driven analytics which further streamline processes and enhance data interpretation. This creates a competitive advantage for companies offering integrated solutions.
Key Drivers, Barriers & Challenges in Oil and Gas Magnetic Ranging Market
Key Drivers:
- Increasing demand for precise wellbore positioning: Drives the need for advanced magnetic ranging systems.
- Technological advancements: Improved accuracy, efficiency, and integration with other technologies.
- Growing adoption of automation and remote operations: Creates opportunities for data-driven decision making.
Challenges and Restraints:
- Fluctuating oil and gas prices: Impact investment decisions and project feasibility.
- Intense competition: Requires continuous innovation and cost optimization.
- Regulatory complexities and environmental concerns: Pose challenges to operational efficiency.
Growth Drivers in the Oil and Gas Magnetic Ranging Market Market
The market's growth is fueled by the increasing demand for precise well placement in directional drilling, particularly in challenging environments such as deepwater and unconventional reservoirs. Advancements in sensor technology and data analytics enhance the accuracy and efficiency of magnetic ranging systems. Moreover, the growing adoption of automation and digitalization in the oil and gas industry is a significant growth catalyst, allowing for remote operations and better data interpretation. Government regulations emphasizing safety and environmental protection, while posing some challenges, indirectly drive the demand for reliable and accurate magnetic ranging solutions.
Challenges Impacting Oil and Gas Magnetic Ranging Market Growth
The primary challenges include fluctuating oil and gas prices, which can impact investment decisions and project viability. Intense competition among established and emerging players necessitates continuous innovation and cost optimization. Regulatory hurdles and environmental concerns impose stringent safety standards and operational constraints. Supply chain disruptions can also negatively impact the availability and cost of components for magnetic ranging systems. These factors collectively influence the market's growth trajectory.
Key Players Shaping the Oil and Gas Magnetic Ranging Market Market
- Bartington Instruments Ltd
- Weatherford International plc
- GMW Associates
- Gunnar Energy Services
- China Oilfield Services Limited
- Halliburton Company
- Prime Horizontal Group of Companies
- Scientific Drilling International Inc
Significant Oil and Gas Magnetic Ranging Market Industry Milestones
- 2021: Introduction of a new high-precision magnetic ranging system by Bartington Instruments Ltd.
- 2022: Acquisition of a smaller competitor by Weatherford International plc, expanding its market share.
- 2023: Halliburton Company launched an integrated software platform for improved data analysis of magnetic ranging data.
- 2024: A new joint venture formed between two key players for developing advanced sensors for deepwater applications.
Future Outlook for Oil and Gas Magnetic Ranging Market Market
The Oil and Gas Magnetic Ranging market is poised for continued growth, driven by increasing exploration and production activities globally, particularly in offshore and unconventional resources. Technological advancements, such as AI-driven data analysis and integration with other downhole technologies, present significant opportunities for enhanced efficiency and cost optimization. The adoption of sustainable practices in the oil and gas industry will further stimulate demand for accurate and reliable wellbore positioning systems. The market's future growth hinges on adapting to technological advancements, navigating regulatory landscapes and maintaining a competitive edge in a dynamic industry environment.
Oil and Gas Magnetic Ranging Market Segmentation
-
1. Location of Deployment
- 1.1. Offshore
- 1.2. Onshore
-
2. Geogrpahy
- 2.1. North America
- 2.2. Europe
- 2.3. Asia-Pacific
- 2.4. Middle-East and Africa
- 2.5. South America
Oil and Gas Magnetic Ranging Market Segmentation By Geography
-
1. North America
- 1.1. United States
- 1.2. Canada
- 1.3. Mexico
-
2. South America
- 2.1. Brazil
- 2.2. Argentina
- 2.3. Rest of South America
-
3. Europe
- 3.1. United Kingdom
- 3.2. Germany
- 3.3. France
- 3.4. Italy
- 3.5. Spain
- 3.6. Russia
- 3.7. Benelux
- 3.8. Nordics
- 3.9. Rest of Europe
-
4. Middle East & Africa
- 4.1. Turkey
- 4.2. Israel
- 4.3. GCC
- 4.4. North Africa
- 4.5. South Africa
- 4.6. Rest of Middle East & Africa
-
5. Asia Pacific
- 5.1. China
- 5.2. India
- 5.3. Japan
- 5.4. South Korea
- 5.5. ASEAN
- 5.6. Oceania
- 5.7. Rest of Asia Pacific
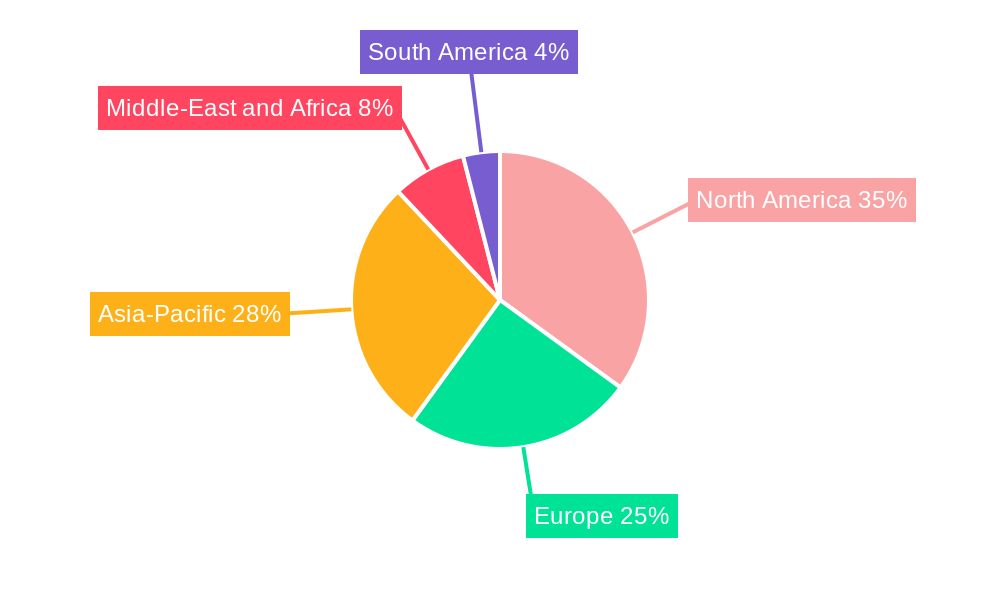
Oil and Gas Magnetic Ranging Market Regional Market Share
Geographic Coverage of Oil and Gas Magnetic Ranging Market
Oil and Gas Magnetic Ranging Market REPORT HIGHLIGHTS
| Aspects | Details |
|---|---|
| Study Period | 2020-2034 |
| Base Year | 2025 |
| Estimated Year | 2026 |
| Forecast Period | 2026-2034 |
| Historical Period | 2020-2025 |
| Growth Rate | CAGR of 8.8% from 2020-2034 |
| Segmentation |
|
Table of Contents
- 1. Introduction
- 1.1. Research Scope
- 1.2. Market Segmentation
- 1.3. Research Methodology
- 1.4. Definitions and Assumptions
- 2. Executive Summary
- 2.1. Introduction
- 3. Market Dynamics
- 3.1. Introduction
- 3.2. Market Drivers
- 3.2.1. 4.; Increasing Production from Unconventional Sources4.; Growing Energy Demand in the Region
- 3.3. Market Restrains
- 3.3.1. 4.; Environmental Concerns
- 3.4. Market Trends
- 3.4.1. Onshore Segment to Dominate the Demand
- 4. Market Factor Analysis
- 4.1. Porters Five Forces
- 4.2. Supply/Value Chain
- 4.3. PESTEL analysis
- 4.4. Market Entropy
- 4.5. Patent/Trademark Analysis
- 5. Global Oil and Gas Magnetic Ranging Market Analysis, Insights and Forecast, 2020-2032
- 5.1. Market Analysis, Insights and Forecast - by Location of Deployment
- 5.1.1. Offshore
- 5.1.2. Onshore
- 5.2. Market Analysis, Insights and Forecast - by Geogrpahy
- 5.2.1. North America
- 5.2.2. Europe
- 5.2.3. Asia-Pacific
- 5.2.4. Middle-East and Africa
- 5.2.5. South America
- 5.3. Market Analysis, Insights and Forecast - by Region
- 5.3.1. North America
- 5.3.2. South America
- 5.3.3. Europe
- 5.3.4. Middle East & Africa
- 5.3.5. Asia Pacific
- 5.1. Market Analysis, Insights and Forecast - by Location of Deployment
- 6. North America Oil and Gas Magnetic Ranging Market Analysis, Insights and Forecast, 2020-2032
- 6.1. Market Analysis, Insights and Forecast - by Location of Deployment
- 6.1.1. Offshore
- 6.1.2. Onshore
- 6.2. Market Analysis, Insights and Forecast - by Geogrpahy
- 6.2.1. North America
- 6.2.2. Europe
- 6.2.3. Asia-Pacific
- 6.2.4. Middle-East and Africa
- 6.2.5. South America
- 6.1. Market Analysis, Insights and Forecast - by Location of Deployment
- 7. South America Oil and Gas Magnetic Ranging Market Analysis, Insights and Forecast, 2020-2032
- 7.1. Market Analysis, Insights and Forecast - by Location of Deployment
- 7.1.1. Offshore
- 7.1.2. Onshore
- 7.2. Market Analysis, Insights and Forecast - by Geogrpahy
- 7.2.1. North America
- 7.2.2. Europe
- 7.2.3. Asia-Pacific
- 7.2.4. Middle-East and Africa
- 7.2.5. South America
- 7.1. Market Analysis, Insights and Forecast - by Location of Deployment
- 8. Europe Oil and Gas Magnetic Ranging Market Analysis, Insights and Forecast, 2020-2032
- 8.1. Market Analysis, Insights and Forecast - by Location of Deployment
- 8.1.1. Offshore
- 8.1.2. Onshore
- 8.2. Market Analysis, Insights and Forecast - by Geogrpahy
- 8.2.1. North America
- 8.2.2. Europe
- 8.2.3. Asia-Pacific
- 8.2.4. Middle-East and Africa
- 8.2.5. South America
- 8.1. Market Analysis, Insights and Forecast - by Location of Deployment
- 9. Middle East & Africa Oil and Gas Magnetic Ranging Market Analysis, Insights and Forecast, 2020-2032
- 9.1. Market Analysis, Insights and Forecast - by Location of Deployment
- 9.1.1. Offshore
- 9.1.2. Onshore
- 9.2. Market Analysis, Insights and Forecast - by Geogrpahy
- 9.2.1. North America
- 9.2.2. Europe
- 9.2.3. Asia-Pacific
- 9.2.4. Middle-East and Africa
- 9.2.5. South America
- 9.1. Market Analysis, Insights and Forecast - by Location of Deployment
- 10. Asia Pacific Oil and Gas Magnetic Ranging Market Analysis, Insights and Forecast, 2020-2032
- 10.1. Market Analysis, Insights and Forecast - by Location of Deployment
- 10.1.1. Offshore
- 10.1.2. Onshore
- 10.2. Market Analysis, Insights and Forecast - by Geogrpahy
- 10.2.1. North America
- 10.2.2. Europe
- 10.2.3. Asia-Pacific
- 10.2.4. Middle-East and Africa
- 10.2.5. South America
- 10.1. Market Analysis, Insights and Forecast - by Location of Deployment
- 11. Competitive Analysis
- 11.1. Global Market Share Analysis 2025
- 11.2. Company Profiles
- 11.2.1 Bartington Instruments Ltd
- 11.2.1.1. Overview
- 11.2.1.2. Products
- 11.2.1.3. SWOT Analysis
- 11.2.1.4. Recent Developments
- 11.2.1.5. Financials (Based on Availability)
- 11.2.2 Weatherford International plc
- 11.2.2.1. Overview
- 11.2.2.2. Products
- 11.2.2.3. SWOT Analysis
- 11.2.2.4. Recent Developments
- 11.2.2.5. Financials (Based on Availability)
- 11.2.3 GMW Associates
- 11.2.3.1. Overview
- 11.2.3.2. Products
- 11.2.3.3. SWOT Analysis
- 11.2.3.4. Recent Developments
- 11.2.3.5. Financials (Based on Availability)
- 11.2.4 Gunnar Energy Services
- 11.2.4.1. Overview
- 11.2.4.2. Products
- 11.2.4.3. SWOT Analysis
- 11.2.4.4. Recent Developments
- 11.2.4.5. Financials (Based on Availability)
- 11.2.5 China Oilfield Services Limited
- 11.2.5.1. Overview
- 11.2.5.2. Products
- 11.2.5.3. SWOT Analysis
- 11.2.5.4. Recent Developments
- 11.2.5.5. Financials (Based on Availability)
- 11.2.6 Halliburton Company
- 11.2.6.1. Overview
- 11.2.6.2. Products
- 11.2.6.3. SWOT Analysis
- 11.2.6.4. Recent Developments
- 11.2.6.5. Financials (Based on Availability)
- 11.2.7 Prime Horizontal Group of Companies
- 11.2.7.1. Overview
- 11.2.7.2. Products
- 11.2.7.3. SWOT Analysis
- 11.2.7.4. Recent Developments
- 11.2.7.5. Financials (Based on Availability)
- 11.2.8 Scientific Drilling International Inc
- 11.2.8.1. Overview
- 11.2.8.2. Products
- 11.2.8.3. SWOT Analysis
- 11.2.8.4. Recent Developments
- 11.2.8.5. Financials (Based on Availability)
- 11.2.1 Bartington Instruments Ltd
List of Figures
- Figure 1: Global Oil and Gas Magnetic Ranging Market Revenue Breakdown (million, %) by Region 2025 & 2033
- Figure 2: North America Oil and Gas Magnetic Ranging Market Revenue (million), by Location of Deployment 2025 & 2033
- Figure 3: North America Oil and Gas Magnetic Ranging Market Revenue Share (%), by Location of Deployment 2025 & 2033
- Figure 4: North America Oil and Gas Magnetic Ranging Market Revenue (million), by Geogrpahy 2025 & 2033
- Figure 5: North America Oil and Gas Magnetic Ranging Market Revenue Share (%), by Geogrpahy 2025 & 2033
- Figure 6: North America Oil and Gas Magnetic Ranging Market Revenue (million), by Country 2025 & 2033
- Figure 7: North America Oil and Gas Magnetic Ranging Market Revenue Share (%), by Country 2025 & 2033
- Figure 8: South America Oil and Gas Magnetic Ranging Market Revenue (million), by Location of Deployment 2025 & 2033
- Figure 9: South America Oil and Gas Magnetic Ranging Market Revenue Share (%), by Location of Deployment 2025 & 2033
- Figure 10: South America Oil and Gas Magnetic Ranging Market Revenue (million), by Geogrpahy 2025 & 2033
- Figure 11: South America Oil and Gas Magnetic Ranging Market Revenue Share (%), by Geogrpahy 2025 & 2033
- Figure 12: South America Oil and Gas Magnetic Ranging Market Revenue (million), by Country 2025 & 2033
- Figure 13: South America Oil and Gas Magnetic Ranging Market Revenue Share (%), by Country 2025 & 2033
- Figure 14: Europe Oil and Gas Magnetic Ranging Market Revenue (million), by Location of Deployment 2025 & 2033
- Figure 15: Europe Oil and Gas Magnetic Ranging Market Revenue Share (%), by Location of Deployment 2025 & 2033
- Figure 16: Europe Oil and Gas Magnetic Ranging Market Revenue (million), by Geogrpahy 2025 & 2033
- Figure 17: Europe Oil and Gas Magnetic Ranging Market Revenue Share (%), by Geogrpahy 2025 & 2033
- Figure 18: Europe Oil and Gas Magnetic Ranging Market Revenue (million), by Country 2025 & 2033
- Figure 19: Europe Oil and Gas Magnetic Ranging Market Revenue Share (%), by Country 2025 & 2033
- Figure 20: Middle East & Africa Oil and Gas Magnetic Ranging Market Revenue (million), by Location of Deployment 2025 & 2033
- Figure 21: Middle East & Africa Oil and Gas Magnetic Ranging Market Revenue Share (%), by Location of Deployment 2025 & 2033
- Figure 22: Middle East & Africa Oil and Gas Magnetic Ranging Market Revenue (million), by Geogrpahy 2025 & 2033
- Figure 23: Middle East & Africa Oil and Gas Magnetic Ranging Market Revenue Share (%), by Geogrpahy 2025 & 2033
- Figure 24: Middle East & Africa Oil and Gas Magnetic Ranging Market Revenue (million), by Country 2025 & 2033
- Figure 25: Middle East & Africa Oil and Gas Magnetic Ranging Market Revenue Share (%), by Country 2025 & 2033
- Figure 26: Asia Pacific Oil and Gas Magnetic Ranging Market Revenue (million), by Location of Deployment 2025 & 2033
- Figure 27: Asia Pacific Oil and Gas Magnetic Ranging Market Revenue Share (%), by Location of Deployment 2025 & 2033
- Figure 28: Asia Pacific Oil and Gas Magnetic Ranging Market Revenue (million), by Geogrpahy 2025 & 2033
- Figure 29: Asia Pacific Oil and Gas Magnetic Ranging Market Revenue Share (%), by Geogrpahy 2025 & 2033
- Figure 30: Asia Pacific Oil and Gas Magnetic Ranging Market Revenue (million), by Country 2025 & 2033
- Figure 31: Asia Pacific Oil and Gas Magnetic Ranging Market Revenue Share (%), by Country 2025 & 2033
List of Tables
- Table 1: Global Oil and Gas Magnetic Ranging Market Revenue million Forecast, by Location of Deployment 2020 & 2033
- Table 2: Global Oil and Gas Magnetic Ranging Market Revenue million Forecast, by Geogrpahy 2020 & 2033
- Table 3: Global Oil and Gas Magnetic Ranging Market Revenue million Forecast, by Region 2020 & 2033
- Table 4: Global Oil and Gas Magnetic Ranging Market Revenue million Forecast, by Location of Deployment 2020 & 2033
- Table 5: Global Oil and Gas Magnetic Ranging Market Revenue million Forecast, by Geogrpahy 2020 & 2033
- Table 6: Global Oil and Gas Magnetic Ranging Market Revenue million Forecast, by Country 2020 & 2033
- Table 7: United States Oil and Gas Magnetic Ranging Market Revenue (million) Forecast, by Application 2020 & 2033
- Table 8: Canada Oil and Gas Magnetic Ranging Market Revenue (million) Forecast, by Application 2020 & 2033
- Table 9: Mexico Oil and Gas Magnetic Ranging Market Revenue (million) Forecast, by Application 2020 & 2033
- Table 10: Global Oil and Gas Magnetic Ranging Market Revenue million Forecast, by Location of Deployment 2020 & 2033
- Table 11: Global Oil and Gas Magnetic Ranging Market Revenue million Forecast, by Geogrpahy 2020 & 2033
- Table 12: Global Oil and Gas Magnetic Ranging Market Revenue million Forecast, by Country 2020 & 2033
- Table 13: Brazil Oil and Gas Magnetic Ranging Market Revenue (million) Forecast, by Application 2020 & 2033
- Table 14: Argentina Oil and Gas Magnetic Ranging Market Revenue (million) Forecast, by Application 2020 & 2033
- Table 15: Rest of South America Oil and Gas Magnetic Ranging Market Revenue (million) Forecast, by Application 2020 & 2033
- Table 16: Global Oil and Gas Magnetic Ranging Market Revenue million Forecast, by Location of Deployment 2020 & 2033
- Table 17: Global Oil and Gas Magnetic Ranging Market Revenue million Forecast, by Geogrpahy 2020 & 2033
- Table 18: Global Oil and Gas Magnetic Ranging Market Revenue million Forecast, by Country 2020 & 2033
- Table 19: United Kingdom Oil and Gas Magnetic Ranging Market Revenue (million) Forecast, by Application 2020 & 2033
- Table 20: Germany Oil and Gas Magnetic Ranging Market Revenue (million) Forecast, by Application 2020 & 2033
- Table 21: France Oil and Gas Magnetic Ranging Market Revenue (million) Forecast, by Application 2020 & 2033
- Table 22: Italy Oil and Gas Magnetic Ranging Market Revenue (million) Forecast, by Application 2020 & 2033
- Table 23: Spain Oil and Gas Magnetic Ranging Market Revenue (million) Forecast, by Application 2020 & 2033
- Table 24: Russia Oil and Gas Magnetic Ranging Market Revenue (million) Forecast, by Application 2020 & 2033
- Table 25: Benelux Oil and Gas Magnetic Ranging Market Revenue (million) Forecast, by Application 2020 & 2033
- Table 26: Nordics Oil and Gas Magnetic Ranging Market Revenue (million) Forecast, by Application 2020 & 2033
- Table 27: Rest of Europe Oil and Gas Magnetic Ranging Market Revenue (million) Forecast, by Application 2020 & 2033
- Table 28: Global Oil and Gas Magnetic Ranging Market Revenue million Forecast, by Location of Deployment 2020 & 2033
- Table 29: Global Oil and Gas Magnetic Ranging Market Revenue million Forecast, by Geogrpahy 2020 & 2033
- Table 30: Global Oil and Gas Magnetic Ranging Market Revenue million Forecast, by Country 2020 & 2033
- Table 31: Turkey Oil and Gas Magnetic Ranging Market Revenue (million) Forecast, by Application 2020 & 2033
- Table 32: Israel Oil and Gas Magnetic Ranging Market Revenue (million) Forecast, by Application 2020 & 2033
- Table 33: GCC Oil and Gas Magnetic Ranging Market Revenue (million) Forecast, by Application 2020 & 2033
- Table 34: North Africa Oil and Gas Magnetic Ranging Market Revenue (million) Forecast, by Application 2020 & 2033
- Table 35: South Africa Oil and Gas Magnetic Ranging Market Revenue (million) Forecast, by Application 2020 & 2033
- Table 36: Rest of Middle East & Africa Oil and Gas Magnetic Ranging Market Revenue (million) Forecast, by Application 2020 & 2033
- Table 37: Global Oil and Gas Magnetic Ranging Market Revenue million Forecast, by Location of Deployment 2020 & 2033
- Table 38: Global Oil and Gas Magnetic Ranging Market Revenue million Forecast, by Geogrpahy 2020 & 2033
- Table 39: Global Oil and Gas Magnetic Ranging Market Revenue million Forecast, by Country 2020 & 2033
- Table 40: China Oil and Gas Magnetic Ranging Market Revenue (million) Forecast, by Application 2020 & 2033
- Table 41: India Oil and Gas Magnetic Ranging Market Revenue (million) Forecast, by Application 2020 & 2033
- Table 42: Japan Oil and Gas Magnetic Ranging Market Revenue (million) Forecast, by Application 2020 & 2033
- Table 43: South Korea Oil and Gas Magnetic Ranging Market Revenue (million) Forecast, by Application 2020 & 2033
- Table 44: ASEAN Oil and Gas Magnetic Ranging Market Revenue (million) Forecast, by Application 2020 & 2033
- Table 45: Oceania Oil and Gas Magnetic Ranging Market Revenue (million) Forecast, by Application 2020 & 2033
- Table 46: Rest of Asia Pacific Oil and Gas Magnetic Ranging Market Revenue (million) Forecast, by Application 2020 & 2033
Frequently Asked Questions
1. What is the projected Compound Annual Growth Rate (CAGR) of the Oil and Gas Magnetic Ranging Market?
The projected CAGR is approximately 8.8%.
2. Which companies are prominent players in the Oil and Gas Magnetic Ranging Market?
Key companies in the market include Bartington Instruments Ltd, Weatherford International plc, GMW Associates, Gunnar Energy Services, China Oilfield Services Limited, Halliburton Company, Prime Horizontal Group of Companies, Scientific Drilling International Inc.
3. What are the main segments of the Oil and Gas Magnetic Ranging Market?
The market segments include Location of Deployment, Geogrpahy.
4. Can you provide details about the market size?
The market size is estimated to be USD 580 million as of 2022.
5. What are some drivers contributing to market growth?
4.; Increasing Production from Unconventional Sources4.; Growing Energy Demand in the Region.
6. What are the notable trends driving market growth?
Onshore Segment to Dominate the Demand.
7. Are there any restraints impacting market growth?
4.; Environmental Concerns.
8. Can you provide examples of recent developments in the market?
N/A
9. What pricing options are available for accessing the report?
Pricing options include single-user, multi-user, and enterprise licenses priced at USD 4750, USD 5250, and USD 8750 respectively.
10. Is the market size provided in terms of value or volume?
The market size is provided in terms of value, measured in million.
11. Are there any specific market keywords associated with the report?
Yes, the market keyword associated with the report is "Oil and Gas Magnetic Ranging Market," which aids in identifying and referencing the specific market segment covered.
12. How do I determine which pricing option suits my needs best?
The pricing options vary based on user requirements and access needs. Individual users may opt for single-user licenses, while businesses requiring broader access may choose multi-user or enterprise licenses for cost-effective access to the report.
13. Are there any additional resources or data provided in the Oil and Gas Magnetic Ranging Market report?
While the report offers comprehensive insights, it's advisable to review the specific contents or supplementary materials provided to ascertain if additional resources or data are available.
14. How can I stay updated on further developments or reports in the Oil and Gas Magnetic Ranging Market?
To stay informed about further developments, trends, and reports in the Oil and Gas Magnetic Ranging Market, consider subscribing to industry newsletters, following relevant companies and organizations, or regularly checking reputable industry news sources and publications.
Methodology
Step 1 - Identification of Relevant Samples Size from Population Database


Step 2 - Approaches for Defining Global Market Size (Value, Volume* & Price*)

Note*: In applicable scenarios
Step 3 - Data Sources
Primary Research
- Web Analytics
- Survey Reports
- Research Institute
- Latest Research Reports
- Opinion Leaders
Secondary Research
- Annual Reports
- White Paper
- Latest Press Release
- Industry Association
- Paid Database
- Investor Presentations

Step 4 - Data Triangulation
Involves using different sources of information in order to increase the validity of a study
These sources are likely to be stakeholders in a program - participants, other researchers, program staff, other community members, and so on.
Then we put all data in single framework & apply various statistical tools to find out the dynamic on the market.
During the analysis stage, feedback from the stakeholder groups would be compared to determine areas of agreement as well as areas of divergence