

Key Insights
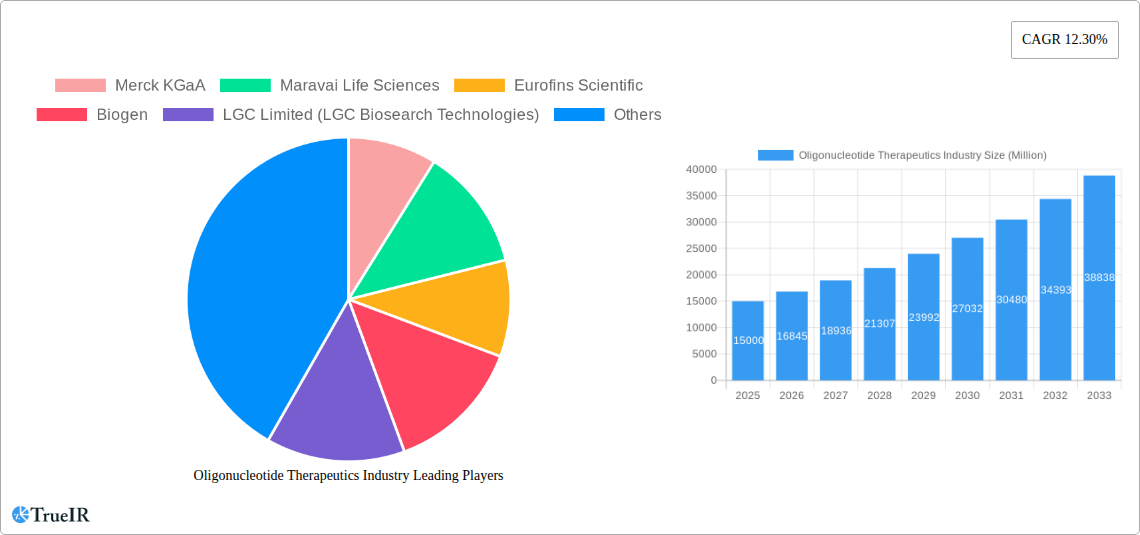
The oligonucleotide therapeutics market is experiencing robust growth, driven by advancements in drug delivery systems, a rising prevalence of genetic disorders, and increasing investments in research and development. The market's Compound Annual Growth Rate (CAGR) of 12.30% from 2019 to 2024 indicates a significant upward trajectory. This growth is fueled by the expanding applications of oligonucleotides in various therapeutic areas, including cancer, cardiovascular diseases, and neurological disorders. The segment showing the most promise is likely therapeutics, given the potential for targeted and personalized treatments. Academic research institutes play a crucial role in driving innovation, while pharmaceutical and biotechnology companies are major investors and commercial players. Key players like Merck KGaA, Maravai Life Sciences, and Thermo Fisher Scientific are actively involved in developing and commercializing oligonucleotide-based therapies, fostering competition and innovation within the market. The North American market currently holds a significant share due to robust regulatory frameworks, a strong presence of key players, and high healthcare expenditure. However, rapidly growing economies in Asia Pacific, specifically China and India, are poised to witness significant growth in the coming years, driven by increasing healthcare spending and rising awareness of genetic diseases. The market is segmented by application (research, diagnostics, therapeutics), end-user (academic institutes, pharmaceutical companies, hospitals), and product type (synthesized oligonucleotides, reagents, equipment, services), allowing for a nuanced understanding of market dynamics. Continued innovation in areas like antisense oligonucleotides, siRNA, and aptamers, coupled with ongoing clinical trials, is expected to further propel market expansion.
The restraints to market growth include high research and development costs, complex manufacturing processes, and potential safety concerns associated with oligonucleotide therapies. Regulatory hurdles and the lengthy approval process for novel therapies also present challenges. However, the potential for personalized medicine and the increasing understanding of genetic underpinnings of diseases are overcoming these challenges. The market is expected to witness a consolidation of players, driven by mergers, acquisitions, and strategic partnerships, as companies strive to expand their product portfolios and market reach. Looking ahead, the forecast period from 2025 to 2033 is anticipated to showcase sustained growth, driven by technological breakthroughs and the continued success of oligonucleotide-based treatments in clinical trials, particularly in areas of unmet medical need. The continued expansion of the market will likely lead to greater investment in infrastructure, specialized equipment, and skilled personnel involved in the oligonucleotide development and manufacturing process.
Oligonucleotide Therapeutics Market Report: 2019-2033
This comprehensive report provides a detailed analysis of the oligonucleotide therapeutics industry, encompassing market size, growth drivers, competitive landscape, and future outlook from 2019 to 2033. The study period covers 2019-2024 (historical period), with 2025 as the base and estimated year, and forecasts extending to 2033. This report is crucial for investors, industry professionals, and researchers seeking to understand and capitalize on the burgeoning opportunities within this dynamic sector. The market is valued at xx Million in 2025 and is projected to reach xx Million by 2033, exhibiting a robust CAGR of xx%.
Oligonucleotide Therapeutics Industry Market Structure & Competitive Landscape
The oligonucleotide therapeutics market is characterized by a moderately concentrated structure, with several key players dominating the landscape. While a precise concentration ratio is difficult to calculate without detailed revenue data for every participant, the presence of established pharmaceutical giants like Merck KGaA and Biogen alongside specialized oligonucleotide manufacturers such as Maravai Life Sciences and GenScript suggests a competitive yet concentrated market. Innovation is a key driver, fueled by advancements in oligonucleotide chemistry, delivery systems (e.g., lipid nanoparticles), and therapeutic applications. Regulatory approvals, particularly from agencies like the FDA, significantly impact market growth. Product substitutes, although limited, include traditional small molecule drugs and protein-based therapeutics. End-user segmentation is predominantly driven by pharmaceutical and biotechnology companies, followed by academic research institutes and hospital & diagnostic laboratories. M&A activity has been steadily increasing, reflecting the significant growth potential and strategic consolidation efforts observed within the last five years, with an estimated volume of xx M&A deals concluded during the period of 2019-2024. Further qualitative analysis will explore specific deals and their implications on the overall market dynamics.
- Market Concentration: Moderately concentrated, with key players holding significant market share.
- Innovation Drivers: Advancements in oligonucleotide chemistry, delivery systems, and therapeutic applications.
- Regulatory Impacts: Stringent regulatory approvals influence market entry and growth.
- Product Substitutes: Limited, mainly traditional small molecules and protein therapeutics.
- End-User Segmentation: Pharmaceutical and Biotechnology Companies, Academic Research Institutes, Hospital and Diagnostic Laboratories.
- M&A Trends: Increasing M&A activity indicating market consolidation and growth potential.
Oligonucleotide Therapeutics Industry Market Trends & Opportunities
The oligonucleotide therapeutics market is experiencing exponential growth driven by several converging factors. The market size is expanding at a remarkable pace, driven by increasing demand for novel therapeutics, rising prevalence of chronic diseases like cancer and genetic disorders, and ongoing research leading to the discovery of innovative oligonucleotide-based treatments. Technological advancements such as improved oligonucleotide synthesis techniques, targeted delivery mechanisms, and enhanced efficacy are further accelerating market expansion. Consumer preferences are shifting toward personalized medicine approaches, with oligonucleotide therapeutics well-positioned to cater to these needs. Competitive dynamics are marked by strategic alliances, collaborations, and investments in R&D, pushing boundaries for more effective and targeted therapies. The increasing prevalence of genetic disorders and the subsequent demand for advanced gene-editing therapies is a key market driver, contributing significantly to the high CAGR. The market penetration rate for oligonucleotide therapeutics, while still relatively low compared to other therapeutic classes, is steadily increasing due to successful clinical trials and approvals.

Dominant Markets & Segments in Oligonucleotide Therapeutics Industry
The North American region currently dominates the oligonucleotide therapeutics market, followed by Europe. This dominance is attributed to a robust healthcare infrastructure, substantial investments in research and development, and the presence of major pharmaceutical and biotechnology companies. Within the application segment, therapeutics holds the largest market share due to its pivotal role in treating various diseases. Pharmaceutical and biotechnology companies comprise the largest end-user segment, owing to their extensive involvement in drug discovery, development, and commercialization. The synthesized oligonucleotide products segment dominates the product type category, fueled by advancements in manufacturing capabilities.
- Key Growth Drivers:
- North America: Robust healthcare infrastructure, significant R&D investments.
- Europe: Growing prevalence of chronic diseases, supportive regulatory environment.
- Asia-Pacific: Rising healthcare expenditure, increasing government initiatives.
- Therapeutics Application: High demand for novel disease treatments.
- Pharmaceutical & Biotech Companies: Extensive involvement in drug development and commercialization.
- Synthesized Oligonucleotide Products: Advancements in manufacturing & scalability.
Oligonucleotide Therapeutics Industry Product Analysis
Product innovation in the oligonucleotide therapeutics space is rapid, focusing on enhancing efficacy, improving delivery systems, and expanding therapeutic applications. New generations of antisense oligonucleotides (ASOs), small interfering RNAs (siRNAs), and microRNAs (miRNAs) are constantly emerging, demonstrating improved potency, reduced off-target effects, and expanded therapeutic applications. The key competitive advantage lies in the ability to offer tailored oligonucleotide-based therapies targeting specific disease mechanisms, offering personalized treatment options. These advancements allow for more targeted therapies, reduced side effects, and a better treatment outlook for various diseases.
Key Drivers, Barriers & Challenges in Oligonucleotide Therapeutics Industry
Key Drivers: Technological advancements in oligonucleotide synthesis, delivery systems, and targeted therapies are accelerating growth. The rising prevalence of chronic and genetic diseases fuels demand for novel treatments. Favorable regulatory frameworks and increased investment in R&D also contribute to the market's expansion.
Challenges: High development costs, stringent regulatory pathways, and potential off-target effects pose significant challenges. Supply chain complexities and competition from other therapeutic modalities further constrain market growth. The estimated cost of bringing a single oligonucleotide-based therapy to market ranges from xx Million to xx Million, creating a substantial barrier to entry.
Growth Drivers in the Oligonucleotide Therapeutics Industry Market
Technological advancements in oligonucleotide synthesis, delivery systems, and targeted therapies are primary drivers. The increasing prevalence of chronic and genetic diseases fuels the demand for novel treatments. Favorable regulatory frameworks and increased investments in research and development contribute to market expansion.
Challenges Impacting Oligonucleotide Therapeutics Industry Growth
Stringent regulatory pathways, high development costs, and potential off-target effects hinder market growth. Supply chain complexities, competition from other therapeutic modalities, and manufacturing scalability issues also pose significant challenges.
Key Players Shaping the Oligonucleotide Therapeutics Industry Market
- Merck KGaA
- Maravai Life Sciences
- Eurofins Scientific
- Biogen
- LGC Limited (LGC Biosearch Technologies)
- Danaher Corporation
- GenScript
- Sarepta Therapeutics Inc
- Thermo Fisher Scientific
- Bio-Synthesis Inc
- Agilent Technologies
- Kaneka Corporation (Eurogentec)
Significant Oligonucleotide Therapeutics Industry Milestones
- July 2022: WuXi STA launched a new large-scale oligonucleotide and peptide manufacturing facility, enhancing capacity to meet growing global demand.
- April 2022: Bachem collaborated with Eli Lilly & Company to develop and manufacture oligonucleotide-based active pharmaceutical ingredients, showcasing the growing importance of oligonucleotide-based therapies.
Future Outlook for Oligonucleotide Therapeutics Industry Market
The oligonucleotide therapeutics market is poised for sustained growth, driven by continuous technological advancements, increasing disease prevalence, and expanding therapeutic applications. Strategic collaborations, investments in R&D, and the potential for personalized medicine approaches will further fuel market expansion, creating lucrative opportunities for industry players and investors alike. The market is expected to witness significant growth over the forecast period, driven by factors mentioned above and the ongoing efforts to address limitations in oligonucleotide delivery and manufacturing.
Oligonucleotide Therapeutics Industry Segmentation
-
1. Product Type
- 1.1. Synthesized Oligonucleotide Products
- 1.2. Reagents
- 1.3. Equipment
- 1.4. Services
-
2. Application
- 2.1. Research
- 2.2. Diagnostics
- 2.3. Therapeutics
-
3. End-user
- 3.1. Academic Research Institutes
- 3.2. Pharmaceutical and Biotechnology Companies
- 3.3. Hospital and Diagnostic Laboratories
Oligonucleotide Therapeutics Industry Segmentation By Geography
-
1. North America
- 1.1. United States
- 1.2. Canada
- 1.3. Mexico
-
2. Europe
- 2.1. Germany
- 2.2. United Kingdom
- 2.3. France
- 2.4. Italy
- 2.5. Spain
- 2.6. Rest of Europe
-
3. Asia Pacific
- 3.1. China
- 3.2. Japan
- 3.3. India
- 3.4. Australia
- 3.5. South Korea
- 3.6. Rest of Asia Pacific
-
4. Middle East and Africa
- 4.1. GCC
- 4.2. South Africa
- 4.3. Rest of Middle East and Africa
-
5. South America
- 5.1. Brazil
- 5.2. Argentina
- 5.3. Rest of South America

Oligonucleotide Therapeutics Industry REPORT HIGHLIGHTS
| Aspects | Details |
|---|---|
| Study Period | 2019-2033 |
| Base Year | 2024 |
| Estimated Year | 2025 |
| Forecast Period | 2025-2033 |
| Historical Period | 2019-2024 |
| Growth Rate | CAGR of 12.30% from 2019-2033 |
| Segmentation |
|
Table of Contents
- 1. Introduction
- 1.1. Research Scope
- 1.2. Market Segmentation
- 1.3. Research Methodology
- 1.4. Definitions and Assumptions
- 2. Executive Summary
- 2.1. Introduction
- 3. Market Dynamics
- 3.1. Introduction
- 3.2. Market Drivers
- 3.2.1. Increasing Government Investments and R&D Expenditure in Pharmaceutical and Biotechnology Companies; The Use of Synthesized Oligonucleotides in Molecular Diagnostics and Clinical Applications
- 3.3. Market Restrains
- 3.3.1. High Treatment Cost of Oligonucleotides; Lack of Skilled Professionals and Research Support in Undeveloped Countries
- 3.4. Market Trends
- 3.4.1. Therapeutic Segment Expected to Register a High CAGR
- 4. Market Factor Analysis
- 4.1. Porters Five Forces
- 4.2. Supply/Value Chain
- 4.3. PESTEL analysis
- 4.4. Market Entropy
- 4.5. Patent/Trademark Analysis
- 5. Global Oligonucleotide Therapeutics Industry Analysis, Insights and Forecast, 2019-2031
- 5.1. Market Analysis, Insights and Forecast - by Product Type
- 5.1.1. Synthesized Oligonucleotide Products
- 5.1.2. Reagents
- 5.1.3. Equipment
- 5.1.4. Services
- 5.2. Market Analysis, Insights and Forecast - by Application
- 5.2.1. Research
- 5.2.2. Diagnostics
- 5.2.3. Therapeutics
- 5.3. Market Analysis, Insights and Forecast - by End-user
- 5.3.1. Academic Research Institutes
- 5.3.2. Pharmaceutical and Biotechnology Companies
- 5.3.3. Hospital and Diagnostic Laboratories
- 5.4. Market Analysis, Insights and Forecast - by Region
- 5.4.1. North America
- 5.4.2. Europe
- 5.4.3. Asia Pacific
- 5.4.4. Middle East and Africa
- 5.4.5. South America
- 5.1. Market Analysis, Insights and Forecast - by Product Type
- 6. North America Oligonucleotide Therapeutics Industry Analysis, Insights and Forecast, 2019-2031
- 6.1. Market Analysis, Insights and Forecast - by Product Type
- 6.1.1. Synthesized Oligonucleotide Products
- 6.1.2. Reagents
- 6.1.3. Equipment
- 6.1.4. Services
- 6.2. Market Analysis, Insights and Forecast - by Application
- 6.2.1. Research
- 6.2.2. Diagnostics
- 6.2.3. Therapeutics
- 6.3. Market Analysis, Insights and Forecast - by End-user
- 6.3.1. Academic Research Institutes
- 6.3.2. Pharmaceutical and Biotechnology Companies
- 6.3.3. Hospital and Diagnostic Laboratories
- 6.1. Market Analysis, Insights and Forecast - by Product Type
- 7. Europe Oligonucleotide Therapeutics Industry Analysis, Insights and Forecast, 2019-2031
- 7.1. Market Analysis, Insights and Forecast - by Product Type
- 7.1.1. Synthesized Oligonucleotide Products
- 7.1.2. Reagents
- 7.1.3. Equipment
- 7.1.4. Services
- 7.2. Market Analysis, Insights and Forecast - by Application
- 7.2.1. Research
- 7.2.2. Diagnostics
- 7.2.3. Therapeutics
- 7.3. Market Analysis, Insights and Forecast - by End-user
- 7.3.1. Academic Research Institutes
- 7.3.2. Pharmaceutical and Biotechnology Companies
- 7.3.3. Hospital and Diagnostic Laboratories
- 7.1. Market Analysis, Insights and Forecast - by Product Type
- 8. Asia Pacific Oligonucleotide Therapeutics Industry Analysis, Insights and Forecast, 2019-2031
- 8.1. Market Analysis, Insights and Forecast - by Product Type
- 8.1.1. Synthesized Oligonucleotide Products
- 8.1.2. Reagents
- 8.1.3. Equipment
- 8.1.4. Services
- 8.2. Market Analysis, Insights and Forecast - by Application
- 8.2.1. Research
- 8.2.2. Diagnostics
- 8.2.3. Therapeutics
- 8.3. Market Analysis, Insights and Forecast - by End-user
- 8.3.1. Academic Research Institutes
- 8.3.2. Pharmaceutical and Biotechnology Companies
- 8.3.3. Hospital and Diagnostic Laboratories
- 8.1. Market Analysis, Insights and Forecast - by Product Type
- 9. Middle East and Africa Oligonucleotide Therapeutics Industry Analysis, Insights and Forecast, 2019-2031
- 9.1. Market Analysis, Insights and Forecast - by Product Type
- 9.1.1. Synthesized Oligonucleotide Products
- 9.1.2. Reagents
- 9.1.3. Equipment
- 9.1.4. Services
- 9.2. Market Analysis, Insights and Forecast - by Application
- 9.2.1. Research
- 9.2.2. Diagnostics
- 9.2.3. Therapeutics
- 9.3. Market Analysis, Insights and Forecast - by End-user
- 9.3.1. Academic Research Institutes
- 9.3.2. Pharmaceutical and Biotechnology Companies
- 9.3.3. Hospital and Diagnostic Laboratories
- 9.1. Market Analysis, Insights and Forecast - by Product Type
- 10. South America Oligonucleotide Therapeutics Industry Analysis, Insights and Forecast, 2019-2031
- 10.1. Market Analysis, Insights and Forecast - by Product Type
- 10.1.1. Synthesized Oligonucleotide Products
- 10.1.2. Reagents
- 10.1.3. Equipment
- 10.1.4. Services
- 10.2. Market Analysis, Insights and Forecast - by Application
- 10.2.1. Research
- 10.2.2. Diagnostics
- 10.2.3. Therapeutics
- 10.3. Market Analysis, Insights and Forecast - by End-user
- 10.3.1. Academic Research Institutes
- 10.3.2. Pharmaceutical and Biotechnology Companies
- 10.3.3. Hospital and Diagnostic Laboratories
- 10.1. Market Analysis, Insights and Forecast - by Product Type
- 11. North America Oligonucleotide Therapeutics Industry Analysis, Insights and Forecast, 2019-2031
- 11.1. Market Analysis, Insights and Forecast - By Country/Sub-region
- 11.1.1 United States
- 11.1.2 Canada
- 11.1.3 Mexico
- 12. Europe Oligonucleotide Therapeutics Industry Analysis, Insights and Forecast, 2019-2031
- 12.1. Market Analysis, Insights and Forecast - By Country/Sub-region
- 12.1.1 Germany
- 12.1.2 United Kingdom
- 12.1.3 France
- 12.1.4 Italy
- 12.1.5 Spain
- 12.1.6 Rest of Europe
- 13. Asia Pacific Oligonucleotide Therapeutics Industry Analysis, Insights and Forecast, 2019-2031
- 13.1. Market Analysis, Insights and Forecast - By Country/Sub-region
- 13.1.1 China
- 13.1.2 Japan
- 13.1.3 India
- 13.1.4 Australia
- 13.1.5 South Korea
- 13.1.6 Rest of Asia Pacific
- 14. Middle East and Africa Oligonucleotide Therapeutics Industry Analysis, Insights and Forecast, 2019-2031
- 14.1. Market Analysis, Insights and Forecast - By Country/Sub-region
- 14.1.1 GCC
- 14.1.2 South Africa
- 14.1.3 Rest of Middle East and Africa
- 15. South America Oligonucleotide Therapeutics Industry Analysis, Insights and Forecast, 2019-2031
- 15.1. Market Analysis, Insights and Forecast - By Country/Sub-region
- 15.1.1 Brazil
- 15.1.2 Argentina
- 15.1.3 Rest of South America
- 16. Competitive Analysis
- 16.1. Global Market Share Analysis 2024
- 16.2. Company Profiles
- 16.2.1 Merck KGaA
- 16.2.1.1. Overview
- 16.2.1.2. Products
- 16.2.1.3. SWOT Analysis
- 16.2.1.4. Recent Developments
- 16.2.1.5. Financials (Based on Availability)
- 16.2.2 Maravai Life Sciences
- 16.2.2.1. Overview
- 16.2.2.2. Products
- 16.2.2.3. SWOT Analysis
- 16.2.2.4. Recent Developments
- 16.2.2.5. Financials (Based on Availability)
- 16.2.3 Eurofins Scientific
- 16.2.3.1. Overview
- 16.2.3.2. Products
- 16.2.3.3. SWOT Analysis
- 16.2.3.4. Recent Developments
- 16.2.3.5. Financials (Based on Availability)
- 16.2.4 Biogen
- 16.2.4.1. Overview
- 16.2.4.2. Products
- 16.2.4.3. SWOT Analysis
- 16.2.4.4. Recent Developments
- 16.2.4.5. Financials (Based on Availability)
- 16.2.5 LGC Limited (LGC Biosearch Technologies)
- 16.2.5.1. Overview
- 16.2.5.2. Products
- 16.2.5.3. SWOT Analysis
- 16.2.5.4. Recent Developments
- 16.2.5.5. Financials (Based on Availability)
- 16.2.6 Danaher Corporation
- 16.2.6.1. Overview
- 16.2.6.2. Products
- 16.2.6.3. SWOT Analysis
- 16.2.6.4. Recent Developments
- 16.2.6.5. Financials (Based on Availability)
- 16.2.7 GenScript
- 16.2.7.1. Overview
- 16.2.7.2. Products
- 16.2.7.3. SWOT Analysis
- 16.2.7.4. Recent Developments
- 16.2.7.5. Financials (Based on Availability)
- 16.2.8 Sarepta Therapeutics Inc
- 16.2.8.1. Overview
- 16.2.8.2. Products
- 16.2.8.3. SWOT Analysis
- 16.2.8.4. Recent Developments
- 16.2.8.5. Financials (Based on Availability)
- 16.2.9 Thermo Fisher Scientific
- 16.2.9.1. Overview
- 16.2.9.2. Products
- 16.2.9.3. SWOT Analysis
- 16.2.9.4. Recent Developments
- 16.2.9.5. Financials (Based on Availability)
- 16.2.10 Bio-Synthesis Inc
- 16.2.10.1. Overview
- 16.2.10.2. Products
- 16.2.10.3. SWOT Analysis
- 16.2.10.4. Recent Developments
- 16.2.10.5. Financials (Based on Availability)
- 16.2.11 Agilent Technologies
- 16.2.11.1. Overview
- 16.2.11.2. Products
- 16.2.11.3. SWOT Analysis
- 16.2.11.4. Recent Developments
- 16.2.11.5. Financials (Based on Availability)
- 16.2.12 Kaneka Corporation (Eurogentec)
- 16.2.12.1. Overview
- 16.2.12.2. Products
- 16.2.12.3. SWOT Analysis
- 16.2.12.4. Recent Developments
- 16.2.12.5. Financials (Based on Availability)
- 16.2.1 Merck KGaA
List of Figures
- Figure 1: Global Oligonucleotide Therapeutics Industry Revenue Breakdown (Million, %) by Region 2024 & 2032
- Figure 2: Global Oligonucleotide Therapeutics Industry Volume Breakdown (K Unit, %) by Region 2024 & 2032
- Figure 3: North America Oligonucleotide Therapeutics Industry Revenue (Million), by Country 2024 & 2032
- Figure 4: North America Oligonucleotide Therapeutics Industry Volume (K Unit), by Country 2024 & 2032
- Figure 5: North America Oligonucleotide Therapeutics Industry Revenue Share (%), by Country 2024 & 2032
- Figure 6: North America Oligonucleotide Therapeutics Industry Volume Share (%), by Country 2024 & 2032
- Figure 7: Europe Oligonucleotide Therapeutics Industry Revenue (Million), by Country 2024 & 2032
- Figure 8: Europe Oligonucleotide Therapeutics Industry Volume (K Unit), by Country 2024 & 2032
- Figure 9: Europe Oligonucleotide Therapeutics Industry Revenue Share (%), by Country 2024 & 2032
- Figure 10: Europe Oligonucleotide Therapeutics Industry Volume Share (%), by Country 2024 & 2032
- Figure 11: Asia Pacific Oligonucleotide Therapeutics Industry Revenue (Million), by Country 2024 & 2032
- Figure 12: Asia Pacific Oligonucleotide Therapeutics Industry Volume (K Unit), by Country 2024 & 2032
- Figure 13: Asia Pacific Oligonucleotide Therapeutics Industry Revenue Share (%), by Country 2024 & 2032
- Figure 14: Asia Pacific Oligonucleotide Therapeutics Industry Volume Share (%), by Country 2024 & 2032
- Figure 15: Middle East and Africa Oligonucleotide Therapeutics Industry Revenue (Million), by Country 2024 & 2032
- Figure 16: Middle East and Africa Oligonucleotide Therapeutics Industry Volume (K Unit), by Country 2024 & 2032
- Figure 17: Middle East and Africa Oligonucleotide Therapeutics Industry Revenue Share (%), by Country 2024 & 2032
- Figure 18: Middle East and Africa Oligonucleotide Therapeutics Industry Volume Share (%), by Country 2024 & 2032
- Figure 19: South America Oligonucleotide Therapeutics Industry Revenue (Million), by Country 2024 & 2032
- Figure 20: South America Oligonucleotide Therapeutics Industry Volume (K Unit), by Country 2024 & 2032
- Figure 21: South America Oligonucleotide Therapeutics Industry Revenue Share (%), by Country 2024 & 2032
- Figure 22: South America Oligonucleotide Therapeutics Industry Volume Share (%), by Country 2024 & 2032
- Figure 23: North America Oligonucleotide Therapeutics Industry Revenue (Million), by Product Type 2024 & 2032
- Figure 24: North America Oligonucleotide Therapeutics Industry Volume (K Unit), by Product Type 2024 & 2032
- Figure 25: North America Oligonucleotide Therapeutics Industry Revenue Share (%), by Product Type 2024 & 2032
- Figure 26: North America Oligonucleotide Therapeutics Industry Volume Share (%), by Product Type 2024 & 2032
- Figure 27: North America Oligonucleotide Therapeutics Industry Revenue (Million), by Application 2024 & 2032
- Figure 28: North America Oligonucleotide Therapeutics Industry Volume (K Unit), by Application 2024 & 2032
- Figure 29: North America Oligonucleotide Therapeutics Industry Revenue Share (%), by Application 2024 & 2032
- Figure 30: North America Oligonucleotide Therapeutics Industry Volume Share (%), by Application 2024 & 2032
- Figure 31: North America Oligonucleotide Therapeutics Industry Revenue (Million), by End-user 2024 & 2032
- Figure 32: North America Oligonucleotide Therapeutics Industry Volume (K Unit), by End-user 2024 & 2032
- Figure 33: North America Oligonucleotide Therapeutics Industry Revenue Share (%), by End-user 2024 & 2032
- Figure 34: North America Oligonucleotide Therapeutics Industry Volume Share (%), by End-user 2024 & 2032
- Figure 35: North America Oligonucleotide Therapeutics Industry Revenue (Million), by Country 2024 & 2032
- Figure 36: North America Oligonucleotide Therapeutics Industry Volume (K Unit), by Country 2024 & 2032
- Figure 37: North America Oligonucleotide Therapeutics Industry Revenue Share (%), by Country 2024 & 2032
- Figure 38: North America Oligonucleotide Therapeutics Industry Volume Share (%), by Country 2024 & 2032
- Figure 39: Europe Oligonucleotide Therapeutics Industry Revenue (Million), by Product Type 2024 & 2032
- Figure 40: Europe Oligonucleotide Therapeutics Industry Volume (K Unit), by Product Type 2024 & 2032
- Figure 41: Europe Oligonucleotide Therapeutics Industry Revenue Share (%), by Product Type 2024 & 2032
- Figure 42: Europe Oligonucleotide Therapeutics Industry Volume Share (%), by Product Type 2024 & 2032
- Figure 43: Europe Oligonucleotide Therapeutics Industry Revenue (Million), by Application 2024 & 2032
- Figure 44: Europe Oligonucleotide Therapeutics Industry Volume (K Unit), by Application 2024 & 2032
- Figure 45: Europe Oligonucleotide Therapeutics Industry Revenue Share (%), by Application 2024 & 2032
- Figure 46: Europe Oligonucleotide Therapeutics Industry Volume Share (%), by Application 2024 & 2032
- Figure 47: Europe Oligonucleotide Therapeutics Industry Revenue (Million), by End-user 2024 & 2032
- Figure 48: Europe Oligonucleotide Therapeutics Industry Volume (K Unit), by End-user 2024 & 2032
- Figure 49: Europe Oligonucleotide Therapeutics Industry Revenue Share (%), by End-user 2024 & 2032
- Figure 50: Europe Oligonucleotide Therapeutics Industry Volume Share (%), by End-user 2024 & 2032
- Figure 51: Europe Oligonucleotide Therapeutics Industry Revenue (Million), by Country 2024 & 2032
- Figure 52: Europe Oligonucleotide Therapeutics Industry Volume (K Unit), by Country 2024 & 2032
- Figure 53: Europe Oligonucleotide Therapeutics Industry Revenue Share (%), by Country 2024 & 2032
- Figure 54: Europe Oligonucleotide Therapeutics Industry Volume Share (%), by Country 2024 & 2032
- Figure 55: Asia Pacific Oligonucleotide Therapeutics Industry Revenue (Million), by Product Type 2024 & 2032
- Figure 56: Asia Pacific Oligonucleotide Therapeutics Industry Volume (K Unit), by Product Type 2024 & 2032
- Figure 57: Asia Pacific Oligonucleotide Therapeutics Industry Revenue Share (%), by Product Type 2024 & 2032
- Figure 58: Asia Pacific Oligonucleotide Therapeutics Industry Volume Share (%), by Product Type 2024 & 2032
- Figure 59: Asia Pacific Oligonucleotide Therapeutics Industry Revenue (Million), by Application 2024 & 2032
- Figure 60: Asia Pacific Oligonucleotide Therapeutics Industry Volume (K Unit), by Application 2024 & 2032
- Figure 61: Asia Pacific Oligonucleotide Therapeutics Industry Revenue Share (%), by Application 2024 & 2032
- Figure 62: Asia Pacific Oligonucleotide Therapeutics Industry Volume Share (%), by Application 2024 & 2032
- Figure 63: Asia Pacific Oligonucleotide Therapeutics Industry Revenue (Million), by End-user 2024 & 2032
- Figure 64: Asia Pacific Oligonucleotide Therapeutics Industry Volume (K Unit), by End-user 2024 & 2032
- Figure 65: Asia Pacific Oligonucleotide Therapeutics Industry Revenue Share (%), by End-user 2024 & 2032
- Figure 66: Asia Pacific Oligonucleotide Therapeutics Industry Volume Share (%), by End-user 2024 & 2032
- Figure 67: Asia Pacific Oligonucleotide Therapeutics Industry Revenue (Million), by Country 2024 & 2032
- Figure 68: Asia Pacific Oligonucleotide Therapeutics Industry Volume (K Unit), by Country 2024 & 2032
- Figure 69: Asia Pacific Oligonucleotide Therapeutics Industry Revenue Share (%), by Country 2024 & 2032
- Figure 70: Asia Pacific Oligonucleotide Therapeutics Industry Volume Share (%), by Country 2024 & 2032
- Figure 71: Middle East and Africa Oligonucleotide Therapeutics Industry Revenue (Million), by Product Type 2024 & 2032
- Figure 72: Middle East and Africa Oligonucleotide Therapeutics Industry Volume (K Unit), by Product Type 2024 & 2032
- Figure 73: Middle East and Africa Oligonucleotide Therapeutics Industry Revenue Share (%), by Product Type 2024 & 2032
- Figure 74: Middle East and Africa Oligonucleotide Therapeutics Industry Volume Share (%), by Product Type 2024 & 2032
- Figure 75: Middle East and Africa Oligonucleotide Therapeutics Industry Revenue (Million), by Application 2024 & 2032
- Figure 76: Middle East and Africa Oligonucleotide Therapeutics Industry Volume (K Unit), by Application 2024 & 2032
- Figure 77: Middle East and Africa Oligonucleotide Therapeutics Industry Revenue Share (%), by Application 2024 & 2032
- Figure 78: Middle East and Africa Oligonucleotide Therapeutics Industry Volume Share (%), by Application 2024 & 2032
- Figure 79: Middle East and Africa Oligonucleotide Therapeutics Industry Revenue (Million), by End-user 2024 & 2032
- Figure 80: Middle East and Africa Oligonucleotide Therapeutics Industry Volume (K Unit), by End-user 2024 & 2032
- Figure 81: Middle East and Africa Oligonucleotide Therapeutics Industry Revenue Share (%), by End-user 2024 & 2032
- Figure 82: Middle East and Africa Oligonucleotide Therapeutics Industry Volume Share (%), by End-user 2024 & 2032
- Figure 83: Middle East and Africa Oligonucleotide Therapeutics Industry Revenue (Million), by Country 2024 & 2032
- Figure 84: Middle East and Africa Oligonucleotide Therapeutics Industry Volume (K Unit), by Country 2024 & 2032
- Figure 85: Middle East and Africa Oligonucleotide Therapeutics Industry Revenue Share (%), by Country 2024 & 2032
- Figure 86: Middle East and Africa Oligonucleotide Therapeutics Industry Volume Share (%), by Country 2024 & 2032
- Figure 87: South America Oligonucleotide Therapeutics Industry Revenue (Million), by Product Type 2024 & 2032
- Figure 88: South America Oligonucleotide Therapeutics Industry Volume (K Unit), by Product Type 2024 & 2032
- Figure 89: South America Oligonucleotide Therapeutics Industry Revenue Share (%), by Product Type 2024 & 2032
- Figure 90: South America Oligonucleotide Therapeutics Industry Volume Share (%), by Product Type 2024 & 2032
- Figure 91: South America Oligonucleotide Therapeutics Industry Revenue (Million), by Application 2024 & 2032
- Figure 92: South America Oligonucleotide Therapeutics Industry Volume (K Unit), by Application 2024 & 2032
- Figure 93: South America Oligonucleotide Therapeutics Industry Revenue Share (%), by Application 2024 & 2032
- Figure 94: South America Oligonucleotide Therapeutics Industry Volume Share (%), by Application 2024 & 2032
- Figure 95: South America Oligonucleotide Therapeutics Industry Revenue (Million), by End-user 2024 & 2032
- Figure 96: South America Oligonucleotide Therapeutics Industry Volume (K Unit), by End-user 2024 & 2032
- Figure 97: South America Oligonucleotide Therapeutics Industry Revenue Share (%), by End-user 2024 & 2032
- Figure 98: South America Oligonucleotide Therapeutics Industry Volume Share (%), by End-user 2024 & 2032
- Figure 99: South America Oligonucleotide Therapeutics Industry Revenue (Million), by Country 2024 & 2032
- Figure 100: South America Oligonucleotide Therapeutics Industry Volume (K Unit), by Country 2024 & 2032
- Figure 101: South America Oligonucleotide Therapeutics Industry Revenue Share (%), by Country 2024 & 2032
- Figure 102: South America Oligonucleotide Therapeutics Industry Volume Share (%), by Country 2024 & 2032
List of Tables
- Table 1: Global Oligonucleotide Therapeutics Industry Revenue Million Forecast, by Region 2019 & 2032
- Table 2: Global Oligonucleotide Therapeutics Industry Volume K Unit Forecast, by Region 2019 & 2032
- Table 3: Global Oligonucleotide Therapeutics Industry Revenue Million Forecast, by Product Type 2019 & 2032
- Table 4: Global Oligonucleotide Therapeutics Industry Volume K Unit Forecast, by Product Type 2019 & 2032
- Table 5: Global Oligonucleotide Therapeutics Industry Revenue Million Forecast, by Application 2019 & 2032
- Table 6: Global Oligonucleotide Therapeutics Industry Volume K Unit Forecast, by Application 2019 & 2032
- Table 7: Global Oligonucleotide Therapeutics Industry Revenue Million Forecast, by End-user 2019 & 2032
- Table 8: Global Oligonucleotide Therapeutics Industry Volume K Unit Forecast, by End-user 2019 & 2032
- Table 9: Global Oligonucleotide Therapeutics Industry Revenue Million Forecast, by Region 2019 & 2032
- Table 10: Global Oligonucleotide Therapeutics Industry Volume K Unit Forecast, by Region 2019 & 2032
- Table 11: Global Oligonucleotide Therapeutics Industry Revenue Million Forecast, by Country 2019 & 2032
- Table 12: Global Oligonucleotide Therapeutics Industry Volume K Unit Forecast, by Country 2019 & 2032
- Table 13: United States Oligonucleotide Therapeutics Industry Revenue (Million) Forecast, by Application 2019 & 2032
- Table 14: United States Oligonucleotide Therapeutics Industry Volume (K Unit) Forecast, by Application 2019 & 2032
- Table 15: Canada Oligonucleotide Therapeutics Industry Revenue (Million) Forecast, by Application 2019 & 2032
- Table 16: Canada Oligonucleotide Therapeutics Industry Volume (K Unit) Forecast, by Application 2019 & 2032
- Table 17: Mexico Oligonucleotide Therapeutics Industry Revenue (Million) Forecast, by Application 2019 & 2032
- Table 18: Mexico Oligonucleotide Therapeutics Industry Volume (K Unit) Forecast, by Application 2019 & 2032
- Table 19: Global Oligonucleotide Therapeutics Industry Revenue Million Forecast, by Country 2019 & 2032
- Table 20: Global Oligonucleotide Therapeutics Industry Volume K Unit Forecast, by Country 2019 & 2032
- Table 21: Germany Oligonucleotide Therapeutics Industry Revenue (Million) Forecast, by Application 2019 & 2032
- Table 22: Germany Oligonucleotide Therapeutics Industry Volume (K Unit) Forecast, by Application 2019 & 2032
- Table 23: United Kingdom Oligonucleotide Therapeutics Industry Revenue (Million) Forecast, by Application 2019 & 2032
- Table 24: United Kingdom Oligonucleotide Therapeutics Industry Volume (K Unit) Forecast, by Application 2019 & 2032
- Table 25: France Oligonucleotide Therapeutics Industry Revenue (Million) Forecast, by Application 2019 & 2032
- Table 26: France Oligonucleotide Therapeutics Industry Volume (K Unit) Forecast, by Application 2019 & 2032
- Table 27: Italy Oligonucleotide Therapeutics Industry Revenue (Million) Forecast, by Application 2019 & 2032
- Table 28: Italy Oligonucleotide Therapeutics Industry Volume (K Unit) Forecast, by Application 2019 & 2032
- Table 29: Spain Oligonucleotide Therapeutics Industry Revenue (Million) Forecast, by Application 2019 & 2032
- Table 30: Spain Oligonucleotide Therapeutics Industry Volume (K Unit) Forecast, by Application 2019 & 2032
- Table 31: Rest of Europe Oligonucleotide Therapeutics Industry Revenue (Million) Forecast, by Application 2019 & 2032
- Table 32: Rest of Europe Oligonucleotide Therapeutics Industry Volume (K Unit) Forecast, by Application 2019 & 2032
- Table 33: Global Oligonucleotide Therapeutics Industry Revenue Million Forecast, by Country 2019 & 2032
- Table 34: Global Oligonucleotide Therapeutics Industry Volume K Unit Forecast, by Country 2019 & 2032
- Table 35: China Oligonucleotide Therapeutics Industry Revenue (Million) Forecast, by Application 2019 & 2032
- Table 36: China Oligonucleotide Therapeutics Industry Volume (K Unit) Forecast, by Application 2019 & 2032
- Table 37: Japan Oligonucleotide Therapeutics Industry Revenue (Million) Forecast, by Application 2019 & 2032
- Table 38: Japan Oligonucleotide Therapeutics Industry Volume (K Unit) Forecast, by Application 2019 & 2032
- Table 39: India Oligonucleotide Therapeutics Industry Revenue (Million) Forecast, by Application 2019 & 2032
- Table 40: India Oligonucleotide Therapeutics Industry Volume (K Unit) Forecast, by Application 2019 & 2032
- Table 41: Australia Oligonucleotide Therapeutics Industry Revenue (Million) Forecast, by Application 2019 & 2032
- Table 42: Australia Oligonucleotide Therapeutics Industry Volume (K Unit) Forecast, by Application 2019 & 2032
- Table 43: South Korea Oligonucleotide Therapeutics Industry Revenue (Million) Forecast, by Application 2019 & 2032
- Table 44: South Korea Oligonucleotide Therapeutics Industry Volume (K Unit) Forecast, by Application 2019 & 2032
- Table 45: Rest of Asia Pacific Oligonucleotide Therapeutics Industry Revenue (Million) Forecast, by Application 2019 & 2032
- Table 46: Rest of Asia Pacific Oligonucleotide Therapeutics Industry Volume (K Unit) Forecast, by Application 2019 & 2032
- Table 47: Global Oligonucleotide Therapeutics Industry Revenue Million Forecast, by Country 2019 & 2032
- Table 48: Global Oligonucleotide Therapeutics Industry Volume K Unit Forecast, by Country 2019 & 2032
- Table 49: GCC Oligonucleotide Therapeutics Industry Revenue (Million) Forecast, by Application 2019 & 2032
- Table 50: GCC Oligonucleotide Therapeutics Industry Volume (K Unit) Forecast, by Application 2019 & 2032
- Table 51: South Africa Oligonucleotide Therapeutics Industry Revenue (Million) Forecast, by Application 2019 & 2032
- Table 52: South Africa Oligonucleotide Therapeutics Industry Volume (K Unit) Forecast, by Application 2019 & 2032
- Table 53: Rest of Middle East and Africa Oligonucleotide Therapeutics Industry Revenue (Million) Forecast, by Application 2019 & 2032
- Table 54: Rest of Middle East and Africa Oligonucleotide Therapeutics Industry Volume (K Unit) Forecast, by Application 2019 & 2032
- Table 55: Global Oligonucleotide Therapeutics Industry Revenue Million Forecast, by Country 2019 & 2032
- Table 56: Global Oligonucleotide Therapeutics Industry Volume K Unit Forecast, by Country 2019 & 2032
- Table 57: Brazil Oligonucleotide Therapeutics Industry Revenue (Million) Forecast, by Application 2019 & 2032
- Table 58: Brazil Oligonucleotide Therapeutics Industry Volume (K Unit) Forecast, by Application 2019 & 2032
- Table 59: Argentina Oligonucleotide Therapeutics Industry Revenue (Million) Forecast, by Application 2019 & 2032
- Table 60: Argentina Oligonucleotide Therapeutics Industry Volume (K Unit) Forecast, by Application 2019 & 2032
- Table 61: Rest of South America Oligonucleotide Therapeutics Industry Revenue (Million) Forecast, by Application 2019 & 2032
- Table 62: Rest of South America Oligonucleotide Therapeutics Industry Volume (K Unit) Forecast, by Application 2019 & 2032
- Table 63: Global Oligonucleotide Therapeutics Industry Revenue Million Forecast, by Product Type 2019 & 2032
- Table 64: Global Oligonucleotide Therapeutics Industry Volume K Unit Forecast, by Product Type 2019 & 2032
- Table 65: Global Oligonucleotide Therapeutics Industry Revenue Million Forecast, by Application 2019 & 2032
- Table 66: Global Oligonucleotide Therapeutics Industry Volume K Unit Forecast, by Application 2019 & 2032
- Table 67: Global Oligonucleotide Therapeutics Industry Revenue Million Forecast, by End-user 2019 & 2032
- Table 68: Global Oligonucleotide Therapeutics Industry Volume K Unit Forecast, by End-user 2019 & 2032
- Table 69: Global Oligonucleotide Therapeutics Industry Revenue Million Forecast, by Country 2019 & 2032
- Table 70: Global Oligonucleotide Therapeutics Industry Volume K Unit Forecast, by Country 2019 & 2032
- Table 71: United States Oligonucleotide Therapeutics Industry Revenue (Million) Forecast, by Application 2019 & 2032
- Table 72: United States Oligonucleotide Therapeutics Industry Volume (K Unit) Forecast, by Application 2019 & 2032
- Table 73: Canada Oligonucleotide Therapeutics Industry Revenue (Million) Forecast, by Application 2019 & 2032
- Table 74: Canada Oligonucleotide Therapeutics Industry Volume (K Unit) Forecast, by Application 2019 & 2032
- Table 75: Mexico Oligonucleotide Therapeutics Industry Revenue (Million) Forecast, by Application 2019 & 2032
- Table 76: Mexico Oligonucleotide Therapeutics Industry Volume (K Unit) Forecast, by Application 2019 & 2032
- Table 77: Global Oligonucleotide Therapeutics Industry Revenue Million Forecast, by Product Type 2019 & 2032
- Table 78: Global Oligonucleotide Therapeutics Industry Volume K Unit Forecast, by Product Type 2019 & 2032
- Table 79: Global Oligonucleotide Therapeutics Industry Revenue Million Forecast, by Application 2019 & 2032
- Table 80: Global Oligonucleotide Therapeutics Industry Volume K Unit Forecast, by Application 2019 & 2032
- Table 81: Global Oligonucleotide Therapeutics Industry Revenue Million Forecast, by End-user 2019 & 2032
- Table 82: Global Oligonucleotide Therapeutics Industry Volume K Unit Forecast, by End-user 2019 & 2032
- Table 83: Global Oligonucleotide Therapeutics Industry Revenue Million Forecast, by Country 2019 & 2032
- Table 84: Global Oligonucleotide Therapeutics Industry Volume K Unit Forecast, by Country 2019 & 2032
- Table 85: Germany Oligonucleotide Therapeutics Industry Revenue (Million) Forecast, by Application 2019 & 2032
- Table 86: Germany Oligonucleotide Therapeutics Industry Volume (K Unit) Forecast, by Application 2019 & 2032
- Table 87: United Kingdom Oligonucleotide Therapeutics Industry Revenue (Million) Forecast, by Application 2019 & 2032
- Table 88: United Kingdom Oligonucleotide Therapeutics Industry Volume (K Unit) Forecast, by Application 2019 & 2032
- Table 89: France Oligonucleotide Therapeutics Industry Revenue (Million) Forecast, by Application 2019 & 2032
- Table 90: France Oligonucleotide Therapeutics Industry Volume (K Unit) Forecast, by Application 2019 & 2032
- Table 91: Italy Oligonucleotide Therapeutics Industry Revenue (Million) Forecast, by Application 2019 & 2032
- Table 92: Italy Oligonucleotide Therapeutics Industry Volume (K Unit) Forecast, by Application 2019 & 2032
- Table 93: Spain Oligonucleotide Therapeutics Industry Revenue (Million) Forecast, by Application 2019 & 2032
- Table 94: Spain Oligonucleotide Therapeutics Industry Volume (K Unit) Forecast, by Application 2019 & 2032
- Table 95: Rest of Europe Oligonucleotide Therapeutics Industry Revenue (Million) Forecast, by Application 2019 & 2032
- Table 96: Rest of Europe Oligonucleotide Therapeutics Industry Volume (K Unit) Forecast, by Application 2019 & 2032
- Table 97: Global Oligonucleotide Therapeutics Industry Revenue Million Forecast, by Product Type 2019 & 2032
- Table 98: Global Oligonucleotide Therapeutics Industry Volume K Unit Forecast, by Product Type 2019 & 2032
- Table 99: Global Oligonucleotide Therapeutics Industry Revenue Million Forecast, by Application 2019 & 2032
- Table 100: Global Oligonucleotide Therapeutics Industry Volume K Unit Forecast, by Application 2019 & 2032
- Table 101: Global Oligonucleotide Therapeutics Industry Revenue Million Forecast, by End-user 2019 & 2032
- Table 102: Global Oligonucleotide Therapeutics Industry Volume K Unit Forecast, by End-user 2019 & 2032
- Table 103: Global Oligonucleotide Therapeutics Industry Revenue Million Forecast, by Country 2019 & 2032
- Table 104: Global Oligonucleotide Therapeutics Industry Volume K Unit Forecast, by Country 2019 & 2032
- Table 105: China Oligonucleotide Therapeutics Industry Revenue (Million) Forecast, by Application 2019 & 2032
- Table 106: China Oligonucleotide Therapeutics Industry Volume (K Unit) Forecast, by Application 2019 & 2032
- Table 107: Japan Oligonucleotide Therapeutics Industry Revenue (Million) Forecast, by Application 2019 & 2032
- Table 108: Japan Oligonucleotide Therapeutics Industry Volume (K Unit) Forecast, by Application 2019 & 2032
- Table 109: India Oligonucleotide Therapeutics Industry Revenue (Million) Forecast, by Application 2019 & 2032
- Table 110: India Oligonucleotide Therapeutics Industry Volume (K Unit) Forecast, by Application 2019 & 2032
- Table 111: Australia Oligonucleotide Therapeutics Industry Revenue (Million) Forecast, by Application 2019 & 2032
- Table 112: Australia Oligonucleotide Therapeutics Industry Volume (K Unit) Forecast, by Application 2019 & 2032
- Table 113: South Korea Oligonucleotide Therapeutics Industry Revenue (Million) Forecast, by Application 2019 & 2032
- Table 114: South Korea Oligonucleotide Therapeutics Industry Volume (K Unit) Forecast, by Application 2019 & 2032
- Table 115: Rest of Asia Pacific Oligonucleotide Therapeutics Industry Revenue (Million) Forecast, by Application 2019 & 2032
- Table 116: Rest of Asia Pacific Oligonucleotide Therapeutics Industry Volume (K Unit) Forecast, by Application 2019 & 2032
- Table 117: Global Oligonucleotide Therapeutics Industry Revenue Million Forecast, by Product Type 2019 & 2032
- Table 118: Global Oligonucleotide Therapeutics Industry Volume K Unit Forecast, by Product Type 2019 & 2032
- Table 119: Global Oligonucleotide Therapeutics Industry Revenue Million Forecast, by Application 2019 & 2032
- Table 120: Global Oligonucleotide Therapeutics Industry Volume K Unit Forecast, by Application 2019 & 2032
- Table 121: Global Oligonucleotide Therapeutics Industry Revenue Million Forecast, by End-user 2019 & 2032
- Table 122: Global Oligonucleotide Therapeutics Industry Volume K Unit Forecast, by End-user 2019 & 2032
- Table 123: Global Oligonucleotide Therapeutics Industry Revenue Million Forecast, by Country 2019 & 2032
- Table 124: Global Oligonucleotide Therapeutics Industry Volume K Unit Forecast, by Country 2019 & 2032
- Table 125: GCC Oligonucleotide Therapeutics Industry Revenue (Million) Forecast, by Application 2019 & 2032
- Table 126: GCC Oligonucleotide Therapeutics Industry Volume (K Unit) Forecast, by Application 2019 & 2032
- Table 127: South Africa Oligonucleotide Therapeutics Industry Revenue (Million) Forecast, by Application 2019 & 2032
- Table 128: South Africa Oligonucleotide Therapeutics Industry Volume (K Unit) Forecast, by Application 2019 & 2032
- Table 129: Rest of Middle East and Africa Oligonucleotide Therapeutics Industry Revenue (Million) Forecast, by Application 2019 & 2032
- Table 130: Rest of Middle East and Africa Oligonucleotide Therapeutics Industry Volume (K Unit) Forecast, by Application 2019 & 2032
- Table 131: Global Oligonucleotide Therapeutics Industry Revenue Million Forecast, by Product Type 2019 & 2032
- Table 132: Global Oligonucleotide Therapeutics Industry Volume K Unit Forecast, by Product Type 2019 & 2032
- Table 133: Global Oligonucleotide Therapeutics Industry Revenue Million Forecast, by Application 2019 & 2032
- Table 134: Global Oligonucleotide Therapeutics Industry Volume K Unit Forecast, by Application 2019 & 2032
- Table 135: Global Oligonucleotide Therapeutics Industry Revenue Million Forecast, by End-user 2019 & 2032
- Table 136: Global Oligonucleotide Therapeutics Industry Volume K Unit Forecast, by End-user 2019 & 2032
- Table 137: Global Oligonucleotide Therapeutics Industry Revenue Million Forecast, by Country 2019 & 2032
- Table 138: Global Oligonucleotide Therapeutics Industry Volume K Unit Forecast, by Country 2019 & 2032
- Table 139: Brazil Oligonucleotide Therapeutics Industry Revenue (Million) Forecast, by Application 2019 & 2032
- Table 140: Brazil Oligonucleotide Therapeutics Industry Volume (K Unit) Forecast, by Application 2019 & 2032
- Table 141: Argentina Oligonucleotide Therapeutics Industry Revenue (Million) Forecast, by Application 2019 & 2032
- Table 142: Argentina Oligonucleotide Therapeutics Industry Volume (K Unit) Forecast, by Application 2019 & 2032
- Table 143: Rest of South America Oligonucleotide Therapeutics Industry Revenue (Million) Forecast, by Application 2019 & 2032
- Table 144: Rest of South America Oligonucleotide Therapeutics Industry Volume (K Unit) Forecast, by Application 2019 & 2032
Frequently Asked Questions
1. What is the projected Compound Annual Growth Rate (CAGR) of the Oligonucleotide Therapeutics Industry?
The projected CAGR is approximately 12.30%.
2. Which companies are prominent players in the Oligonucleotide Therapeutics Industry?
Key companies in the market include Merck KGaA, Maravai Life Sciences, Eurofins Scientific, Biogen, LGC Limited (LGC Biosearch Technologies), Danaher Corporation, GenScript, Sarepta Therapeutics Inc , Thermo Fisher Scientific, Bio-Synthesis Inc, Agilent Technologies, Kaneka Corporation (Eurogentec).
3. What are the main segments of the Oligonucleotide Therapeutics Industry?
The market segments include Product Type, Application, End-user.
4. Can you provide details about the market size?
The market size is estimated to be USD XX Million as of 2022.
5. What are some drivers contributing to market growth?
Increasing Government Investments and R&D Expenditure in Pharmaceutical and Biotechnology Companies; The Use of Synthesized Oligonucleotides in Molecular Diagnostics and Clinical Applications.
6. What are the notable trends driving market growth?
Therapeutic Segment Expected to Register a High CAGR.
7. Are there any restraints impacting market growth?
High Treatment Cost of Oligonucleotides; Lack of Skilled Professionals and Research Support in Undeveloped Countries.
8. Can you provide examples of recent developments in the market?
July 2022: WuXi STA, a subsidiary of WuXi AppTec, launched a new large-scale oligonucleotide and peptide manufacturing facility at its Changzhou campus. This new launch enhances its capacity and capability to meet the fast-growing customer needs for oligonucleotide and peptide therapeutics development and manufacturing worldwide.
9. What pricing options are available for accessing the report?
Pricing options include single-user, multi-user, and enterprise licenses priced at USD 4750, USD 5250, and USD 8750 respectively.
10. Is the market size provided in terms of value or volume?
The market size is provided in terms of value, measured in Million and volume, measured in K Unit.
11. Are there any specific market keywords associated with the report?
Yes, the market keyword associated with the report is "Oligonucleotide Therapeutics Industry," which aids in identifying and referencing the specific market segment covered.
12. How do I determine which pricing option suits my needs best?
The pricing options vary based on user requirements and access needs. Individual users may opt for single-user licenses, while businesses requiring broader access may choose multi-user or enterprise licenses for cost-effective access to the report.
13. Are there any additional resources or data provided in the Oligonucleotide Therapeutics Industry report?
While the report offers comprehensive insights, it's advisable to review the specific contents or supplementary materials provided to ascertain if additional resources or data are available.
14. How can I stay updated on further developments or reports in the Oligonucleotide Therapeutics Industry?
To stay informed about further developments, trends, and reports in the Oligonucleotide Therapeutics Industry, consider subscribing to industry newsletters, following relevant companies and organizations, or regularly checking reputable industry news sources and publications.
Methodology
Step 1 - Identification of Relevant Samples Size from Population Database


Step 2 - Approaches for Defining Global Market Size (Value, Volume* & Price*)

Note*: In applicable scenarios
Step 3 - Data Sources
Primary Research
- Web Analytics
- Survey Reports
- Research Institute
- Latest Research Reports
- Opinion Leaders
Secondary Research
- Annual Reports
- White Paper
- Latest Press Release
- Industry Association
- Paid Database
- Investor Presentations

Step 4 - Data Triangulation
Involves using different sources of information in order to increase the validity of a study
These sources are likely to be stakeholders in a program - participants, other researchers, program staff, other community members, and so on.
Then we put all data in single framework & apply various statistical tools to find out the dynamic on the market.
During the analysis stage, feedback from the stakeholder groups would be compared to determine areas of agreement as well as areas of divergence
