

Key Insights
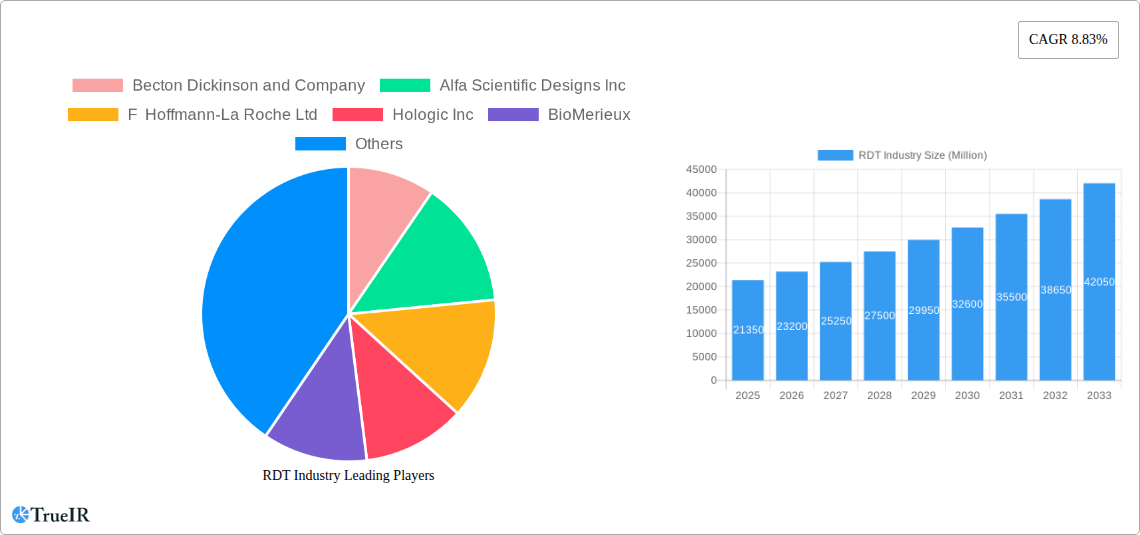
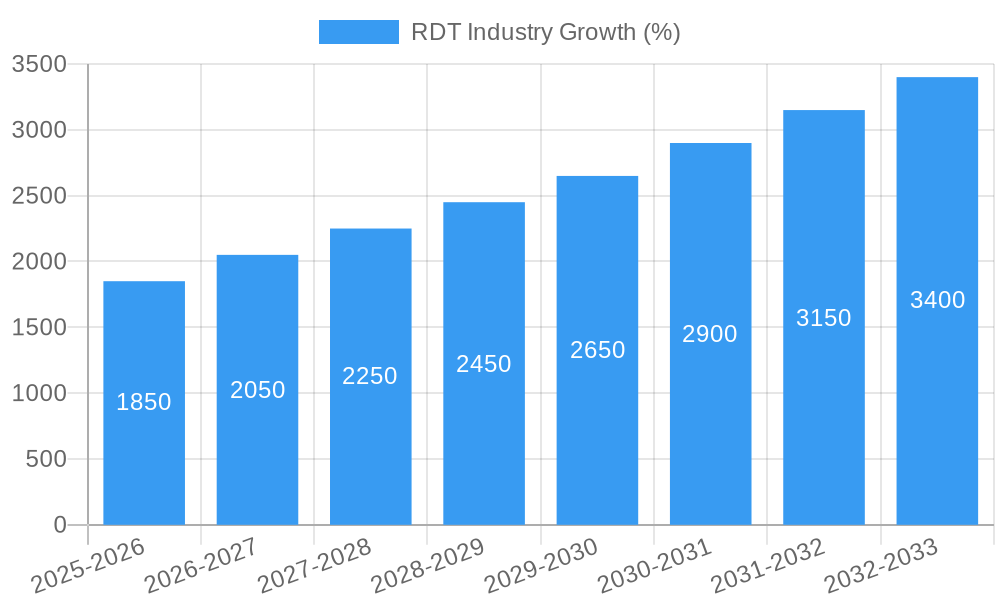
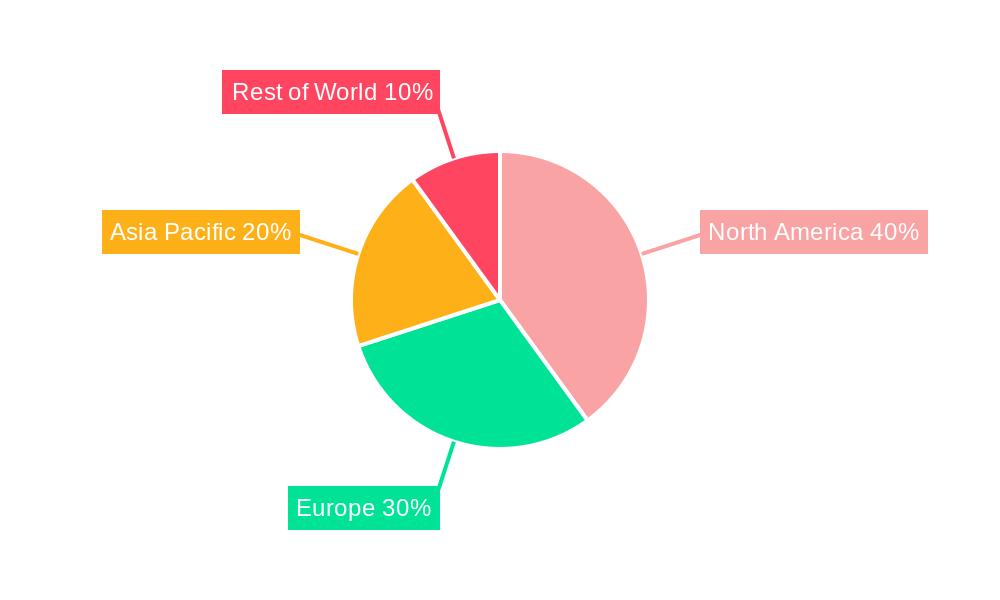
The rapid diagnostic test (RDT) market, valued at $21.35 billion in 2025, is projected to experience robust growth, driven by increasing prevalence of infectious diseases, rising demand for point-of-care diagnostics, and technological advancements in assay formats. The compound annual growth rate (CAGR) of 8.83% from 2025 to 2033 indicates a significant expansion of the market, particularly fueled by the growing adoption of lateral flow assays and solid-phase technologies due to their ease of use, cost-effectiveness, and portability. This makes them especially valuable in resource-limited settings and for home-based testing. The market segmentation reveals a substantial contribution from hospitals and clinics, reflecting the established reliance on RDTs in clinical settings for diagnosis. However, the homecare segment is expected to exhibit the fastest growth, driven by increasing consumer awareness and the convenience of self-testing. Key players like Becton Dickinson, Roche, Abbott, and Danaher are leading the innovation and market penetration, constantly improving sensitivity, specificity, and overall test performance. Geographic analysis indicates significant market share for North America and Europe, but the Asia-Pacific region is poised for rapid growth due to rising healthcare spending and increasing disease prevalence. The market will face challenges such as regulatory hurdles for new technologies and potential price competition from generic manufacturers. Nonetheless, the overall outlook remains positive given the substantial unmet need for rapid and accurate diagnostics worldwide.
The RDT market's growth trajectory is further influenced by evolving trends like the integration of digital technologies for improved data management and remote monitoring. This includes the use of mobile applications for result interpretation and data transmission, enhancing efficiency and accessibility. Moreover, the market is witnessing a growing demand for multi-analyte RDTs, capable of simultaneously detecting multiple pathogens, saving time and resources. Despite restraints like the potential for false-positive or false-negative results requiring further confirmatory testing, the market continues to show strong resilience. Future market growth hinges on continued technological advancements, strategic partnerships to improve supply chain efficiencies, and government initiatives promoting access to affordable diagnostics. The long-term forecast suggests a steady expansion driven by continuous demand for rapid and point-of-care diagnostic solutions.
Comprehensive RDT Industry Report: 2019-2033
This dynamic report provides a deep dive into the Rapid Diagnostic Test (RDT) industry, offering a comprehensive analysis of market structure, trends, and future projections from 2019 to 2033. Leveraging extensive data and expert insights, this report is an invaluable resource for industry stakeholders, investors, and strategic decision-makers seeking to navigate this rapidly evolving landscape. The report covers a market valued at $XX Million in 2025, projected to reach $XX Million by 2033, representing a significant CAGR of XX%.
RDT Industry Market Structure & Competitive Landscape
The RDT market is characterized by a moderately concentrated landscape, with a handful of major players holding significant market share. Key players include Becton Dickinson and Company, Alfa Scientific Designs Inc, F Hoffmann-La Roche Ltd, Hologic Inc, BioMerieux, Abbott Laboratories, Danaher Corporation, Siemens Healthcare GmbH, Creative Diagnostics, ACON Laboratories Inc, Artron Laboratories Inc, and BTNX Inc. The Herfindahl-Hirschman Index (HHI) for the industry is estimated at XX, indicating a moderately consolidated market.
Innovation is a key driver, with continuous development in areas such as solid-phase, lateral flow, and agglutination assays. Stringent regulatory approvals, particularly for in-vitro diagnostic (IVD) devices, significantly impact market entry and growth. The presence of substitute technologies, such as PCR testing, necessitates constant innovation to maintain competitiveness.
End-user segmentation plays a crucial role. Hospitals and clinics remain the largest segment, followed by homecare and other end-users. Mergers and acquisitions (M&A) activity has been moderate in recent years, with a total transaction value of approximately $XX Million in the past five years. This activity often focuses on expanding product portfolios and geographical reach.
- Market Concentration: Moderately concentrated, with HHI estimated at XX.
- Innovation Drivers: Solid phase, lateral flow, agglutination assays.
- Regulatory Impacts: Stringent approvals for IVD devices.
- Product Substitutes: PCR testing.
- End-User Segmentation: Hospitals & Clinics (largest), Homecare, Other End-Users.
- M&A Trends: Moderate activity, $XX Million in the past five years.
RDT Industry Market Trends & Opportunities
The RDT market has experienced robust growth, driven by increasing demand for rapid diagnostics across various healthcare settings. Technological advancements, particularly in point-of-care diagnostics, have significantly improved the speed and accuracy of testing. Consumer preference for convenience and at-home testing has fueled the growth of home-based diagnostic solutions.
The market is also witnessing a shift towards multiplex testing, allowing for simultaneous detection of multiple pathogens. This trend is expected to gain further momentum, driven by advancements in microfluidics and nanotechnology. However, competitive dynamics remain intense, with companies constantly striving to improve their diagnostic solutions and expand their market reach.
The global RDT market is expected to witness significant growth during the forecast period (2025-2033), driven by factors such as the increasing prevalence of infectious diseases, rising demand for rapid diagnostics in point-of-care settings, and technological advancements. The market is projected to reach $XX Million by 2033, with a CAGR of XX% during the forecast period. Market penetration rates are expected to increase significantly in developing economies due to factors such as rising healthcare expenditure and growing awareness about infectious diseases.
Dominant Markets & Segments in RDT Industry
The North American region currently holds the largest market share in the RDT industry, driven by strong healthcare infrastructure, high adoption rates of advanced technologies, and favorable regulatory environments. Within the technology segments, Lateral Flow assays dominate due to their cost-effectiveness and ease of use. However, solid-phase technology is anticipated to see strong growth due to its enhanced accuracy.
The Hospitals and Clinics segment represents the largest end-user category due to the high volume of testing conducted in these settings. Homecare is a rapidly growing segment, fueled by the increasing preference for at-home testing and the development of user-friendly devices.
- Leading Region: North America
- Leading Technology Segment: Lateral Flow Assays
- Leading End-User Segment: Hospitals and Clinics
- Key Growth Drivers (North America): Strong healthcare infrastructure, high technology adoption.
- Key Growth Drivers (Lateral Flow): Cost-effectiveness, ease of use.
- Key Growth Drivers (Hospitals & Clinics): High testing volume.
RDT Industry Product Analysis
Recent advancements in RDT technology have led to significant improvements in sensitivity, specificity, and ease of use. The integration of smartphone connectivity and digital data analysis capabilities is enhancing the functionality of RDT devices. The development of multiplexed assays for simultaneous detection of multiple pathogens has further expanded the applications of RDTs. These innovative products are designed to cater to diverse market needs, with improved accuracy and user-friendliness driving market adoption.
Key Drivers, Barriers & Challenges in RDT Industry
Key Drivers:
- Technological advancements leading to improved accuracy and portability.
- Increasing prevalence of infectious diseases globally.
- Rising demand for point-of-care diagnostics in resource-constrained settings.
- Favorable regulatory frameworks promoting innovation and market entry.
Challenges:
- Stringent regulatory requirements impacting product approval and market entry.
- Supply chain disruptions due to geopolitical factors and manufacturing constraints.
- Intense competition among established players and emerging startups.
- Maintaining data security and privacy associated with connected RDT devices.
Growth Drivers in the RDT Industry Market
The RDT market is propelled by factors like technological innovation (e.g., multiplex assays), increasing healthcare spending, growing prevalence of infectious diseases, and supportive government policies promoting rapid diagnostics. The demand for point-of-care testing in remote areas further boosts market expansion.
Challenges Impacting RDT Industry Growth
Challenges include regulatory hurdles slowing down product approvals, supply chain vulnerabilities impacting manufacturing and distribution, and fierce competition from established players and new entrants. These factors exert quantifiable impacts on market growth, hindering the full realization of its potential.
Key Players Shaping the RDT Industry Market
- Becton Dickinson and Company
- Alfa Scientific Designs Inc
- F Hoffmann-La Roche Ltd
- Hologic Inc
- BioMerieux
- Abbott Laboratories
- Danaher Corporation
- Siemens Healthcare GmbH
- Creative Diagnostics
- ACON Laboratories Inc
- Artron Laboratories Inc
- BTNX Inc
Significant RDT Industry Milestones
- February 2023: Mylab launched rapid tests for STIs (Syphilis, HCV, HIV).
- February 2023: Lucira Health received FDA EUA for at-home COVID-19 & Flu test.
Future Outlook for RDT Industry Market
The RDT market is poised for continued growth, driven by technological advancements, increasing demand for rapid diagnostics, and expanding applications. Strategic partnerships, acquisitions, and the development of innovative products will shape the competitive landscape. The market presents significant opportunities for companies focused on developing advanced diagnostic technologies and expanding into emerging markets.
RDT Industry Segmentation
-
1. Technology
- 1.1. Solid Phase
- 1.2. Lateral Flow
- 1.3. Agglutination Assays
- 1.4. Other Technologies
-
2. End User
- 2.1. Hospitals and Clinics
- 2.2. Homecare
- 2.3. Other End-Users
RDT Industry Segmentation By Geography
-
1. North America
- 1.1. United States
- 1.2. Canada
- 1.3. Mexico
-
2. Europe
- 2.1. Germany
- 2.2. United Kingdom
- 2.3. France
- 2.4. Italy
- 2.5. Spain
- 2.6. Rest of Europe
-
3. Asia Pacific
- 3.1. China
- 3.2. Japan
- 3.3. India
- 3.4. Australia
- 3.5. South korea
- 3.6. Rest of Asia Pacific
-
4. Middle East and Africa
- 4.1. GCC
- 4.2. South Africa
- 4.3. Rest of Middle East and Africa
-
5. South America
- 5.1. Brazil
- 5.2. Argentina
- 5.3. Rest of South America
RDT Industry REPORT HIGHLIGHTS
| Aspects | Details |
|---|---|
| Study Period | 2019-2033 |
| Base Year | 2024 |
| Estimated Year | 2025 |
| Forecast Period | 2025-2033 |
| Historical Period | 2019-2024 |
| Growth Rate | CAGR of 8.83% from 2019-2033 |
| Segmentation |
|
Table of Contents
- 1. Introduction
- 1.1. Research Scope
- 1.2. Market Segmentation
- 1.3. Research Methodology
- 1.4. Definitions and Assumptions
- 2. Executive Summary
- 2.1. Introduction
- 3. Market Dynamics
- 3.1. Introduction
- 3.2. Market Drivers
- 3.2.1 The healthcare industry is increasingly shifting towards point-of-care testing to facilitate immediate clinical decision-making
- 3.2.2 especially in emergency and outpatient settings.
- 3.3. Market Restrains
- 3.3.1 The approval process for diagnostic tests can be lengthy and complex
- 3.3.2 with stringent regulations that can hinder the rapid development and deployment of new RDTs.
- 3.4. Market Trends
- 3.4.1 The incorporation of mobile health applications and telemedicine with RDTs is growing
- 3.4.2 allowing for remote monitoring
- 3.4.3 result sharing
- 3.4.4 and improved patient management.
- 4. Market Factor Analysis
- 4.1. Porters Five Forces
- 4.2. Supply/Value Chain
- 4.3. PESTEL analysis
- 4.4. Market Entropy
- 4.5. Patent/Trademark Analysis
- 5. Global RDT Industry Analysis, Insights and Forecast, 2019-2031
- 5.1. Market Analysis, Insights and Forecast - by Technology
- 5.1.1. Solid Phase
- 5.1.2. Lateral Flow
- 5.1.3. Agglutination Assays
- 5.1.4. Other Technologies
- 5.2. Market Analysis, Insights and Forecast - by End User
- 5.2.1. Hospitals and Clinics
- 5.2.2. Homecare
- 5.2.3. Other End-Users
- 5.3. Market Analysis, Insights and Forecast - by Region
- 5.3.1. North America
- 5.3.2. Europe
- 5.3.3. Asia Pacific
- 5.3.4. Middle East and Africa
- 5.3.5. South America
- 5.1. Market Analysis, Insights and Forecast - by Technology
- 6. North America RDT Industry Analysis, Insights and Forecast, 2019-2031
- 6.1. Market Analysis, Insights and Forecast - by Technology
- 6.1.1. Solid Phase
- 6.1.2. Lateral Flow
- 6.1.3. Agglutination Assays
- 6.1.4. Other Technologies
- 6.2. Market Analysis, Insights and Forecast - by End User
- 6.2.1. Hospitals and Clinics
- 6.2.2. Homecare
- 6.2.3. Other End-Users
- 6.1. Market Analysis, Insights and Forecast - by Technology
- 7. Europe RDT Industry Analysis, Insights and Forecast, 2019-2031
- 7.1. Market Analysis, Insights and Forecast - by Technology
- 7.1.1. Solid Phase
- 7.1.2. Lateral Flow
- 7.1.3. Agglutination Assays
- 7.1.4. Other Technologies
- 7.2. Market Analysis, Insights and Forecast - by End User
- 7.2.1. Hospitals and Clinics
- 7.2.2. Homecare
- 7.2.3. Other End-Users
- 7.1. Market Analysis, Insights and Forecast - by Technology
- 8. Asia Pacific RDT Industry Analysis, Insights and Forecast, 2019-2031
- 8.1. Market Analysis, Insights and Forecast - by Technology
- 8.1.1. Solid Phase
- 8.1.2. Lateral Flow
- 8.1.3. Agglutination Assays
- 8.1.4. Other Technologies
- 8.2. Market Analysis, Insights and Forecast - by End User
- 8.2.1. Hospitals and Clinics
- 8.2.2. Homecare
- 8.2.3. Other End-Users
- 8.1. Market Analysis, Insights and Forecast - by Technology
- 9. Middle East and Africa RDT Industry Analysis, Insights and Forecast, 2019-2031
- 9.1. Market Analysis, Insights and Forecast - by Technology
- 9.1.1. Solid Phase
- 9.1.2. Lateral Flow
- 9.1.3. Agglutination Assays
- 9.1.4. Other Technologies
- 9.2. Market Analysis, Insights and Forecast - by End User
- 9.2.1. Hospitals and Clinics
- 9.2.2. Homecare
- 9.2.3. Other End-Users
- 9.1. Market Analysis, Insights and Forecast - by Technology
- 10. South America RDT Industry Analysis, Insights and Forecast, 2019-2031
- 10.1. Market Analysis, Insights and Forecast - by Technology
- 10.1.1. Solid Phase
- 10.1.2. Lateral Flow
- 10.1.3. Agglutination Assays
- 10.1.4. Other Technologies
- 10.2. Market Analysis, Insights and Forecast - by End User
- 10.2.1. Hospitals and Clinics
- 10.2.2. Homecare
- 10.2.3. Other End-Users
- 10.1. Market Analysis, Insights and Forecast - by Technology
- 11. North Americ RDT Industry Analysis, Insights and Forecast, 2019-2031
- 11.1. Market Analysis, Insights and Forecast - By Country/Sub-region
- 11.1.1 United States
- 11.1.2 Canada
- 11.1.3 Mexico
- 12. South America RDT Industry Analysis, Insights and Forecast, 2019-2031
- 12.1. Market Analysis, Insights and Forecast - By Country/Sub-region
- 12.1.1 Brazil
- 12.1.2 Mexico
- 12.1.3 Rest of South America
- 13. Europe RDT Industry Analysis, Insights and Forecast, 2019-2031
- 13.1. Market Analysis, Insights and Forecast - By Country/Sub-region
- 13.1.1 Germany
- 13.1.2 United Kingdom
- 13.1.3 France
- 13.1.4 Italy
- 13.1.5 Spain
- 13.1.6 Rest of Europe
- 14. Asia Pacific RDT Industry Analysis, Insights and Forecast, 2019-2031
- 14.1. Market Analysis, Insights and Forecast - By Country/Sub-region
- 14.1.1 China
- 14.1.2 Japan
- 14.1.3 India
- 14.1.4 South Korea
- 14.1.5 Taiwan
- 14.1.6 Australia
- 14.1.7 Rest of Asia-Pacific
- 15. MEA RDT Industry Analysis, Insights and Forecast, 2019-2031
- 15.1. Market Analysis, Insights and Forecast - By Country/Sub-region
- 15.1.1 Middle East
- 15.1.2 Africa
- 16. Competitive Analysis
- 16.1. Global Market Share Analysis 2024
- 16.2. Company Profiles
- 16.2.1 Becton Dickinson and Company
- 16.2.1.1. Overview
- 16.2.1.2. Products
- 16.2.1.3. SWOT Analysis
- 16.2.1.4. Recent Developments
- 16.2.1.5. Financials (Based on Availability)
- 16.2.2 Alfa Scientific Designs Inc
- 16.2.2.1. Overview
- 16.2.2.2. Products
- 16.2.2.3. SWOT Analysis
- 16.2.2.4. Recent Developments
- 16.2.2.5. Financials (Based on Availability)
- 16.2.3 F Hoffmann-La Roche Ltd
- 16.2.3.1. Overview
- 16.2.3.2. Products
- 16.2.3.3. SWOT Analysis
- 16.2.3.4. Recent Developments
- 16.2.3.5. Financials (Based on Availability)
- 16.2.4 Hologic Inc
- 16.2.4.1. Overview
- 16.2.4.2. Products
- 16.2.4.3. SWOT Analysis
- 16.2.4.4. Recent Developments
- 16.2.4.5. Financials (Based on Availability)
- 16.2.5 BioMerieux
- 16.2.5.1. Overview
- 16.2.5.2. Products
- 16.2.5.3. SWOT Analysis
- 16.2.5.4. Recent Developments
- 16.2.5.5. Financials (Based on Availability)
- 16.2.6 Abbott Laboratories
- 16.2.6.1. Overview
- 16.2.6.2. Products
- 16.2.6.3. SWOT Analysis
- 16.2.6.4. Recent Developments
- 16.2.6.5. Financials (Based on Availability)
- 16.2.7 Danaher Corporation
- 16.2.7.1. Overview
- 16.2.7.2. Products
- 16.2.7.3. SWOT Analysis
- 16.2.7.4. Recent Developments
- 16.2.7.5. Financials (Based on Availability)
- 16.2.8 Siemens Healthcare GmbH
- 16.2.8.1. Overview
- 16.2.8.2. Products
- 16.2.8.3. SWOT Analysis
- 16.2.8.4. Recent Developments
- 16.2.8.5. Financials (Based on Availability)
- 16.2.9 Creative Diagnostics
- 16.2.9.1. Overview
- 16.2.9.2. Products
- 16.2.9.3. SWOT Analysis
- 16.2.9.4. Recent Developments
- 16.2.9.5. Financials (Based on Availability)
- 16.2.10 ACON Laboratories Inc
- 16.2.10.1. Overview
- 16.2.10.2. Products
- 16.2.10.3. SWOT Analysis
- 16.2.10.4. Recent Developments
- 16.2.10.5. Financials (Based on Availability)
- 16.2.11 Artron Laboratories Inc
- 16.2.11.1. Overview
- 16.2.11.2. Products
- 16.2.11.3. SWOT Analysis
- 16.2.11.4. Recent Developments
- 16.2.11.5. Financials (Based on Availability)
- 16.2.12 BTNX Inc
- 16.2.12.1. Overview
- 16.2.12.2. Products
- 16.2.12.3. SWOT Analysis
- 16.2.12.4. Recent Developments
- 16.2.12.5. Financials (Based on Availability)
- 16.2.1 Becton Dickinson and Company
List of Figures
- Figure 1: Global RDT Industry Revenue Breakdown (Million, %) by Region 2024 & 2032
- Figure 2: North Americ RDT Industry Revenue (Million), by Country 2024 & 2032
- Figure 3: North Americ RDT Industry Revenue Share (%), by Country 2024 & 2032
- Figure 4: South America RDT Industry Revenue (Million), by Country 2024 & 2032
- Figure 5: South America RDT Industry Revenue Share (%), by Country 2024 & 2032
- Figure 6: Europe RDT Industry Revenue (Million), by Country 2024 & 2032
- Figure 7: Europe RDT Industry Revenue Share (%), by Country 2024 & 2032
- Figure 8: Asia Pacific RDT Industry Revenue (Million), by Country 2024 & 2032
- Figure 9: Asia Pacific RDT Industry Revenue Share (%), by Country 2024 & 2032
- Figure 10: MEA RDT Industry Revenue (Million), by Country 2024 & 2032
- Figure 11: MEA RDT Industry Revenue Share (%), by Country 2024 & 2032
- Figure 12: North America RDT Industry Revenue (Million), by Technology 2024 & 2032
- Figure 13: North America RDT Industry Revenue Share (%), by Technology 2024 & 2032
- Figure 14: North America RDT Industry Revenue (Million), by End User 2024 & 2032
- Figure 15: North America RDT Industry Revenue Share (%), by End User 2024 & 2032
- Figure 16: North America RDT Industry Revenue (Million), by Country 2024 & 2032
- Figure 17: North America RDT Industry Revenue Share (%), by Country 2024 & 2032
- Figure 18: Europe RDT Industry Revenue (Million), by Technology 2024 & 2032
- Figure 19: Europe RDT Industry Revenue Share (%), by Technology 2024 & 2032
- Figure 20: Europe RDT Industry Revenue (Million), by End User 2024 & 2032
- Figure 21: Europe RDT Industry Revenue Share (%), by End User 2024 & 2032
- Figure 22: Europe RDT Industry Revenue (Million), by Country 2024 & 2032
- Figure 23: Europe RDT Industry Revenue Share (%), by Country 2024 & 2032
- Figure 24: Asia Pacific RDT Industry Revenue (Million), by Technology 2024 & 2032
- Figure 25: Asia Pacific RDT Industry Revenue Share (%), by Technology 2024 & 2032
- Figure 26: Asia Pacific RDT Industry Revenue (Million), by End User 2024 & 2032
- Figure 27: Asia Pacific RDT Industry Revenue Share (%), by End User 2024 & 2032
- Figure 28: Asia Pacific RDT Industry Revenue (Million), by Country 2024 & 2032
- Figure 29: Asia Pacific RDT Industry Revenue Share (%), by Country 2024 & 2032
- Figure 30: Middle East and Africa RDT Industry Revenue (Million), by Technology 2024 & 2032
- Figure 31: Middle East and Africa RDT Industry Revenue Share (%), by Technology 2024 & 2032
- Figure 32: Middle East and Africa RDT Industry Revenue (Million), by End User 2024 & 2032
- Figure 33: Middle East and Africa RDT Industry Revenue Share (%), by End User 2024 & 2032
- Figure 34: Middle East and Africa RDT Industry Revenue (Million), by Country 2024 & 2032
- Figure 35: Middle East and Africa RDT Industry Revenue Share (%), by Country 2024 & 2032
- Figure 36: South America RDT Industry Revenue (Million), by Technology 2024 & 2032
- Figure 37: South America RDT Industry Revenue Share (%), by Technology 2024 & 2032
- Figure 38: South America RDT Industry Revenue (Million), by End User 2024 & 2032
- Figure 39: South America RDT Industry Revenue Share (%), by End User 2024 & 2032
- Figure 40: South America RDT Industry Revenue (Million), by Country 2024 & 2032
- Figure 41: South America RDT Industry Revenue Share (%), by Country 2024 & 2032
List of Tables
- Table 1: Global RDT Industry Revenue Million Forecast, by Region 2019 & 2032
- Table 2: Global RDT Industry Revenue Million Forecast, by Technology 2019 & 2032
- Table 3: Global RDT Industry Revenue Million Forecast, by End User 2019 & 2032
- Table 4: Global RDT Industry Revenue Million Forecast, by Region 2019 & 2032
- Table 5: Global RDT Industry Revenue Million Forecast, by Country 2019 & 2032
- Table 6: United States RDT Industry Revenue (Million) Forecast, by Application 2019 & 2032
- Table 7: Canada RDT Industry Revenue (Million) Forecast, by Application 2019 & 2032
- Table 8: Mexico RDT Industry Revenue (Million) Forecast, by Application 2019 & 2032
- Table 9: Global RDT Industry Revenue Million Forecast, by Country 2019 & 2032
- Table 10: Brazil RDT Industry Revenue (Million) Forecast, by Application 2019 & 2032
- Table 11: Mexico RDT Industry Revenue (Million) Forecast, by Application 2019 & 2032
- Table 12: Rest of South America RDT Industry Revenue (Million) Forecast, by Application 2019 & 2032
- Table 13: Global RDT Industry Revenue Million Forecast, by Country 2019 & 2032
- Table 14: Germany RDT Industry Revenue (Million) Forecast, by Application 2019 & 2032
- Table 15: United Kingdom RDT Industry Revenue (Million) Forecast, by Application 2019 & 2032
- Table 16: France RDT Industry Revenue (Million) Forecast, by Application 2019 & 2032
- Table 17: Italy RDT Industry Revenue (Million) Forecast, by Application 2019 & 2032
- Table 18: Spain RDT Industry Revenue (Million) Forecast, by Application 2019 & 2032
- Table 19: Rest of Europe RDT Industry Revenue (Million) Forecast, by Application 2019 & 2032
- Table 20: Global RDT Industry Revenue Million Forecast, by Country 2019 & 2032
- Table 21: China RDT Industry Revenue (Million) Forecast, by Application 2019 & 2032
- Table 22: Japan RDT Industry Revenue (Million) Forecast, by Application 2019 & 2032
- Table 23: India RDT Industry Revenue (Million) Forecast, by Application 2019 & 2032
- Table 24: South Korea RDT Industry Revenue (Million) Forecast, by Application 2019 & 2032
- Table 25: Taiwan RDT Industry Revenue (Million) Forecast, by Application 2019 & 2032
- Table 26: Australia RDT Industry Revenue (Million) Forecast, by Application 2019 & 2032
- Table 27: Rest of Asia-Pacific RDT Industry Revenue (Million) Forecast, by Application 2019 & 2032
- Table 28: Global RDT Industry Revenue Million Forecast, by Country 2019 & 2032
- Table 29: Middle East RDT Industry Revenue (Million) Forecast, by Application 2019 & 2032
- Table 30: Africa RDT Industry Revenue (Million) Forecast, by Application 2019 & 2032
- Table 31: Global RDT Industry Revenue Million Forecast, by Technology 2019 & 2032
- Table 32: Global RDT Industry Revenue Million Forecast, by End User 2019 & 2032
- Table 33: Global RDT Industry Revenue Million Forecast, by Country 2019 & 2032
- Table 34: United States RDT Industry Revenue (Million) Forecast, by Application 2019 & 2032
- Table 35: Canada RDT Industry Revenue (Million) Forecast, by Application 2019 & 2032
- Table 36: Mexico RDT Industry Revenue (Million) Forecast, by Application 2019 & 2032
- Table 37: Global RDT Industry Revenue Million Forecast, by Technology 2019 & 2032
- Table 38: Global RDT Industry Revenue Million Forecast, by End User 2019 & 2032
- Table 39: Global RDT Industry Revenue Million Forecast, by Country 2019 & 2032
- Table 40: Germany RDT Industry Revenue (Million) Forecast, by Application 2019 & 2032
- Table 41: United Kingdom RDT Industry Revenue (Million) Forecast, by Application 2019 & 2032
- Table 42: France RDT Industry Revenue (Million) Forecast, by Application 2019 & 2032
- Table 43: Italy RDT Industry Revenue (Million) Forecast, by Application 2019 & 2032
- Table 44: Spain RDT Industry Revenue (Million) Forecast, by Application 2019 & 2032
- Table 45: Rest of Europe RDT Industry Revenue (Million) Forecast, by Application 2019 & 2032
- Table 46: Global RDT Industry Revenue Million Forecast, by Technology 2019 & 2032
- Table 47: Global RDT Industry Revenue Million Forecast, by End User 2019 & 2032
- Table 48: Global RDT Industry Revenue Million Forecast, by Country 2019 & 2032
- Table 49: China RDT Industry Revenue (Million) Forecast, by Application 2019 & 2032
- Table 50: Japan RDT Industry Revenue (Million) Forecast, by Application 2019 & 2032
- Table 51: India RDT Industry Revenue (Million) Forecast, by Application 2019 & 2032
- Table 52: Australia RDT Industry Revenue (Million) Forecast, by Application 2019 & 2032
- Table 53: South korea RDT Industry Revenue (Million) Forecast, by Application 2019 & 2032
- Table 54: Rest of Asia Pacific RDT Industry Revenue (Million) Forecast, by Application 2019 & 2032
- Table 55: Global RDT Industry Revenue Million Forecast, by Technology 2019 & 2032
- Table 56: Global RDT Industry Revenue Million Forecast, by End User 2019 & 2032
- Table 57: Global RDT Industry Revenue Million Forecast, by Country 2019 & 2032
- Table 58: GCC RDT Industry Revenue (Million) Forecast, by Application 2019 & 2032
- Table 59: South Africa RDT Industry Revenue (Million) Forecast, by Application 2019 & 2032
- Table 60: Rest of Middle East and Africa RDT Industry Revenue (Million) Forecast, by Application 2019 & 2032
- Table 61: Global RDT Industry Revenue Million Forecast, by Technology 2019 & 2032
- Table 62: Global RDT Industry Revenue Million Forecast, by End User 2019 & 2032
- Table 63: Global RDT Industry Revenue Million Forecast, by Country 2019 & 2032
- Table 64: Brazil RDT Industry Revenue (Million) Forecast, by Application 2019 & 2032
- Table 65: Argentina RDT Industry Revenue (Million) Forecast, by Application 2019 & 2032
- Table 66: Rest of South America RDT Industry Revenue (Million) Forecast, by Application 2019 & 2032
Frequently Asked Questions
1. What is the projected Compound Annual Growth Rate (CAGR) of the RDT Industry?
The projected CAGR is approximately 8.83%.
2. Which companies are prominent players in the RDT Industry?
Key companies in the market include Becton Dickinson and Company, Alfa Scientific Designs Inc, F Hoffmann-La Roche Ltd, Hologic Inc, BioMerieux, Abbott Laboratories, Danaher Corporation, Siemens Healthcare GmbH, Creative Diagnostics, ACON Laboratories Inc, Artron Laboratories Inc, BTNX Inc.
3. What are the main segments of the RDT Industry?
The market segments include Technology, End User.
4. Can you provide details about the market size?
The market size is estimated to be USD 21.35 Million as of 2022.
5. What are some drivers contributing to market growth?
The healthcare industry is increasingly shifting towards point-of-care testing to facilitate immediate clinical decision-making. especially in emergency and outpatient settings..
6. What are the notable trends driving market growth?
The incorporation of mobile health applications and telemedicine with RDTs is growing. allowing for remote monitoring. result sharing. and improved patient management..
7. Are there any restraints impacting market growth?
The approval process for diagnostic tests can be lengthy and complex. with stringent regulations that can hinder the rapid development and deployment of new RDTs..
8. Can you provide examples of recent developments in the market?
February 2023: Mylab launched its rapid tests for sexually transmitted diseases (STIs), including Syphilis, hepatitis C virus (HCV), and human immunodeficiency virus (HIV). The rapid tests include the antibodies against HIV 1 and 2, HCV, and Treponema Pallidum (TP), for detecting HIV, HCV, and Syphilis.
9. What pricing options are available for accessing the report?
Pricing options include single-user, multi-user, and enterprise licenses priced at USD 4750, USD 5250, and USD 8750 respectively.
10. Is the market size provided in terms of value or volume?
The market size is provided in terms of value, measured in Million.
11. Are there any specific market keywords associated with the report?
Yes, the market keyword associated with the report is "RDT Industry," which aids in identifying and referencing the specific market segment covered.
12. How do I determine which pricing option suits my needs best?
The pricing options vary based on user requirements and access needs. Individual users may opt for single-user licenses, while businesses requiring broader access may choose multi-user or enterprise licenses for cost-effective access to the report.
13. Are there any additional resources or data provided in the RDT Industry report?
While the report offers comprehensive insights, it's advisable to review the specific contents or supplementary materials provided to ascertain if additional resources or data are available.
14. How can I stay updated on further developments or reports in the RDT Industry?
To stay informed about further developments, trends, and reports in the RDT Industry, consider subscribing to industry newsletters, following relevant companies and organizations, or regularly checking reputable industry news sources and publications.
Methodology
Step 1 - Identification of Relevant Samples Size from Population Database


Step 2 - Approaches for Defining Global Market Size (Value, Volume* & Price*)

Note*: In applicable scenarios
Step 3 - Data Sources
Primary Research
- Web Analytics
- Survey Reports
- Research Institute
- Latest Research Reports
- Opinion Leaders
Secondary Research
- Annual Reports
- White Paper
- Latest Press Release
- Industry Association
- Paid Database
- Investor Presentations

Step 4 - Data Triangulation
Involves using different sources of information in order to increase the validity of a study
These sources are likely to be stakeholders in a program - participants, other researchers, program staff, other community members, and so on.
Then we put all data in single framework & apply various statistical tools to find out the dynamic on the market.
During the analysis stage, feedback from the stakeholder groups would be compared to determine areas of agreement as well as areas of divergence
