

Key Insights
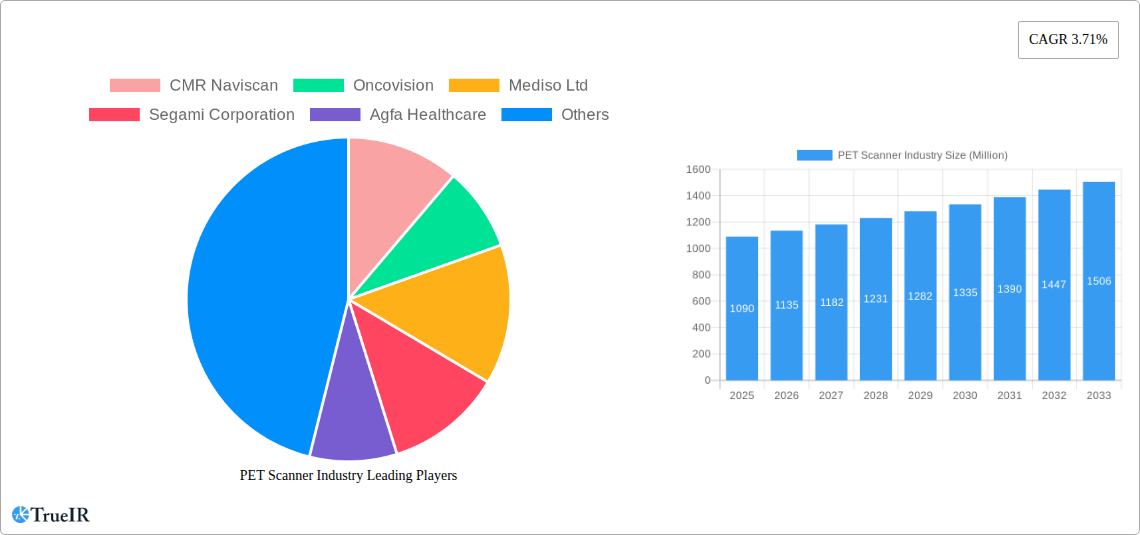
The global PET scanner market, valued at $1.09 billion in 2025, is projected to experience steady growth, driven by several key factors. Technological advancements leading to improved image quality, faster scan times, and reduced radiation exposure are significantly boosting market adoption. The increasing prevalence of cancer and cardiovascular diseases, coupled with rising demand for accurate and early diagnosis, fuels the demand for PET scanners across hospitals and diagnostic centers. Furthermore, the ongoing development of hybrid imaging systems, integrating PET with other modalities like CT or MRI, enhances diagnostic capabilities and contributes to market expansion. Growth is also spurred by government initiatives promoting advanced medical technologies and increasing healthcare expenditure globally. While regulatory hurdles and high initial investment costs can pose challenges, the long-term benefits of early and precise diagnosis outweigh these restraints, sustaining market growth.
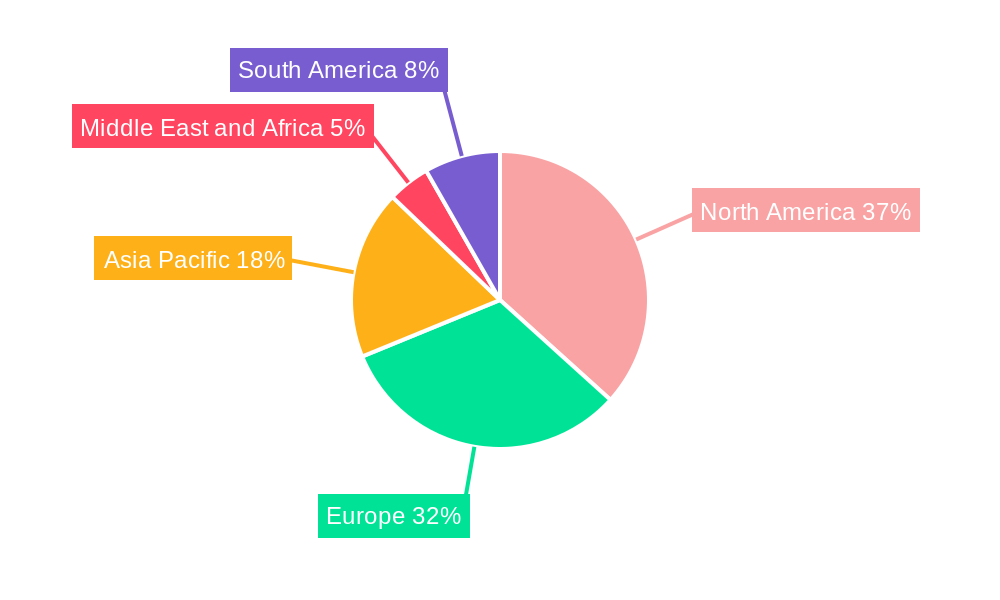
However, the market landscape is not without its complexities. Competition among established players like Siemens Healthineers, GE Healthcare, and Philips, alongside emerging companies, creates a dynamic market environment. The market's segmentation by product type (full-ring vs. partial-ring) reflects varying clinical needs and budget considerations. Similarly, application-based segmentation (cardiology, oncology, neurology) highlights the diverse use cases across various medical specialties. Geographic distribution reveals a strong presence in North America and Europe, fueled by advanced healthcare infrastructure and high adoption rates. However, developing regions in Asia-Pacific and other emerging markets present significant growth opportunities, driven by improving healthcare infrastructure and increasing awareness of advanced diagnostic technologies. The forecast period of 2025-2033 anticipates continuous growth, albeit at a moderate pace, reflecting the market's maturity and the ongoing balance between technological innovation and market penetration.
PET Scanner Industry Market Report: 2019-2033
This comprehensive report provides a detailed analysis of the PET Scanner industry, offering invaluable insights for stakeholders, investors, and industry professionals. Covering the period from 2019 to 2033, with a focus on 2025, this report meticulously examines market size, growth drivers, challenges, competitive dynamics, and future outlook. The report leverages extensive data analysis and industry expertise to deliver actionable intelligence for strategic decision-making. Expect in-depth coverage of key players, market segments, and emerging trends.
PET Scanner Industry Market Structure & Competitive Landscape
The global PET scanner market exhibits a moderately concentrated structure, with a few major players holding significant market share. The Herfindahl-Hirschman Index (HHI) is estimated at xx in 2025, indicating a moderately competitive landscape. Innovation plays a crucial role, driving the development of advanced PET/CT systems with improved image quality and faster scan times. Stringent regulatory approvals and safety standards significantly impact market entry and operations. Product substitution is limited due to the specialized nature of PET scanners; however, competition exists among different scanner types (full-ring vs. partial-ring). The end-user segment is primarily driven by hospitals and diagnostic centers, each accounting for approximately xx Million and xx Million in revenue respectively in 2025. M&A activity has been moderate in recent years, with a total deal value of approximately xx Million recorded in 2024.
- Market Concentration: Moderately concentrated, with an estimated HHI of xx in 2025.
- Innovation Drivers: Improved image quality, faster scan times, and advanced functionalities.
- Regulatory Impacts: Stringent regulatory approvals and safety standards.
- Product Substitutes: Limited, with competition primarily between full-ring and partial-ring scanners.
- End-User Segmentation: Hospitals and diagnostic centers are the dominant segments.
- M&A Trends: Moderate activity with a total deal value of approximately xx Million in 2024.
PET Scanner Industry Market Trends & Opportunities
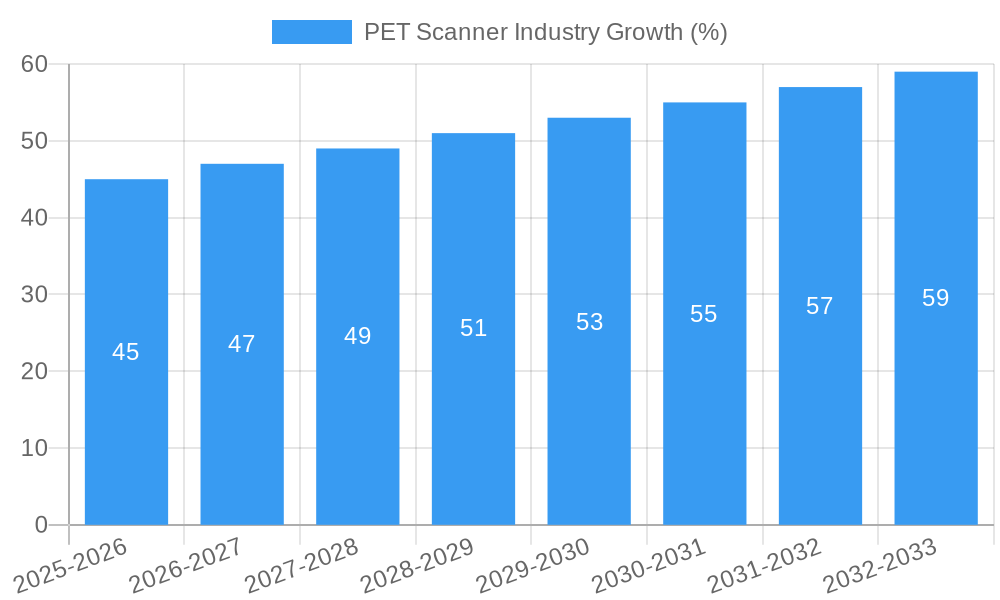
The global PET scanner market is experiencing robust growth, with a projected Compound Annual Growth Rate (CAGR) of xx% during the forecast period (2025-2033). This growth is driven by several factors, including the rising prevalence of cancer and cardiovascular diseases, increasing demand for advanced diagnostic imaging technologies, and technological advancements resulting in enhanced image quality and faster scan times. Market penetration rate for PET scanners in developed regions is relatively high, while developing countries present significant growth opportunities. Consumer preference is shifting towards systems with advanced functionalities, such as improved image reconstruction and integrated software solutions. Competitive dynamics are characterized by ongoing innovation, strategic partnerships, and acquisitions by leading players to strengthen market position and expand product offerings. The market size is estimated to reach xx Million by 2033.
Dominant Markets & Segments in PET Scanner Industry
The oncology segment is the largest application area for PET scanners, representing approximately xx Million in revenue in 2025, driven by the increasing incidence of cancer globally. North America is the dominant regional market, owing to high healthcare expenditure, advanced infrastructure, and early adoption of new technologies. Within product types, full-ring PET scanners dominate, accounting for over xx% of the market share in 2025. Hospitals account for the largest share of end-users, with significant revenue contributions from diagnostic centers as well.
- Key Growth Drivers (Oncology Segment):
- Increasing prevalence of cancer.
- Rising demand for early and accurate diagnosis.
- Technological advancements leading to improved image quality.
- Key Growth Drivers (North America):
- High healthcare expenditure.
- Well-developed healthcare infrastructure.
- Early adoption of innovative technologies.
- Market Dominance: Oncology application, North America region, and full-ring PET scanners.
PET Scanner Industry Product Analysis
The PET scanner market is characterized by ongoing product innovation, focusing on improving image quality, reducing scan times, and enhancing patient comfort. Technological advancements include the development of time-of-flight (TOF) PET scanners, which offer superior image resolution and sensitivity. Full-ring PET scanners remain the dominant product type, though partial-ring scanners find applications in specialized settings. Competitive advantages are gained through superior image quality, faster scan times, advanced software features, and strong service and support networks.
Key Drivers, Barriers & Challenges in PET Scanner Industry
Key Drivers:
- Technological advancements (TOF PET, improved detectors).
- Rising prevalence of cancer and other diseases requiring PET scans.
- Increased healthcare spending and improved healthcare infrastructure.
- Favorable regulatory policies promoting advanced medical technologies.
Key Challenges:
- High cost of equipment and maintenance.
- Stringent regulatory requirements and approvals.
- Limited availability of skilled professionals for operation and maintenance.
- Intense competition among established players. The impact of these challenges is estimated to cause a xx Million reduction in potential market size in 2033.
Growth Drivers in the PET Scanner Industry Market
The PET scanner industry is driven by several factors. Technological advancements, such as TOF PET and improved detector technology, enhance image quality and diagnostic accuracy. The increasing prevalence of cancer and other diseases requiring PET scans fuels demand. Rising healthcare spending and infrastructure improvements in emerging markets create growth opportunities. Furthermore, supportive regulatory policies promoting the adoption of innovative medical technologies facilitate market expansion.
Challenges Impacting PET Scanner Industry Growth
Significant barriers hinder PET scanner market growth. The high cost of equipment and maintenance limits accessibility, particularly in resource-constrained settings. Stringent regulatory requirements and approval processes create hurdles for market entry. A shortage of skilled professionals to operate and maintain the equipment poses a significant challenge. Finally, intense competition among established players impacts market share and profitability.
Key Players Shaping the PET Scanner Industry Market
- CMR Naviscan
- Oncovision
- Mediso Ltd
- Segami Corporation
- Agfa Healthcare
- Siemens Healthineers AG
- Cardinal Health
- General Electric Company (GE Healthcare)
- Koninklijke Philips NV
- Neusoft Corporation
- Biosensors International (Spectrum Dynamics Ltd)
- Positron Corporation
Significant PET Scanner Industry Industry Milestones
- August 2022: Positron Corporation purchased its first PET-CT system from Neusoft Medical Systems.
- July 2022: Radialis Inc. received US market clearance for its Radialis PET Imager.
Future Outlook for PET Scanner Industry Market
The PET scanner market is poised for continued growth, driven by technological advancements, increasing prevalence of target diseases, and expanding healthcare infrastructure. Strategic partnerships and acquisitions will reshape the competitive landscape. Focus on improved image quality, reduced scan times, and cost-effectiveness will shape future product development. Emerging markets offer significant growth potential, while established markets will see growth driven by upgrades and replacements of older systems. The market is expected to show sustained expansion throughout the forecast period.
PET Scanner Industry Segmentation
-
1. Product Type
- 1.1. Full Ring PET Scanners
- 1.2. Partial Ring PET Scanners
-
2. Application
- 2.1. Cardiology
- 2.2. Neurology
- 2.3. Oncology
- 2.4. Other Applications
-
3. End-User
- 3.1. Hospitals
- 3.2. Diagnostic Centers
- 3.3. Other End-Users
PET Scanner Industry Segmentation By Geography
-
1. North America
- 1.1. United States
- 1.2. Canada
- 1.3. Mexico
-
2. Europe
- 2.1. Germany
- 2.2. United Kingdom
- 2.3. France
- 2.4. Italy
- 2.5. Spain
- 2.6. Rest of Europe
-
3. Asia Pacific
- 3.1. China
- 3.2. Japan
- 3.3. India
- 3.4. Australia
- 3.5. South Korea
- 3.6. Rest of Asia Pacific
-
4. Middle East and Africa
- 4.1. GCC
- 4.2. South Africa
- 4.3. Rest of Middle East and Africa
-
5. South America
- 5.1. Brazil
- 5.2. Argentina
- 5.3. Rest of South America
PET Scanner Industry REPORT HIGHLIGHTS
| Aspects | Details |
|---|---|
| Study Period | 2019-2033 |
| Base Year | 2024 |
| Estimated Year | 2025 |
| Forecast Period | 2025-2033 |
| Historical Period | 2019-2024 |
| Growth Rate | CAGR of 3.71% from 2019-2033 |
| Segmentation |
|
Table of Contents
- 1. Introduction
- 1.1. Research Scope
- 1.2. Market Segmentation
- 1.3. Research Methodology
- 1.4. Definitions and Assumptions
- 2. Executive Summary
- 2.1. Introduction
- 3. Market Dynamics
- 3.1. Introduction
- 3.2. Market Drivers
- 3.2.1. Increasing Demand for PET Analysis in Radio Pharmaceuticals; Technological Advancements in PET Imaging for Oncology and Advanced Diagnostics Applications; Integration of X-ray Tomography (CT) into PET
- 3.3. Market Restrains
- 3.3.1. Shorter Half-life of Radioisotopes; Stringent Regulatory Guidelines
- 3.4. Market Trends
- 3.4.1. The Oncology Segment is Expected to Hold a Significant Market Share Over the Forecast Period
- 4. Market Factor Analysis
- 4.1. Porters Five Forces
- 4.2. Supply/Value Chain
- 4.3. PESTEL analysis
- 4.4. Market Entropy
- 4.5. Patent/Trademark Analysis
- 5. Global PET Scanner Industry Analysis, Insights and Forecast, 2019-2031
- 5.1. Market Analysis, Insights and Forecast - by Product Type
- 5.1.1. Full Ring PET Scanners
- 5.1.2. Partial Ring PET Scanners
- 5.2. Market Analysis, Insights and Forecast - by Application
- 5.2.1. Cardiology
- 5.2.2. Neurology
- 5.2.3. Oncology
- 5.2.4. Other Applications
- 5.3. Market Analysis, Insights and Forecast - by End-User
- 5.3.1. Hospitals
- 5.3.2. Diagnostic Centers
- 5.3.3. Other End-Users
- 5.4. Market Analysis, Insights and Forecast - by Region
- 5.4.1. North America
- 5.4.2. Europe
- 5.4.3. Asia Pacific
- 5.4.4. Middle East and Africa
- 5.4.5. South America
- 5.1. Market Analysis, Insights and Forecast - by Product Type
- 6. North America PET Scanner Industry Analysis, Insights and Forecast, 2019-2031
- 6.1. Market Analysis, Insights and Forecast - by Product Type
- 6.1.1. Full Ring PET Scanners
- 6.1.2. Partial Ring PET Scanners
- 6.2. Market Analysis, Insights and Forecast - by Application
- 6.2.1. Cardiology
- 6.2.2. Neurology
- 6.2.3. Oncology
- 6.2.4. Other Applications
- 6.3. Market Analysis, Insights and Forecast - by End-User
- 6.3.1. Hospitals
- 6.3.2. Diagnostic Centers
- 6.3.3. Other End-Users
- 6.1. Market Analysis, Insights and Forecast - by Product Type
- 7. Europe PET Scanner Industry Analysis, Insights and Forecast, 2019-2031
- 7.1. Market Analysis, Insights and Forecast - by Product Type
- 7.1.1. Full Ring PET Scanners
- 7.1.2. Partial Ring PET Scanners
- 7.2. Market Analysis, Insights and Forecast - by Application
- 7.2.1. Cardiology
- 7.2.2. Neurology
- 7.2.3. Oncology
- 7.2.4. Other Applications
- 7.3. Market Analysis, Insights and Forecast - by End-User
- 7.3.1. Hospitals
- 7.3.2. Diagnostic Centers
- 7.3.3. Other End-Users
- 7.1. Market Analysis, Insights and Forecast - by Product Type
- 8. Asia Pacific PET Scanner Industry Analysis, Insights and Forecast, 2019-2031
- 8.1. Market Analysis, Insights and Forecast - by Product Type
- 8.1.1. Full Ring PET Scanners
- 8.1.2. Partial Ring PET Scanners
- 8.2. Market Analysis, Insights and Forecast - by Application
- 8.2.1. Cardiology
- 8.2.2. Neurology
- 8.2.3. Oncology
- 8.2.4. Other Applications
- 8.3. Market Analysis, Insights and Forecast - by End-User
- 8.3.1. Hospitals
- 8.3.2. Diagnostic Centers
- 8.3.3. Other End-Users
- 8.1. Market Analysis, Insights and Forecast - by Product Type
- 9. Middle East and Africa PET Scanner Industry Analysis, Insights and Forecast, 2019-2031
- 9.1. Market Analysis, Insights and Forecast - by Product Type
- 9.1.1. Full Ring PET Scanners
- 9.1.2. Partial Ring PET Scanners
- 9.2. Market Analysis, Insights and Forecast - by Application
- 9.2.1. Cardiology
- 9.2.2. Neurology
- 9.2.3. Oncology
- 9.2.4. Other Applications
- 9.3. Market Analysis, Insights and Forecast - by End-User
- 9.3.1. Hospitals
- 9.3.2. Diagnostic Centers
- 9.3.3. Other End-Users
- 9.1. Market Analysis, Insights and Forecast - by Product Type
- 10. South America PET Scanner Industry Analysis, Insights and Forecast, 2019-2031
- 10.1. Market Analysis, Insights and Forecast - by Product Type
- 10.1.1. Full Ring PET Scanners
- 10.1.2. Partial Ring PET Scanners
- 10.2. Market Analysis, Insights and Forecast - by Application
- 10.2.1. Cardiology
- 10.2.2. Neurology
- 10.2.3. Oncology
- 10.2.4. Other Applications
- 10.3. Market Analysis, Insights and Forecast - by End-User
- 10.3.1. Hospitals
- 10.3.2. Diagnostic Centers
- 10.3.3. Other End-Users
- 10.1. Market Analysis, Insights and Forecast - by Product Type
- 11. North America PET Scanner Industry Analysis, Insights and Forecast, 2019-2031
- 11.1. Market Analysis, Insights and Forecast - By Country/Sub-region
- 11.1.1 United States
- 11.1.2 Canada
- 11.1.3 Mexico
- 12. Europe PET Scanner Industry Analysis, Insights and Forecast, 2019-2031
- 12.1. Market Analysis, Insights and Forecast - By Country/Sub-region
- 12.1.1 Germany
- 12.1.2 United Kingdom
- 12.1.3 France
- 12.1.4 Italy
- 12.1.5 Spain
- 12.1.6 Rest of Europe
- 13. Asia Pacific PET Scanner Industry Analysis, Insights and Forecast, 2019-2031
- 13.1. Market Analysis, Insights and Forecast - By Country/Sub-region
- 13.1.1 China
- 13.1.2 Japan
- 13.1.3 India
- 13.1.4 Australia
- 13.1.5 South Korea
- 13.1.6 Rest of Asia Pacific
- 14. Middle East and Africa PET Scanner Industry Analysis, Insights and Forecast, 2019-2031
- 14.1. Market Analysis, Insights and Forecast - By Country/Sub-region
- 14.1.1 GCC
- 14.1.2 South Africa
- 14.1.3 Rest of Middle East and Africa
- 15. South America PET Scanner Industry Analysis, Insights and Forecast, 2019-2031
- 15.1. Market Analysis, Insights and Forecast - By Country/Sub-region
- 15.1.1 Brazil
- 15.1.2 Argentina
- 15.1.3 Rest of South America
- 16. Competitive Analysis
- 16.1. Global Market Share Analysis 2024
- 16.2. Company Profiles
- 16.2.1 CMR Naviscan
- 16.2.1.1. Overview
- 16.2.1.2. Products
- 16.2.1.3. SWOT Analysis
- 16.2.1.4. Recent Developments
- 16.2.1.5. Financials (Based on Availability)
- 16.2.2 Oncovision
- 16.2.2.1. Overview
- 16.2.2.2. Products
- 16.2.2.3. SWOT Analysis
- 16.2.2.4. Recent Developments
- 16.2.2.5. Financials (Based on Availability)
- 16.2.3 Mediso Ltd
- 16.2.3.1. Overview
- 16.2.3.2. Products
- 16.2.3.3. SWOT Analysis
- 16.2.3.4. Recent Developments
- 16.2.3.5. Financials (Based on Availability)
- 16.2.4 Segami Corporation
- 16.2.4.1. Overview
- 16.2.4.2. Products
- 16.2.4.3. SWOT Analysis
- 16.2.4.4. Recent Developments
- 16.2.4.5. Financials (Based on Availability)
- 16.2.5 Agfa Healthcare
- 16.2.5.1. Overview
- 16.2.5.2. Products
- 16.2.5.3. SWOT Analysis
- 16.2.5.4. Recent Developments
- 16.2.5.5. Financials (Based on Availability)
- 16.2.6 Siemens Healthineers AG
- 16.2.6.1. Overview
- 16.2.6.2. Products
- 16.2.6.3. SWOT Analysis
- 16.2.6.4. Recent Developments
- 16.2.6.5. Financials (Based on Availability)
- 16.2.7 Cardinal Health
- 16.2.7.1. Overview
- 16.2.7.2. Products
- 16.2.7.3. SWOT Analysis
- 16.2.7.4. Recent Developments
- 16.2.7.5. Financials (Based on Availability)
- 16.2.8 General Electric Company (GE Healthcare)
- 16.2.8.1. Overview
- 16.2.8.2. Products
- 16.2.8.3. SWOT Analysis
- 16.2.8.4. Recent Developments
- 16.2.8.5. Financials (Based on Availability)
- 16.2.9 Koninklijke Philips NV
- 16.2.9.1. Overview
- 16.2.9.2. Products
- 16.2.9.3. SWOT Analysis
- 16.2.9.4. Recent Developments
- 16.2.9.5. Financials (Based on Availability)
- 16.2.10 Neusoft Corporation
- 16.2.10.1. Overview
- 16.2.10.2. Products
- 16.2.10.3. SWOT Analysis
- 16.2.10.4. Recent Developments
- 16.2.10.5. Financials (Based on Availability)
- 16.2.11 Biosensors International (Spectrum Dynamics Ltd)
- 16.2.11.1. Overview
- 16.2.11.2. Products
- 16.2.11.3. SWOT Analysis
- 16.2.11.4. Recent Developments
- 16.2.11.5. Financials (Based on Availability)
- 16.2.12 Positron Corporation
- 16.2.12.1. Overview
- 16.2.12.2. Products
- 16.2.12.3. SWOT Analysis
- 16.2.12.4. Recent Developments
- 16.2.12.5. Financials (Based on Availability)
- 16.2.1 CMR Naviscan
List of Figures
- Figure 1: Global PET Scanner Industry Revenue Breakdown (Million, %) by Region 2024 & 2032
- Figure 2: Global PET Scanner Industry Volume Breakdown (K Unit, %) by Region 2024 & 2032
- Figure 3: North America PET Scanner Industry Revenue (Million), by Country 2024 & 2032
- Figure 4: North America PET Scanner Industry Volume (K Unit), by Country 2024 & 2032
- Figure 5: North America PET Scanner Industry Revenue Share (%), by Country 2024 & 2032
- Figure 6: North America PET Scanner Industry Volume Share (%), by Country 2024 & 2032
- Figure 7: Europe PET Scanner Industry Revenue (Million), by Country 2024 & 2032
- Figure 8: Europe PET Scanner Industry Volume (K Unit), by Country 2024 & 2032
- Figure 9: Europe PET Scanner Industry Revenue Share (%), by Country 2024 & 2032
- Figure 10: Europe PET Scanner Industry Volume Share (%), by Country 2024 & 2032
- Figure 11: Asia Pacific PET Scanner Industry Revenue (Million), by Country 2024 & 2032
- Figure 12: Asia Pacific PET Scanner Industry Volume (K Unit), by Country 2024 & 2032
- Figure 13: Asia Pacific PET Scanner Industry Revenue Share (%), by Country 2024 & 2032
- Figure 14: Asia Pacific PET Scanner Industry Volume Share (%), by Country 2024 & 2032
- Figure 15: Middle East and Africa PET Scanner Industry Revenue (Million), by Country 2024 & 2032
- Figure 16: Middle East and Africa PET Scanner Industry Volume (K Unit), by Country 2024 & 2032
- Figure 17: Middle East and Africa PET Scanner Industry Revenue Share (%), by Country 2024 & 2032
- Figure 18: Middle East and Africa PET Scanner Industry Volume Share (%), by Country 2024 & 2032
- Figure 19: South America PET Scanner Industry Revenue (Million), by Country 2024 & 2032
- Figure 20: South America PET Scanner Industry Volume (K Unit), by Country 2024 & 2032
- Figure 21: South America PET Scanner Industry Revenue Share (%), by Country 2024 & 2032
- Figure 22: South America PET Scanner Industry Volume Share (%), by Country 2024 & 2032
- Figure 23: North America PET Scanner Industry Revenue (Million), by Product Type 2024 & 2032
- Figure 24: North America PET Scanner Industry Volume (K Unit), by Product Type 2024 & 2032
- Figure 25: North America PET Scanner Industry Revenue Share (%), by Product Type 2024 & 2032
- Figure 26: North America PET Scanner Industry Volume Share (%), by Product Type 2024 & 2032
- Figure 27: North America PET Scanner Industry Revenue (Million), by Application 2024 & 2032
- Figure 28: North America PET Scanner Industry Volume (K Unit), by Application 2024 & 2032
- Figure 29: North America PET Scanner Industry Revenue Share (%), by Application 2024 & 2032
- Figure 30: North America PET Scanner Industry Volume Share (%), by Application 2024 & 2032
- Figure 31: North America PET Scanner Industry Revenue (Million), by End-User 2024 & 2032
- Figure 32: North America PET Scanner Industry Volume (K Unit), by End-User 2024 & 2032
- Figure 33: North America PET Scanner Industry Revenue Share (%), by End-User 2024 & 2032
- Figure 34: North America PET Scanner Industry Volume Share (%), by End-User 2024 & 2032
- Figure 35: North America PET Scanner Industry Revenue (Million), by Country 2024 & 2032
- Figure 36: North America PET Scanner Industry Volume (K Unit), by Country 2024 & 2032
- Figure 37: North America PET Scanner Industry Revenue Share (%), by Country 2024 & 2032
- Figure 38: North America PET Scanner Industry Volume Share (%), by Country 2024 & 2032
- Figure 39: Europe PET Scanner Industry Revenue (Million), by Product Type 2024 & 2032
- Figure 40: Europe PET Scanner Industry Volume (K Unit), by Product Type 2024 & 2032
- Figure 41: Europe PET Scanner Industry Revenue Share (%), by Product Type 2024 & 2032
- Figure 42: Europe PET Scanner Industry Volume Share (%), by Product Type 2024 & 2032
- Figure 43: Europe PET Scanner Industry Revenue (Million), by Application 2024 & 2032
- Figure 44: Europe PET Scanner Industry Volume (K Unit), by Application 2024 & 2032
- Figure 45: Europe PET Scanner Industry Revenue Share (%), by Application 2024 & 2032
- Figure 46: Europe PET Scanner Industry Volume Share (%), by Application 2024 & 2032
- Figure 47: Europe PET Scanner Industry Revenue (Million), by End-User 2024 & 2032
- Figure 48: Europe PET Scanner Industry Volume (K Unit), by End-User 2024 & 2032
- Figure 49: Europe PET Scanner Industry Revenue Share (%), by End-User 2024 & 2032
- Figure 50: Europe PET Scanner Industry Volume Share (%), by End-User 2024 & 2032
- Figure 51: Europe PET Scanner Industry Revenue (Million), by Country 2024 & 2032
- Figure 52: Europe PET Scanner Industry Volume (K Unit), by Country 2024 & 2032
- Figure 53: Europe PET Scanner Industry Revenue Share (%), by Country 2024 & 2032
- Figure 54: Europe PET Scanner Industry Volume Share (%), by Country 2024 & 2032
- Figure 55: Asia Pacific PET Scanner Industry Revenue (Million), by Product Type 2024 & 2032
- Figure 56: Asia Pacific PET Scanner Industry Volume (K Unit), by Product Type 2024 & 2032
- Figure 57: Asia Pacific PET Scanner Industry Revenue Share (%), by Product Type 2024 & 2032
- Figure 58: Asia Pacific PET Scanner Industry Volume Share (%), by Product Type 2024 & 2032
- Figure 59: Asia Pacific PET Scanner Industry Revenue (Million), by Application 2024 & 2032
- Figure 60: Asia Pacific PET Scanner Industry Volume (K Unit), by Application 2024 & 2032
- Figure 61: Asia Pacific PET Scanner Industry Revenue Share (%), by Application 2024 & 2032
- Figure 62: Asia Pacific PET Scanner Industry Volume Share (%), by Application 2024 & 2032
- Figure 63: Asia Pacific PET Scanner Industry Revenue (Million), by End-User 2024 & 2032
- Figure 64: Asia Pacific PET Scanner Industry Volume (K Unit), by End-User 2024 & 2032
- Figure 65: Asia Pacific PET Scanner Industry Revenue Share (%), by End-User 2024 & 2032
- Figure 66: Asia Pacific PET Scanner Industry Volume Share (%), by End-User 2024 & 2032
- Figure 67: Asia Pacific PET Scanner Industry Revenue (Million), by Country 2024 & 2032
- Figure 68: Asia Pacific PET Scanner Industry Volume (K Unit), by Country 2024 & 2032
- Figure 69: Asia Pacific PET Scanner Industry Revenue Share (%), by Country 2024 & 2032
- Figure 70: Asia Pacific PET Scanner Industry Volume Share (%), by Country 2024 & 2032
- Figure 71: Middle East and Africa PET Scanner Industry Revenue (Million), by Product Type 2024 & 2032
- Figure 72: Middle East and Africa PET Scanner Industry Volume (K Unit), by Product Type 2024 & 2032
- Figure 73: Middle East and Africa PET Scanner Industry Revenue Share (%), by Product Type 2024 & 2032
- Figure 74: Middle East and Africa PET Scanner Industry Volume Share (%), by Product Type 2024 & 2032
- Figure 75: Middle East and Africa PET Scanner Industry Revenue (Million), by Application 2024 & 2032
- Figure 76: Middle East and Africa PET Scanner Industry Volume (K Unit), by Application 2024 & 2032
- Figure 77: Middle East and Africa PET Scanner Industry Revenue Share (%), by Application 2024 & 2032
- Figure 78: Middle East and Africa PET Scanner Industry Volume Share (%), by Application 2024 & 2032
- Figure 79: Middle East and Africa PET Scanner Industry Revenue (Million), by End-User 2024 & 2032
- Figure 80: Middle East and Africa PET Scanner Industry Volume (K Unit), by End-User 2024 & 2032
- Figure 81: Middle East and Africa PET Scanner Industry Revenue Share (%), by End-User 2024 & 2032
- Figure 82: Middle East and Africa PET Scanner Industry Volume Share (%), by End-User 2024 & 2032
- Figure 83: Middle East and Africa PET Scanner Industry Revenue (Million), by Country 2024 & 2032
- Figure 84: Middle East and Africa PET Scanner Industry Volume (K Unit), by Country 2024 & 2032
- Figure 85: Middle East and Africa PET Scanner Industry Revenue Share (%), by Country 2024 & 2032
- Figure 86: Middle East and Africa PET Scanner Industry Volume Share (%), by Country 2024 & 2032
- Figure 87: South America PET Scanner Industry Revenue (Million), by Product Type 2024 & 2032
- Figure 88: South America PET Scanner Industry Volume (K Unit), by Product Type 2024 & 2032
- Figure 89: South America PET Scanner Industry Revenue Share (%), by Product Type 2024 & 2032
- Figure 90: South America PET Scanner Industry Volume Share (%), by Product Type 2024 & 2032
- Figure 91: South America PET Scanner Industry Revenue (Million), by Application 2024 & 2032
- Figure 92: South America PET Scanner Industry Volume (K Unit), by Application 2024 & 2032
- Figure 93: South America PET Scanner Industry Revenue Share (%), by Application 2024 & 2032
- Figure 94: South America PET Scanner Industry Volume Share (%), by Application 2024 & 2032
- Figure 95: South America PET Scanner Industry Revenue (Million), by End-User 2024 & 2032
- Figure 96: South America PET Scanner Industry Volume (K Unit), by End-User 2024 & 2032
- Figure 97: South America PET Scanner Industry Revenue Share (%), by End-User 2024 & 2032
- Figure 98: South America PET Scanner Industry Volume Share (%), by End-User 2024 & 2032
- Figure 99: South America PET Scanner Industry Revenue (Million), by Country 2024 & 2032
- Figure 100: South America PET Scanner Industry Volume (K Unit), by Country 2024 & 2032
- Figure 101: South America PET Scanner Industry Revenue Share (%), by Country 2024 & 2032
- Figure 102: South America PET Scanner Industry Volume Share (%), by Country 2024 & 2032
List of Tables
- Table 1: Global PET Scanner Industry Revenue Million Forecast, by Region 2019 & 2032
- Table 2: Global PET Scanner Industry Volume K Unit Forecast, by Region 2019 & 2032
- Table 3: Global PET Scanner Industry Revenue Million Forecast, by Product Type 2019 & 2032
- Table 4: Global PET Scanner Industry Volume K Unit Forecast, by Product Type 2019 & 2032
- Table 5: Global PET Scanner Industry Revenue Million Forecast, by Application 2019 & 2032
- Table 6: Global PET Scanner Industry Volume K Unit Forecast, by Application 2019 & 2032
- Table 7: Global PET Scanner Industry Revenue Million Forecast, by End-User 2019 & 2032
- Table 8: Global PET Scanner Industry Volume K Unit Forecast, by End-User 2019 & 2032
- Table 9: Global PET Scanner Industry Revenue Million Forecast, by Region 2019 & 2032
- Table 10: Global PET Scanner Industry Volume K Unit Forecast, by Region 2019 & 2032
- Table 11: Global PET Scanner Industry Revenue Million Forecast, by Country 2019 & 2032
- Table 12: Global PET Scanner Industry Volume K Unit Forecast, by Country 2019 & 2032
- Table 13: United States PET Scanner Industry Revenue (Million) Forecast, by Application 2019 & 2032
- Table 14: United States PET Scanner Industry Volume (K Unit) Forecast, by Application 2019 & 2032
- Table 15: Canada PET Scanner Industry Revenue (Million) Forecast, by Application 2019 & 2032
- Table 16: Canada PET Scanner Industry Volume (K Unit) Forecast, by Application 2019 & 2032
- Table 17: Mexico PET Scanner Industry Revenue (Million) Forecast, by Application 2019 & 2032
- Table 18: Mexico PET Scanner Industry Volume (K Unit) Forecast, by Application 2019 & 2032
- Table 19: Global PET Scanner Industry Revenue Million Forecast, by Country 2019 & 2032
- Table 20: Global PET Scanner Industry Volume K Unit Forecast, by Country 2019 & 2032
- Table 21: Germany PET Scanner Industry Revenue (Million) Forecast, by Application 2019 & 2032
- Table 22: Germany PET Scanner Industry Volume (K Unit) Forecast, by Application 2019 & 2032
- Table 23: United Kingdom PET Scanner Industry Revenue (Million) Forecast, by Application 2019 & 2032
- Table 24: United Kingdom PET Scanner Industry Volume (K Unit) Forecast, by Application 2019 & 2032
- Table 25: France PET Scanner Industry Revenue (Million) Forecast, by Application 2019 & 2032
- Table 26: France PET Scanner Industry Volume (K Unit) Forecast, by Application 2019 & 2032
- Table 27: Italy PET Scanner Industry Revenue (Million) Forecast, by Application 2019 & 2032
- Table 28: Italy PET Scanner Industry Volume (K Unit) Forecast, by Application 2019 & 2032
- Table 29: Spain PET Scanner Industry Revenue (Million) Forecast, by Application 2019 & 2032
- Table 30: Spain PET Scanner Industry Volume (K Unit) Forecast, by Application 2019 & 2032
- Table 31: Rest of Europe PET Scanner Industry Revenue (Million) Forecast, by Application 2019 & 2032
- Table 32: Rest of Europe PET Scanner Industry Volume (K Unit) Forecast, by Application 2019 & 2032
- Table 33: Global PET Scanner Industry Revenue Million Forecast, by Country 2019 & 2032
- Table 34: Global PET Scanner Industry Volume K Unit Forecast, by Country 2019 & 2032
- Table 35: China PET Scanner Industry Revenue (Million) Forecast, by Application 2019 & 2032
- Table 36: China PET Scanner Industry Volume (K Unit) Forecast, by Application 2019 & 2032
- Table 37: Japan PET Scanner Industry Revenue (Million) Forecast, by Application 2019 & 2032
- Table 38: Japan PET Scanner Industry Volume (K Unit) Forecast, by Application 2019 & 2032
- Table 39: India PET Scanner Industry Revenue (Million) Forecast, by Application 2019 & 2032
- Table 40: India PET Scanner Industry Volume (K Unit) Forecast, by Application 2019 & 2032
- Table 41: Australia PET Scanner Industry Revenue (Million) Forecast, by Application 2019 & 2032
- Table 42: Australia PET Scanner Industry Volume (K Unit) Forecast, by Application 2019 & 2032
- Table 43: South Korea PET Scanner Industry Revenue (Million) Forecast, by Application 2019 & 2032
- Table 44: South Korea PET Scanner Industry Volume (K Unit) Forecast, by Application 2019 & 2032
- Table 45: Rest of Asia Pacific PET Scanner Industry Revenue (Million) Forecast, by Application 2019 & 2032
- Table 46: Rest of Asia Pacific PET Scanner Industry Volume (K Unit) Forecast, by Application 2019 & 2032
- Table 47: Global PET Scanner Industry Revenue Million Forecast, by Country 2019 & 2032
- Table 48: Global PET Scanner Industry Volume K Unit Forecast, by Country 2019 & 2032
- Table 49: GCC PET Scanner Industry Revenue (Million) Forecast, by Application 2019 & 2032
- Table 50: GCC PET Scanner Industry Volume (K Unit) Forecast, by Application 2019 & 2032
- Table 51: South Africa PET Scanner Industry Revenue (Million) Forecast, by Application 2019 & 2032
- Table 52: South Africa PET Scanner Industry Volume (K Unit) Forecast, by Application 2019 & 2032
- Table 53: Rest of Middle East and Africa PET Scanner Industry Revenue (Million) Forecast, by Application 2019 & 2032
- Table 54: Rest of Middle East and Africa PET Scanner Industry Volume (K Unit) Forecast, by Application 2019 & 2032
- Table 55: Global PET Scanner Industry Revenue Million Forecast, by Country 2019 & 2032
- Table 56: Global PET Scanner Industry Volume K Unit Forecast, by Country 2019 & 2032
- Table 57: Brazil PET Scanner Industry Revenue (Million) Forecast, by Application 2019 & 2032
- Table 58: Brazil PET Scanner Industry Volume (K Unit) Forecast, by Application 2019 & 2032
- Table 59: Argentina PET Scanner Industry Revenue (Million) Forecast, by Application 2019 & 2032
- Table 60: Argentina PET Scanner Industry Volume (K Unit) Forecast, by Application 2019 & 2032
- Table 61: Rest of South America PET Scanner Industry Revenue (Million) Forecast, by Application 2019 & 2032
- Table 62: Rest of South America PET Scanner Industry Volume (K Unit) Forecast, by Application 2019 & 2032
- Table 63: Global PET Scanner Industry Revenue Million Forecast, by Product Type 2019 & 2032
- Table 64: Global PET Scanner Industry Volume K Unit Forecast, by Product Type 2019 & 2032
- Table 65: Global PET Scanner Industry Revenue Million Forecast, by Application 2019 & 2032
- Table 66: Global PET Scanner Industry Volume K Unit Forecast, by Application 2019 & 2032
- Table 67: Global PET Scanner Industry Revenue Million Forecast, by End-User 2019 & 2032
- Table 68: Global PET Scanner Industry Volume K Unit Forecast, by End-User 2019 & 2032
- Table 69: Global PET Scanner Industry Revenue Million Forecast, by Country 2019 & 2032
- Table 70: Global PET Scanner Industry Volume K Unit Forecast, by Country 2019 & 2032
- Table 71: United States PET Scanner Industry Revenue (Million) Forecast, by Application 2019 & 2032
- Table 72: United States PET Scanner Industry Volume (K Unit) Forecast, by Application 2019 & 2032
- Table 73: Canada PET Scanner Industry Revenue (Million) Forecast, by Application 2019 & 2032
- Table 74: Canada PET Scanner Industry Volume (K Unit) Forecast, by Application 2019 & 2032
- Table 75: Mexico PET Scanner Industry Revenue (Million) Forecast, by Application 2019 & 2032
- Table 76: Mexico PET Scanner Industry Volume (K Unit) Forecast, by Application 2019 & 2032
- Table 77: Global PET Scanner Industry Revenue Million Forecast, by Product Type 2019 & 2032
- Table 78: Global PET Scanner Industry Volume K Unit Forecast, by Product Type 2019 & 2032
- Table 79: Global PET Scanner Industry Revenue Million Forecast, by Application 2019 & 2032
- Table 80: Global PET Scanner Industry Volume K Unit Forecast, by Application 2019 & 2032
- Table 81: Global PET Scanner Industry Revenue Million Forecast, by End-User 2019 & 2032
- Table 82: Global PET Scanner Industry Volume K Unit Forecast, by End-User 2019 & 2032
- Table 83: Global PET Scanner Industry Revenue Million Forecast, by Country 2019 & 2032
- Table 84: Global PET Scanner Industry Volume K Unit Forecast, by Country 2019 & 2032
- Table 85: Germany PET Scanner Industry Revenue (Million) Forecast, by Application 2019 & 2032
- Table 86: Germany PET Scanner Industry Volume (K Unit) Forecast, by Application 2019 & 2032
- Table 87: United Kingdom PET Scanner Industry Revenue (Million) Forecast, by Application 2019 & 2032
- Table 88: United Kingdom PET Scanner Industry Volume (K Unit) Forecast, by Application 2019 & 2032
- Table 89: France PET Scanner Industry Revenue (Million) Forecast, by Application 2019 & 2032
- Table 90: France PET Scanner Industry Volume (K Unit) Forecast, by Application 2019 & 2032
- Table 91: Italy PET Scanner Industry Revenue (Million) Forecast, by Application 2019 & 2032
- Table 92: Italy PET Scanner Industry Volume (K Unit) Forecast, by Application 2019 & 2032
- Table 93: Spain PET Scanner Industry Revenue (Million) Forecast, by Application 2019 & 2032
- Table 94: Spain PET Scanner Industry Volume (K Unit) Forecast, by Application 2019 & 2032
- Table 95: Rest of Europe PET Scanner Industry Revenue (Million) Forecast, by Application 2019 & 2032
- Table 96: Rest of Europe PET Scanner Industry Volume (K Unit) Forecast, by Application 2019 & 2032
- Table 97: Global PET Scanner Industry Revenue Million Forecast, by Product Type 2019 & 2032
- Table 98: Global PET Scanner Industry Volume K Unit Forecast, by Product Type 2019 & 2032
- Table 99: Global PET Scanner Industry Revenue Million Forecast, by Application 2019 & 2032
- Table 100: Global PET Scanner Industry Volume K Unit Forecast, by Application 2019 & 2032
- Table 101: Global PET Scanner Industry Revenue Million Forecast, by End-User 2019 & 2032
- Table 102: Global PET Scanner Industry Volume K Unit Forecast, by End-User 2019 & 2032
- Table 103: Global PET Scanner Industry Revenue Million Forecast, by Country 2019 & 2032
- Table 104: Global PET Scanner Industry Volume K Unit Forecast, by Country 2019 & 2032
- Table 105: China PET Scanner Industry Revenue (Million) Forecast, by Application 2019 & 2032
- Table 106: China PET Scanner Industry Volume (K Unit) Forecast, by Application 2019 & 2032
- Table 107: Japan PET Scanner Industry Revenue (Million) Forecast, by Application 2019 & 2032
- Table 108: Japan PET Scanner Industry Volume (K Unit) Forecast, by Application 2019 & 2032
- Table 109: India PET Scanner Industry Revenue (Million) Forecast, by Application 2019 & 2032
- Table 110: India PET Scanner Industry Volume (K Unit) Forecast, by Application 2019 & 2032
- Table 111: Australia PET Scanner Industry Revenue (Million) Forecast, by Application 2019 & 2032
- Table 112: Australia PET Scanner Industry Volume (K Unit) Forecast, by Application 2019 & 2032
- Table 113: South Korea PET Scanner Industry Revenue (Million) Forecast, by Application 2019 & 2032
- Table 114: South Korea PET Scanner Industry Volume (K Unit) Forecast, by Application 2019 & 2032
- Table 115: Rest of Asia Pacific PET Scanner Industry Revenue (Million) Forecast, by Application 2019 & 2032
- Table 116: Rest of Asia Pacific PET Scanner Industry Volume (K Unit) Forecast, by Application 2019 & 2032
- Table 117: Global PET Scanner Industry Revenue Million Forecast, by Product Type 2019 & 2032
- Table 118: Global PET Scanner Industry Volume K Unit Forecast, by Product Type 2019 & 2032
- Table 119: Global PET Scanner Industry Revenue Million Forecast, by Application 2019 & 2032
- Table 120: Global PET Scanner Industry Volume K Unit Forecast, by Application 2019 & 2032
- Table 121: Global PET Scanner Industry Revenue Million Forecast, by End-User 2019 & 2032
- Table 122: Global PET Scanner Industry Volume K Unit Forecast, by End-User 2019 & 2032
- Table 123: Global PET Scanner Industry Revenue Million Forecast, by Country 2019 & 2032
- Table 124: Global PET Scanner Industry Volume K Unit Forecast, by Country 2019 & 2032
- Table 125: GCC PET Scanner Industry Revenue (Million) Forecast, by Application 2019 & 2032
- Table 126: GCC PET Scanner Industry Volume (K Unit) Forecast, by Application 2019 & 2032
- Table 127: South Africa PET Scanner Industry Revenue (Million) Forecast, by Application 2019 & 2032
- Table 128: South Africa PET Scanner Industry Volume (K Unit) Forecast, by Application 2019 & 2032
- Table 129: Rest of Middle East and Africa PET Scanner Industry Revenue (Million) Forecast, by Application 2019 & 2032
- Table 130: Rest of Middle East and Africa PET Scanner Industry Volume (K Unit) Forecast, by Application 2019 & 2032
- Table 131: Global PET Scanner Industry Revenue Million Forecast, by Product Type 2019 & 2032
- Table 132: Global PET Scanner Industry Volume K Unit Forecast, by Product Type 2019 & 2032
- Table 133: Global PET Scanner Industry Revenue Million Forecast, by Application 2019 & 2032
- Table 134: Global PET Scanner Industry Volume K Unit Forecast, by Application 2019 & 2032
- Table 135: Global PET Scanner Industry Revenue Million Forecast, by End-User 2019 & 2032
- Table 136: Global PET Scanner Industry Volume K Unit Forecast, by End-User 2019 & 2032
- Table 137: Global PET Scanner Industry Revenue Million Forecast, by Country 2019 & 2032
- Table 138: Global PET Scanner Industry Volume K Unit Forecast, by Country 2019 & 2032
- Table 139: Brazil PET Scanner Industry Revenue (Million) Forecast, by Application 2019 & 2032
- Table 140: Brazil PET Scanner Industry Volume (K Unit) Forecast, by Application 2019 & 2032
- Table 141: Argentina PET Scanner Industry Revenue (Million) Forecast, by Application 2019 & 2032
- Table 142: Argentina PET Scanner Industry Volume (K Unit) Forecast, by Application 2019 & 2032
- Table 143: Rest of South America PET Scanner Industry Revenue (Million) Forecast, by Application 2019 & 2032
- Table 144: Rest of South America PET Scanner Industry Volume (K Unit) Forecast, by Application 2019 & 2032
Frequently Asked Questions
1. What is the projected Compound Annual Growth Rate (CAGR) of the PET Scanner Industry?
The projected CAGR is approximately 3.71%.
2. Which companies are prominent players in the PET Scanner Industry?
Key companies in the market include CMR Naviscan, Oncovision, Mediso Ltd, Segami Corporation, Agfa Healthcare, Siemens Healthineers AG, Cardinal Health, General Electric Company (GE Healthcare), Koninklijke Philips NV, Neusoft Corporation, Biosensors International (Spectrum Dynamics Ltd), Positron Corporation.
3. What are the main segments of the PET Scanner Industry?
The market segments include Product Type, Application, End-User.
4. Can you provide details about the market size?
The market size is estimated to be USD 1.09 Million as of 2022.
5. What are some drivers contributing to market growth?
Increasing Demand for PET Analysis in Radio Pharmaceuticals; Technological Advancements in PET Imaging for Oncology and Advanced Diagnostics Applications; Integration of X-ray Tomography (CT) into PET.
6. What are the notable trends driving market growth?
The Oncology Segment is Expected to Hold a Significant Market Share Over the Forecast Period.
7. Are there any restraints impacting market growth?
Shorter Half-life of Radioisotopes; Stringent Regulatory Guidelines.
8. Can you provide examples of recent developments in the market?
August 2022- Positron Corporation, a nuclear medicine PET imaging device system and clinical services company, purchased its first PET-CT system and was on its way from its partner Neusoft Medical Systems. Positron's "Affinity PET-CT" system is on its way from China to its validation partner in the United States.
9. What pricing options are available for accessing the report?
Pricing options include single-user, multi-user, and enterprise licenses priced at USD 4750, USD 5250, and USD 8750 respectively.
10. Is the market size provided in terms of value or volume?
The market size is provided in terms of value, measured in Million and volume, measured in K Unit.
11. Are there any specific market keywords associated with the report?
Yes, the market keyword associated with the report is "PET Scanner Industry," which aids in identifying and referencing the specific market segment covered.
12. How do I determine which pricing option suits my needs best?
The pricing options vary based on user requirements and access needs. Individual users may opt for single-user licenses, while businesses requiring broader access may choose multi-user or enterprise licenses for cost-effective access to the report.
13. Are there any additional resources or data provided in the PET Scanner Industry report?
While the report offers comprehensive insights, it's advisable to review the specific contents or supplementary materials provided to ascertain if additional resources or data are available.
14. How can I stay updated on further developments or reports in the PET Scanner Industry?
To stay informed about further developments, trends, and reports in the PET Scanner Industry, consider subscribing to industry newsletters, following relevant companies and organizations, or regularly checking reputable industry news sources and publications.
Methodology
Step 1 - Identification of Relevant Samples Size from Population Database


Step 2 - Approaches for Defining Global Market Size (Value, Volume* & Price*)

Note*: In applicable scenarios
Step 3 - Data Sources
Primary Research
- Web Analytics
- Survey Reports
- Research Institute
- Latest Research Reports
- Opinion Leaders
Secondary Research
- Annual Reports
- White Paper
- Latest Press Release
- Industry Association
- Paid Database
- Investor Presentations

Step 4 - Data Triangulation
Involves using different sources of information in order to increase the validity of a study
These sources are likely to be stakeholders in a program - participants, other researchers, program staff, other community members, and so on.
Then we put all data in single framework & apply various statistical tools to find out the dynamic on the market.
During the analysis stage, feedback from the stakeholder groups would be compared to determine areas of agreement as well as areas of divergence
