

Key Insights
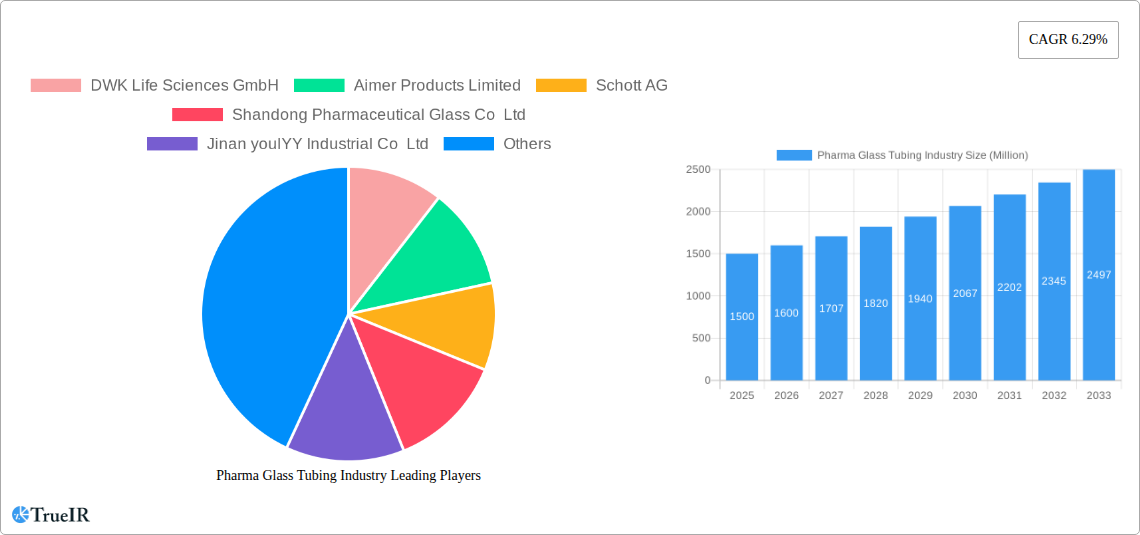
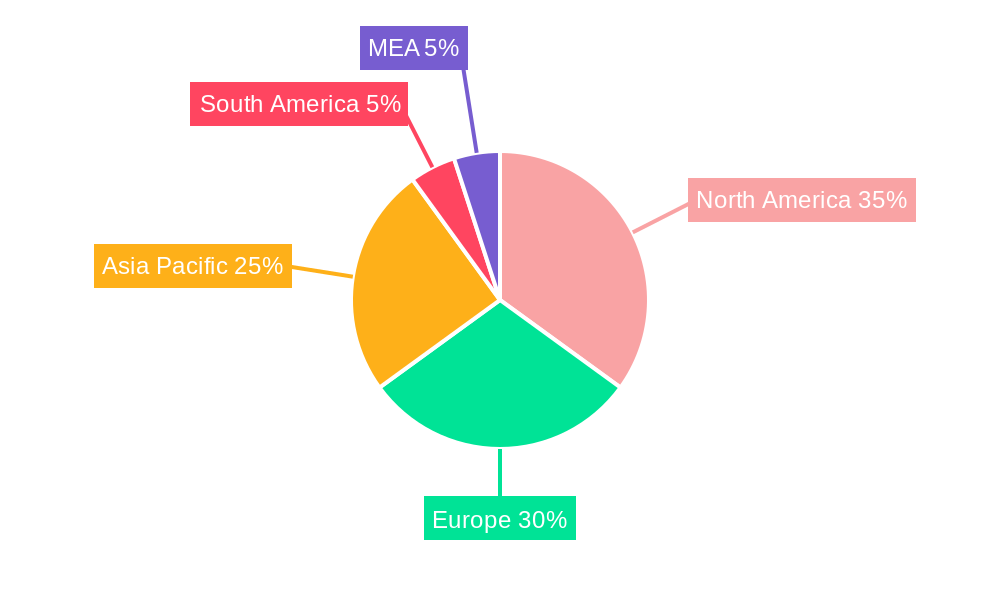
The pharmaceutical glass tubing market, valued at approximately $XX million in 2025, is projected to experience robust growth, exhibiting a compound annual growth rate (CAGR) of 6.29% from 2025 to 2033. This expansion is fueled by several key drivers. The increasing demand for injectable pharmaceuticals, driven by the growing prevalence of chronic diseases globally, significantly contributes to market growth. Furthermore, stringent regulatory requirements regarding the purity and sterility of drug packaging are pushing manufacturers to adopt high-quality pharmaceutical glass tubing, boosting market demand. Technological advancements in glass manufacturing processes, enabling the production of more durable and precise tubing, further propel market expansion. The market is segmented by application, with vials, ampoules, cartridges, and syringes representing significant segments, each with unique growth trajectories based on specific pharmaceutical product needs. North America and Europe currently dominate the market share, due to their established pharmaceutical industries and stringent regulatory frameworks. However, the Asia-Pacific region is poised for significant growth, driven by expanding healthcare infrastructure and rising pharmaceutical production in countries like China and India. Competitive pressures among established players like DWK Life Sciences GmbH, Schott AG, and Corning Incorporated, alongside emerging regional manufacturers, are shaping pricing and innovation within the market.
The market's growth trajectory is not without challenges. Fluctuations in raw material costs, particularly energy and silica sand, pose a risk to manufacturers’ profitability. Environmental regulations regarding glass production and disposal present another constraint. To mitigate these, manufacturers are increasingly adopting sustainable production practices and exploring alternative packaging materials. The market will also see increased consolidation as larger players acquire smaller manufacturers to gain market share and leverage economies of scale. Despite these restraints, the long-term outlook for the pharmaceutical glass tubing market remains positive, driven by persistent demand for injectable drugs and continuous innovation in both materials and manufacturing processes. The ongoing shift towards personalized medicine and the development of advanced drug delivery systems are expected to further fuel market growth in the coming years.
Pharma Glass Tubing Industry: A Comprehensive Market Report (2019-2033)
This dynamic report provides a comprehensive analysis of the global Pharma Glass Tubing industry, offering invaluable insights for stakeholders across the value chain. The study covers the period 2019-2033, with a focus on the estimated year 2025 and a forecast period of 2025-2033. The report leverages extensive primary and secondary research to deliver a detailed understanding of market size, growth drivers, competitive dynamics, and future outlook. Market values are expressed in Millions.
Pharma Glass Tubing Industry Market Structure & Competitive Landscape
The Pharma Glass Tubing market exhibits a moderately concentrated structure, with a few major players commanding significant market share. The Herfindahl-Hirschman Index (HHI) for 2024 is estimated at xx, indicating a moderately concentrated market. Key drivers of innovation include the demand for specialized glass types with enhanced properties (e.g., durability, chemical resistance) and the need for sustainable and environmentally friendly manufacturing processes. Regulatory impacts, including stringent quality control and safety standards, significantly shape market dynamics. Product substitutes, such as plastic alternatives, pose a growing challenge, but glass tubing retains a strong position due to its superior barrier properties. End-user segmentation is primarily driven by the pharmaceutical and biotechnology industries, with the largest demand from manufacturers of injectables and parenteral drug products. Mergers and acquisitions (M&A) activity has been moderate, with xx deals recorded between 2019 and 2024, totaling approximately $xx Million in value.
- Market Concentration: Moderately concentrated (HHI: xx in 2024)
- Innovation Drivers: Enhanced glass properties, sustainable manufacturing
- Regulatory Impacts: Stringent quality and safety standards
- Product Substitutes: Growing pressure from plastic alternatives
- End-User Segmentation: Dominated by pharmaceutical and biotech industries
- M&A Activity: xx deals between 2019 and 2024, totaling approximately $xx Million
Pharma Glass Tubing Industry Market Trends & Opportunities
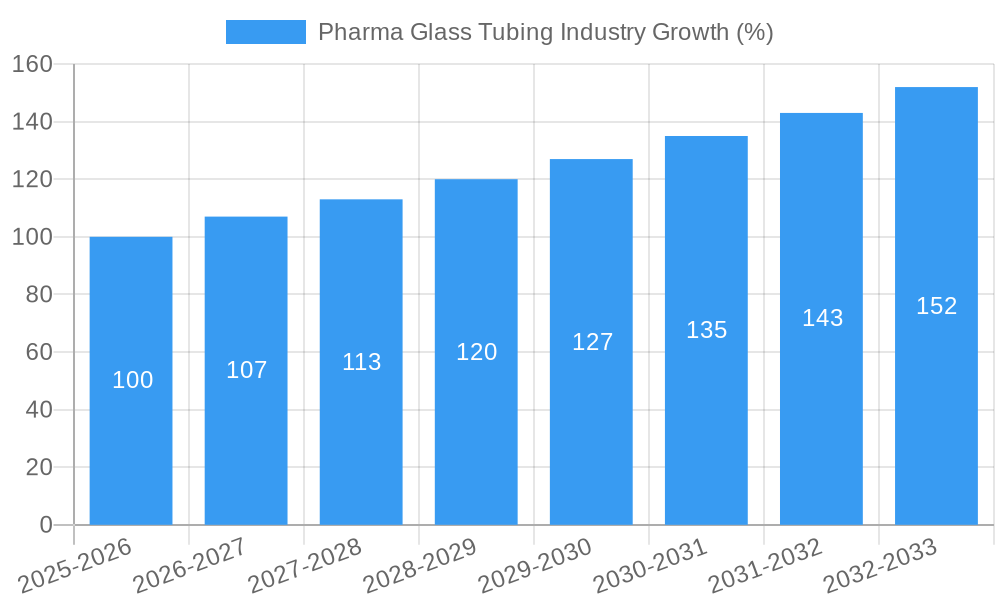
The global Pharma Glass Tubing market is projected to experience robust growth, with a Compound Annual Growth Rate (CAGR) of xx% during the forecast period (2025-2033). This growth is fueled by several key factors, including the increasing demand for injectable drugs, advancements in drug delivery technologies, and the expanding pharmaceutical and biotechnology sectors. Technological shifts towards automation and precision manufacturing are enhancing efficiency and reducing production costs. Consumer preferences are increasingly focused on safety, quality, and sustainability, driving demand for high-quality, environmentally friendly glass tubing. Competitive dynamics are characterized by intense competition among leading manufacturers, focusing on innovation, cost optimization, and strategic partnerships. Market penetration rates for specialized glass types, such as borosilicate glass, are projected to reach xx% by 2033.
Dominant Markets & Segments in Pharma Glass Tubing Industry
The North American region currently holds the largest market share in the Pharma Glass Tubing industry, driven by strong pharmaceutical manufacturing capabilities and high demand for injectable drugs. Europe is a close second, with significant contributions from several key players. Within application segments, vials constitute the largest share of the market, followed by ampoules and cartridges.
- Key Growth Drivers in North America: Robust pharmaceutical industry, high demand for injectables, stringent regulatory environment fostering high-quality standards.
- Key Growth Drivers in Europe: Strong presence of key players, investments in research and development, high standards for drug quality and safety.
- Segment Dominance: Vials > Ampoules > Cartridges > Syringes
Detailed Analysis: The dominance of vials stems from the widespread use of vials for storing and delivering liquid and powdered drugs. Ampoules, known for their single-dose capability and sterility, also command a significant market segment. The increasing trend of advanced drug delivery systems fuels the growth of cartridges and syringes segments. The continued preference for glass in these applications ensures consistent demand growth. Market size for vials is estimated at $xx Million in 2025, while ampoules are projected at $xx Million, cartridges at $xx Million, and syringes at $xx Million in the same year.
Pharma Glass Tubing Industry Product Analysis
Pharma glass tubing innovations center on improved chemical resistance, enhanced durability, and reduced breakage rates. Advanced manufacturing techniques, including automated production lines and precision cutting technologies, ensure consistently high product quality and efficiency. These advancements, combined with a strong focus on product safety and regulatory compliance, provide significant competitive advantages to manufacturers.
Key Drivers, Barriers & Challenges in Pharma Glass Tubing Industry
Key Drivers: The rising prevalence of chronic diseases driving demand for injectable drugs, technological advancements in drug delivery systems, and stringent regulatory requirements emphasizing high-quality glass tubing are key drivers for growth. Furthermore, expanding pharmaceutical and biotechnology sectors globally fuel demand.
Challenges: Supply chain disruptions, particularly in raw material sourcing, can impact production and pricing. Regulatory complexities and compliance requirements present significant hurdles. Intense competition among major manufacturers necessitates continuous innovation and cost-optimization strategies. For instance, a xx% increase in raw material prices in 2023 led to a xx% increase in the final product cost.
Growth Drivers in the Pharma Glass Tubing Industry Market
Technological advancements such as improved automation in glass tube production are streamlining the manufacturing process, leading to increased efficiency and cost reduction. Economic growth in emerging markets increases demand for pharmaceutical products, subsequently bolstering the demand for glass tubing. Stringent regulatory frameworks emphasizing pharmaceutical product safety and quality ensure a high demand for high-quality glass tubing.
Challenges Impacting Pharma Glass Tubing Industry Growth
Regulatory complexities and compliance requirements create significant barriers for manufacturers. Supply chain disruptions and fluctuations in raw material prices impact production costs. Intense competition from both established players and new entrants necessitates continuous innovation and cost optimization.
Key Players Shaping the Pharma Glass Tubing Industry Market
- DWK Life Sciences GmbH
- Aimer Products Limited
- Schott AG
- Shandong Pharmaceutical Glass Co Ltd
- Jinan youlYY Industrial Co Ltd
- Puyang New Harmony Industrial Development Co Ltd
- Cangzhou Four-star Glass Co Ltd
- Jinan Snail International Co Ltd
- Nippon Electric Glass Co Ltd
- LINUO Group
- Nipro Pharma Corporation
- Accu-Glass LLC
- Corning Incorporated
Significant Pharma Glass Tubing Industry Milestones
- 2021, Q3: Schott AG launches a new line of highly durable borosilicate glass tubing.
- 2022, Q1: DWK Life Sciences GmbH acquires a smaller competitor, expanding its market reach.
- 2023, Q4: Corning Incorporated announces a significant investment in its glass tubing production facilities. (Note: Specific details on these milestones would require further research for complete accuracy.)
Future Outlook for Pharma Glass Tubing Industry Market
The Pharma Glass Tubing market is poised for continued growth, driven by long-term trends in the pharmaceutical and biotechnology industries. Strategic opportunities lie in innovation, particularly in developing sustainable and environmentally friendly manufacturing processes, and expanding into emerging markets. The market's potential is vast, with the continued preference for glass tubing for pharmaceutical packaging ensuring a stable demand outlook.
Pharma Glass Tubing Industry Segmentation
-
1. Application
- 1.1. Vials
- 1.2. Ampoules
- 1.3. Cartridges
- 1.4. Syringes
Pharma Glass Tubing Industry Segmentation By Geography
-
1. North America
- 1.1. United States
- 1.2. Canada
-
2. Europe
- 2.1. Germany
- 2.2. United Kingdom
- 2.3. France
- 2.4. Rest of Europe
-
3. Asia Pacific
- 3.1. China
- 3.2. India
- 3.3. Japan
- 3.4. Rest of Asia Pacific
- 4. Latin America
- 5. Middle East and Africa
Pharma Glass Tubing Industry REPORT HIGHLIGHTS
| Aspects | Details |
|---|---|
| Study Period | 2019-2033 |
| Base Year | 2024 |
| Estimated Year | 2025 |
| Forecast Period | 2025-2033 |
| Historical Period | 2019-2024 |
| Growth Rate | CAGR of 6.29% from 2019-2033 |
| Segmentation |
|
Table of Contents
- 1. Introduction
- 1.1. Research Scope
- 1.2. Market Segmentation
- 1.3. Research Methodology
- 1.4. Definitions and Assumptions
- 2. Executive Summary
- 2.1. Introduction
- 3. Market Dynamics
- 3.1. Introduction
- 3.2. Market Drivers
- 3.2.1. ; Growth of the Pharmaceutical Industry in Emerging Economies; Commodity Value of Glass Increased with Recyclability
- 3.3. Market Restrains
- 3.3.1. ; Increased Relevance of Alternate Sources
- 3.4. Market Trends
- 3.4.1. Vials is Expected to Witness Significant Growth in Pharmaceutical sector
- 4. Market Factor Analysis
- 4.1. Porters Five Forces
- 4.2. Supply/Value Chain
- 4.3. PESTEL analysis
- 4.4. Market Entropy
- 4.5. Patent/Trademark Analysis
- 5. Global Pharma Glass Tubing Industry Analysis, Insights and Forecast, 2019-2031
- 5.1. Market Analysis, Insights and Forecast - by Application
- 5.1.1. Vials
- 5.1.2. Ampoules
- 5.1.3. Cartridges
- 5.1.4. Syringes
- 5.2. Market Analysis, Insights and Forecast - by Region
- 5.2.1. North America
- 5.2.2. Europe
- 5.2.3. Asia Pacific
- 5.2.4. Latin America
- 5.2.5. Middle East and Africa
- 5.1. Market Analysis, Insights and Forecast - by Application
- 6. North America Pharma Glass Tubing Industry Analysis, Insights and Forecast, 2019-2031
- 6.1. Market Analysis, Insights and Forecast - by Application
- 6.1.1. Vials
- 6.1.2. Ampoules
- 6.1.3. Cartridges
- 6.1.4. Syringes
- 6.1. Market Analysis, Insights and Forecast - by Application
- 7. Europe Pharma Glass Tubing Industry Analysis, Insights and Forecast, 2019-2031
- 7.1. Market Analysis, Insights and Forecast - by Application
- 7.1.1. Vials
- 7.1.2. Ampoules
- 7.1.3. Cartridges
- 7.1.4. Syringes
- 7.1. Market Analysis, Insights and Forecast - by Application
- 8. Asia Pacific Pharma Glass Tubing Industry Analysis, Insights and Forecast, 2019-2031
- 8.1. Market Analysis, Insights and Forecast - by Application
- 8.1.1. Vials
- 8.1.2. Ampoules
- 8.1.3. Cartridges
- 8.1.4. Syringes
- 8.1. Market Analysis, Insights and Forecast - by Application
- 9. Latin America Pharma Glass Tubing Industry Analysis, Insights and Forecast, 2019-2031
- 9.1. Market Analysis, Insights and Forecast - by Application
- 9.1.1. Vials
- 9.1.2. Ampoules
- 9.1.3. Cartridges
- 9.1.4. Syringes
- 9.1. Market Analysis, Insights and Forecast - by Application
- 10. Middle East and Africa Pharma Glass Tubing Industry Analysis, Insights and Forecast, 2019-2031
- 10.1. Market Analysis, Insights and Forecast - by Application
- 10.1.1. Vials
- 10.1.2. Ampoules
- 10.1.3. Cartridges
- 10.1.4. Syringes
- 10.1. Market Analysis, Insights and Forecast - by Application
- 11. North America Pharma Glass Tubing Industry Analysis, Insights and Forecast, 2019-2031
- 11.1. Market Analysis, Insights and Forecast - By Country/Sub-region
- 11.1.1 United States
- 11.1.2 Canada
- 11.1.3 Mexico
- 12. Europe Pharma Glass Tubing Industry Analysis, Insights and Forecast, 2019-2031
- 12.1. Market Analysis, Insights and Forecast - By Country/Sub-region
- 12.1.1 Germany
- 12.1.2 United Kingdom
- 12.1.3 France
- 12.1.4 Spain
- 12.1.5 Italy
- 12.1.6 Spain
- 12.1.7 Belgium
- 12.1.8 Netherland
- 12.1.9 Nordics
- 12.1.10 Rest of Europe
- 13. Asia Pacific Pharma Glass Tubing Industry Analysis, Insights and Forecast, 2019-2031
- 13.1. Market Analysis, Insights and Forecast - By Country/Sub-region
- 13.1.1 China
- 13.1.2 Japan
- 13.1.3 India
- 13.1.4 South Korea
- 13.1.5 Southeast Asia
- 13.1.6 Australia
- 13.1.7 Indonesia
- 13.1.8 Phillipes
- 13.1.9 Singapore
- 13.1.10 Thailandc
- 13.1.11 Rest of Asia Pacific
- 14. South America Pharma Glass Tubing Industry Analysis, Insights and Forecast, 2019-2031
- 14.1. Market Analysis, Insights and Forecast - By Country/Sub-region
- 14.1.1 Brazil
- 14.1.2 Argentina
- 14.1.3 Peru
- 14.1.4 Chile
- 14.1.5 Colombia
- 14.1.6 Ecuador
- 14.1.7 Venezuela
- 14.1.8 Rest of South America
- 15. North America Pharma Glass Tubing Industry Analysis, Insights and Forecast, 2019-2031
- 15.1. Market Analysis, Insights and Forecast - By Country/Sub-region
- 15.1.1 United States
- 15.1.2 Canada
- 15.1.3 Mexico
- 16. MEA Pharma Glass Tubing Industry Analysis, Insights and Forecast, 2019-2031
- 16.1. Market Analysis, Insights and Forecast - By Country/Sub-region
- 16.1.1 United Arab Emirates
- 16.1.2 Saudi Arabia
- 16.1.3 South Africa
- 16.1.4 Rest of Middle East and Africa
- 17. Competitive Analysis
- 17.1. Global Market Share Analysis 2024
- 17.2. Company Profiles
- 17.2.1 DWK Life Sciences GmbH
- 17.2.1.1. Overview
- 17.2.1.2. Products
- 17.2.1.3. SWOT Analysis
- 17.2.1.4. Recent Developments
- 17.2.1.5. Financials (Based on Availability)
- 17.2.2 Aimer Products Limited
- 17.2.2.1. Overview
- 17.2.2.2. Products
- 17.2.2.3. SWOT Analysis
- 17.2.2.4. Recent Developments
- 17.2.2.5. Financials (Based on Availability)
- 17.2.3 Schott AG
- 17.2.3.1. Overview
- 17.2.3.2. Products
- 17.2.3.3. SWOT Analysis
- 17.2.3.4. Recent Developments
- 17.2.3.5. Financials (Based on Availability)
- 17.2.4 Shandong Pharmaceutical Glass Co Ltd
- 17.2.4.1. Overview
- 17.2.4.2. Products
- 17.2.4.3. SWOT Analysis
- 17.2.4.4. Recent Developments
- 17.2.4.5. Financials (Based on Availability)
- 17.2.5 Jinan youlYY Industrial Co Ltd
- 17.2.5.1. Overview
- 17.2.5.2. Products
- 17.2.5.3. SWOT Analysis
- 17.2.5.4. Recent Developments
- 17.2.5.5. Financials (Based on Availability)
- 17.2.6 Puyang New Harmony Industrial Development Co Ltd
- 17.2.6.1. Overview
- 17.2.6.2. Products
- 17.2.6.3. SWOT Analysis
- 17.2.6.4. Recent Developments
- 17.2.6.5. Financials (Based on Availability)
- 17.2.7 Cangzhou Four-star Glass Co Ltd
- 17.2.7.1. Overview
- 17.2.7.2. Products
- 17.2.7.3. SWOT Analysis
- 17.2.7.4. Recent Developments
- 17.2.7.5. Financials (Based on Availability)
- 17.2.8 Jinan Snail International Co Ltd*List Not Exhaustive
- 17.2.8.1. Overview
- 17.2.8.2. Products
- 17.2.8.3. SWOT Analysis
- 17.2.8.4. Recent Developments
- 17.2.8.5. Financials (Based on Availability)
- 17.2.9 Nippon Electric Glass Co Ltd
- 17.2.9.1. Overview
- 17.2.9.2. Products
- 17.2.9.3. SWOT Analysis
- 17.2.9.4. Recent Developments
- 17.2.9.5. Financials (Based on Availability)
- 17.2.10 LINUO Group
- 17.2.10.1. Overview
- 17.2.10.2. Products
- 17.2.10.3. SWOT Analysis
- 17.2.10.4. Recent Developments
- 17.2.10.5. Financials (Based on Availability)
- 17.2.11 Nipro Pharma Corporation
- 17.2.11.1. Overview
- 17.2.11.2. Products
- 17.2.11.3. SWOT Analysis
- 17.2.11.4. Recent Developments
- 17.2.11.5. Financials (Based on Availability)
- 17.2.12 Accu-Glass LLC
- 17.2.12.1. Overview
- 17.2.12.2. Products
- 17.2.12.3. SWOT Analysis
- 17.2.12.4. Recent Developments
- 17.2.12.5. Financials (Based on Availability)
- 17.2.13 Corning Incorporated
- 17.2.13.1. Overview
- 17.2.13.2. Products
- 17.2.13.3. SWOT Analysis
- 17.2.13.4. Recent Developments
- 17.2.13.5. Financials (Based on Availability)
- 17.2.1 DWK Life Sciences GmbH
List of Figures
- Figure 1: Global Pharma Glass Tubing Industry Revenue Breakdown (Million, %) by Region 2024 & 2032
- Figure 2: North America Pharma Glass Tubing Industry Revenue (Million), by Country 2024 & 2032
- Figure 3: North America Pharma Glass Tubing Industry Revenue Share (%), by Country 2024 & 2032
- Figure 4: Europe Pharma Glass Tubing Industry Revenue (Million), by Country 2024 & 2032
- Figure 5: Europe Pharma Glass Tubing Industry Revenue Share (%), by Country 2024 & 2032
- Figure 6: Asia Pacific Pharma Glass Tubing Industry Revenue (Million), by Country 2024 & 2032
- Figure 7: Asia Pacific Pharma Glass Tubing Industry Revenue Share (%), by Country 2024 & 2032
- Figure 8: South America Pharma Glass Tubing Industry Revenue (Million), by Country 2024 & 2032
- Figure 9: South America Pharma Glass Tubing Industry Revenue Share (%), by Country 2024 & 2032
- Figure 10: North America Pharma Glass Tubing Industry Revenue (Million), by Country 2024 & 2032
- Figure 11: North America Pharma Glass Tubing Industry Revenue Share (%), by Country 2024 & 2032
- Figure 12: MEA Pharma Glass Tubing Industry Revenue (Million), by Country 2024 & 2032
- Figure 13: MEA Pharma Glass Tubing Industry Revenue Share (%), by Country 2024 & 2032
- Figure 14: North America Pharma Glass Tubing Industry Revenue (Million), by Application 2024 & 2032
- Figure 15: North America Pharma Glass Tubing Industry Revenue Share (%), by Application 2024 & 2032
- Figure 16: North America Pharma Glass Tubing Industry Revenue (Million), by Country 2024 & 2032
- Figure 17: North America Pharma Glass Tubing Industry Revenue Share (%), by Country 2024 & 2032
- Figure 18: Europe Pharma Glass Tubing Industry Revenue (Million), by Application 2024 & 2032
- Figure 19: Europe Pharma Glass Tubing Industry Revenue Share (%), by Application 2024 & 2032
- Figure 20: Europe Pharma Glass Tubing Industry Revenue (Million), by Country 2024 & 2032
- Figure 21: Europe Pharma Glass Tubing Industry Revenue Share (%), by Country 2024 & 2032
- Figure 22: Asia Pacific Pharma Glass Tubing Industry Revenue (Million), by Application 2024 & 2032
- Figure 23: Asia Pacific Pharma Glass Tubing Industry Revenue Share (%), by Application 2024 & 2032
- Figure 24: Asia Pacific Pharma Glass Tubing Industry Revenue (Million), by Country 2024 & 2032
- Figure 25: Asia Pacific Pharma Glass Tubing Industry Revenue Share (%), by Country 2024 & 2032
- Figure 26: Latin America Pharma Glass Tubing Industry Revenue (Million), by Application 2024 & 2032
- Figure 27: Latin America Pharma Glass Tubing Industry Revenue Share (%), by Application 2024 & 2032
- Figure 28: Latin America Pharma Glass Tubing Industry Revenue (Million), by Country 2024 & 2032
- Figure 29: Latin America Pharma Glass Tubing Industry Revenue Share (%), by Country 2024 & 2032
- Figure 30: Middle East and Africa Pharma Glass Tubing Industry Revenue (Million), by Application 2024 & 2032
- Figure 31: Middle East and Africa Pharma Glass Tubing Industry Revenue Share (%), by Application 2024 & 2032
- Figure 32: Middle East and Africa Pharma Glass Tubing Industry Revenue (Million), by Country 2024 & 2032
- Figure 33: Middle East and Africa Pharma Glass Tubing Industry Revenue Share (%), by Country 2024 & 2032
List of Tables
- Table 1: Global Pharma Glass Tubing Industry Revenue Million Forecast, by Region 2019 & 2032
- Table 2: Global Pharma Glass Tubing Industry Revenue Million Forecast, by Application 2019 & 2032
- Table 3: Global Pharma Glass Tubing Industry Revenue Million Forecast, by Region 2019 & 2032
- Table 4: Global Pharma Glass Tubing Industry Revenue Million Forecast, by Country 2019 & 2032
- Table 5: United States Pharma Glass Tubing Industry Revenue (Million) Forecast, by Application 2019 & 2032
- Table 6: Canada Pharma Glass Tubing Industry Revenue (Million) Forecast, by Application 2019 & 2032
- Table 7: Mexico Pharma Glass Tubing Industry Revenue (Million) Forecast, by Application 2019 & 2032
- Table 8: Global Pharma Glass Tubing Industry Revenue Million Forecast, by Country 2019 & 2032
- Table 9: Germany Pharma Glass Tubing Industry Revenue (Million) Forecast, by Application 2019 & 2032
- Table 10: United Kingdom Pharma Glass Tubing Industry Revenue (Million) Forecast, by Application 2019 & 2032
- Table 11: France Pharma Glass Tubing Industry Revenue (Million) Forecast, by Application 2019 & 2032
- Table 12: Spain Pharma Glass Tubing Industry Revenue (Million) Forecast, by Application 2019 & 2032
- Table 13: Italy Pharma Glass Tubing Industry Revenue (Million) Forecast, by Application 2019 & 2032
- Table 14: Spain Pharma Glass Tubing Industry Revenue (Million) Forecast, by Application 2019 & 2032
- Table 15: Belgium Pharma Glass Tubing Industry Revenue (Million) Forecast, by Application 2019 & 2032
- Table 16: Netherland Pharma Glass Tubing Industry Revenue (Million) Forecast, by Application 2019 & 2032
- Table 17: Nordics Pharma Glass Tubing Industry Revenue (Million) Forecast, by Application 2019 & 2032
- Table 18: Rest of Europe Pharma Glass Tubing Industry Revenue (Million) Forecast, by Application 2019 & 2032
- Table 19: Global Pharma Glass Tubing Industry Revenue Million Forecast, by Country 2019 & 2032
- Table 20: China Pharma Glass Tubing Industry Revenue (Million) Forecast, by Application 2019 & 2032
- Table 21: Japan Pharma Glass Tubing Industry Revenue (Million) Forecast, by Application 2019 & 2032
- Table 22: India Pharma Glass Tubing Industry Revenue (Million) Forecast, by Application 2019 & 2032
- Table 23: South Korea Pharma Glass Tubing Industry Revenue (Million) Forecast, by Application 2019 & 2032
- Table 24: Southeast Asia Pharma Glass Tubing Industry Revenue (Million) Forecast, by Application 2019 & 2032
- Table 25: Australia Pharma Glass Tubing Industry Revenue (Million) Forecast, by Application 2019 & 2032
- Table 26: Indonesia Pharma Glass Tubing Industry Revenue (Million) Forecast, by Application 2019 & 2032
- Table 27: Phillipes Pharma Glass Tubing Industry Revenue (Million) Forecast, by Application 2019 & 2032
- Table 28: Singapore Pharma Glass Tubing Industry Revenue (Million) Forecast, by Application 2019 & 2032
- Table 29: Thailandc Pharma Glass Tubing Industry Revenue (Million) Forecast, by Application 2019 & 2032
- Table 30: Rest of Asia Pacific Pharma Glass Tubing Industry Revenue (Million) Forecast, by Application 2019 & 2032
- Table 31: Global Pharma Glass Tubing Industry Revenue Million Forecast, by Country 2019 & 2032
- Table 32: Brazil Pharma Glass Tubing Industry Revenue (Million) Forecast, by Application 2019 & 2032
- Table 33: Argentina Pharma Glass Tubing Industry Revenue (Million) Forecast, by Application 2019 & 2032
- Table 34: Peru Pharma Glass Tubing Industry Revenue (Million) Forecast, by Application 2019 & 2032
- Table 35: Chile Pharma Glass Tubing Industry Revenue (Million) Forecast, by Application 2019 & 2032
- Table 36: Colombia Pharma Glass Tubing Industry Revenue (Million) Forecast, by Application 2019 & 2032
- Table 37: Ecuador Pharma Glass Tubing Industry Revenue (Million) Forecast, by Application 2019 & 2032
- Table 38: Venezuela Pharma Glass Tubing Industry Revenue (Million) Forecast, by Application 2019 & 2032
- Table 39: Rest of South America Pharma Glass Tubing Industry Revenue (Million) Forecast, by Application 2019 & 2032
- Table 40: Global Pharma Glass Tubing Industry Revenue Million Forecast, by Country 2019 & 2032
- Table 41: United States Pharma Glass Tubing Industry Revenue (Million) Forecast, by Application 2019 & 2032
- Table 42: Canada Pharma Glass Tubing Industry Revenue (Million) Forecast, by Application 2019 & 2032
- Table 43: Mexico Pharma Glass Tubing Industry Revenue (Million) Forecast, by Application 2019 & 2032
- Table 44: Global Pharma Glass Tubing Industry Revenue Million Forecast, by Country 2019 & 2032
- Table 45: United Arab Emirates Pharma Glass Tubing Industry Revenue (Million) Forecast, by Application 2019 & 2032
- Table 46: Saudi Arabia Pharma Glass Tubing Industry Revenue (Million) Forecast, by Application 2019 & 2032
- Table 47: South Africa Pharma Glass Tubing Industry Revenue (Million) Forecast, by Application 2019 & 2032
- Table 48: Rest of Middle East and Africa Pharma Glass Tubing Industry Revenue (Million) Forecast, by Application 2019 & 2032
- Table 49: Global Pharma Glass Tubing Industry Revenue Million Forecast, by Application 2019 & 2032
- Table 50: Global Pharma Glass Tubing Industry Revenue Million Forecast, by Country 2019 & 2032
- Table 51: United States Pharma Glass Tubing Industry Revenue (Million) Forecast, by Application 2019 & 2032
- Table 52: Canada Pharma Glass Tubing Industry Revenue (Million) Forecast, by Application 2019 & 2032
- Table 53: Global Pharma Glass Tubing Industry Revenue Million Forecast, by Application 2019 & 2032
- Table 54: Global Pharma Glass Tubing Industry Revenue Million Forecast, by Country 2019 & 2032
- Table 55: Germany Pharma Glass Tubing Industry Revenue (Million) Forecast, by Application 2019 & 2032
- Table 56: United Kingdom Pharma Glass Tubing Industry Revenue (Million) Forecast, by Application 2019 & 2032
- Table 57: France Pharma Glass Tubing Industry Revenue (Million) Forecast, by Application 2019 & 2032
- Table 58: Rest of Europe Pharma Glass Tubing Industry Revenue (Million) Forecast, by Application 2019 & 2032
- Table 59: Global Pharma Glass Tubing Industry Revenue Million Forecast, by Application 2019 & 2032
- Table 60: Global Pharma Glass Tubing Industry Revenue Million Forecast, by Country 2019 & 2032
- Table 61: China Pharma Glass Tubing Industry Revenue (Million) Forecast, by Application 2019 & 2032
- Table 62: India Pharma Glass Tubing Industry Revenue (Million) Forecast, by Application 2019 & 2032
- Table 63: Japan Pharma Glass Tubing Industry Revenue (Million) Forecast, by Application 2019 & 2032
- Table 64: Rest of Asia Pacific Pharma Glass Tubing Industry Revenue (Million) Forecast, by Application 2019 & 2032
- Table 65: Global Pharma Glass Tubing Industry Revenue Million Forecast, by Application 2019 & 2032
- Table 66: Global Pharma Glass Tubing Industry Revenue Million Forecast, by Country 2019 & 2032
- Table 67: Global Pharma Glass Tubing Industry Revenue Million Forecast, by Application 2019 & 2032
- Table 68: Global Pharma Glass Tubing Industry Revenue Million Forecast, by Country 2019 & 2032
Frequently Asked Questions
1. What is the projected Compound Annual Growth Rate (CAGR) of the Pharma Glass Tubing Industry?
The projected CAGR is approximately 6.29%.
2. Which companies are prominent players in the Pharma Glass Tubing Industry?
Key companies in the market include DWK Life Sciences GmbH, Aimer Products Limited, Schott AG, Shandong Pharmaceutical Glass Co Ltd, Jinan youlYY Industrial Co Ltd, Puyang New Harmony Industrial Development Co Ltd, Cangzhou Four-star Glass Co Ltd, Jinan Snail International Co Ltd*List Not Exhaustive, Nippon Electric Glass Co Ltd, LINUO Group, Nipro Pharma Corporation, Accu-Glass LLC, Corning Incorporated.
3. What are the main segments of the Pharma Glass Tubing Industry?
The market segments include Application.
4. Can you provide details about the market size?
The market size is estimated to be USD XX Million as of 2022.
5. What are some drivers contributing to market growth?
; Growth of the Pharmaceutical Industry in Emerging Economies; Commodity Value of Glass Increased with Recyclability.
6. What are the notable trends driving market growth?
Vials is Expected to Witness Significant Growth in Pharmaceutical sector.
7. Are there any restraints impacting market growth?
; Increased Relevance of Alternate Sources.
8. Can you provide examples of recent developments in the market?
N/A
9. What pricing options are available for accessing the report?
Pricing options include single-user, multi-user, and enterprise licenses priced at USD 4750, USD 5250, and USD 8750 respectively.
10. Is the market size provided in terms of value or volume?
The market size is provided in terms of value, measured in Million.
11. Are there any specific market keywords associated with the report?
Yes, the market keyword associated with the report is "Pharma Glass Tubing Industry," which aids in identifying and referencing the specific market segment covered.
12. How do I determine which pricing option suits my needs best?
The pricing options vary based on user requirements and access needs. Individual users may opt for single-user licenses, while businesses requiring broader access may choose multi-user or enterprise licenses for cost-effective access to the report.
13. Are there any additional resources or data provided in the Pharma Glass Tubing Industry report?
While the report offers comprehensive insights, it's advisable to review the specific contents or supplementary materials provided to ascertain if additional resources or data are available.
14. How can I stay updated on further developments or reports in the Pharma Glass Tubing Industry?
To stay informed about further developments, trends, and reports in the Pharma Glass Tubing Industry, consider subscribing to industry newsletters, following relevant companies and organizations, or regularly checking reputable industry news sources and publications.
Methodology
Step 1 - Identification of Relevant Samples Size from Population Database


Step 2 - Approaches for Defining Global Market Size (Value, Volume* & Price*)

Note*: In applicable scenarios
Step 3 - Data Sources
Primary Research
- Web Analytics
- Survey Reports
- Research Institute
- Latest Research Reports
- Opinion Leaders
Secondary Research
- Annual Reports
- White Paper
- Latest Press Release
- Industry Association
- Paid Database
- Investor Presentations

Step 4 - Data Triangulation
Involves using different sources of information in order to increase the validity of a study
These sources are likely to be stakeholders in a program - participants, other researchers, program staff, other community members, and so on.
Then we put all data in single framework & apply various statistical tools to find out the dynamic on the market.
During the analysis stage, feedback from the stakeholder groups would be compared to determine areas of agreement as well as areas of divergence
