

Key Insights
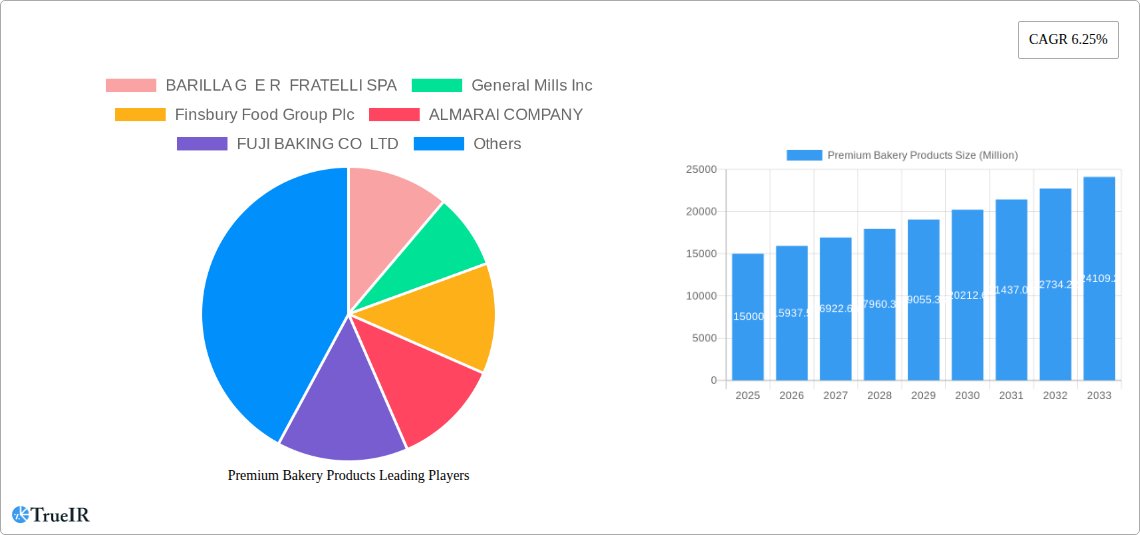
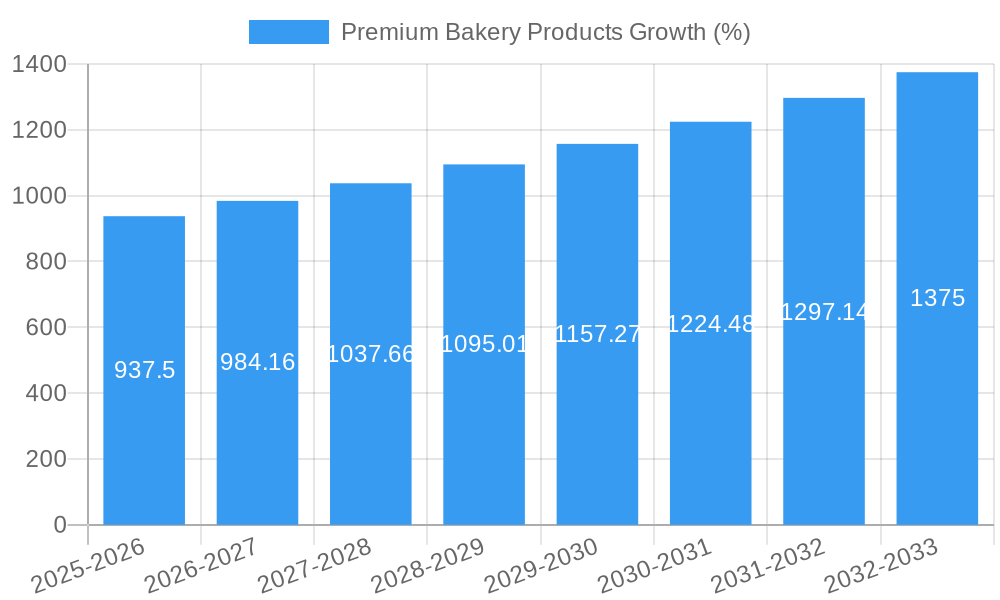
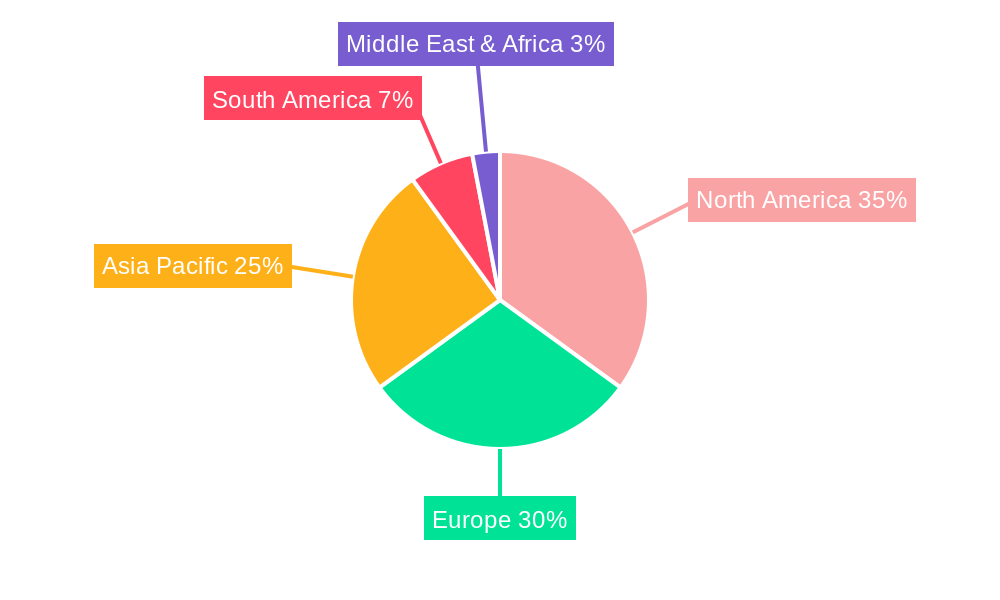
The premium bakery products market, encompassing breads, cookies, biscuits, morning goods, cakes, and pastries, is experiencing robust growth, projected at a compound annual growth rate (CAGR) of 6.25% from 2025 to 2033. This expansion is fueled by several key drivers. Rising disposable incomes, particularly in developing economies within Asia-Pacific and South America, are enabling consumers to indulge in higher-priced, premium bakery items. Simultaneously, evolving consumer preferences towards healthier, artisan, and organic options are driving demand for premium ingredients and specialized production methods. The growth of online retail channels offers convenient access to a wider selection of premium products, further boosting market expansion. However, the market faces certain constraints, including fluctuations in raw material costs (e.g., flour, sugar, butter) and increased competition from both established players and smaller, artisanal bakeries. The market segmentation reveals a strong presence across various distribution channels, with supermarkets/hypermarkets holding a significant share, followed by specialty stores and the rapidly growing online retail sector. Leading companies like Barilla, General Mills, and Mondelez International are leveraging branding, innovation, and strategic partnerships to maintain their market positions. Regional variations exist, with North America and Europe currently holding substantial market shares, while Asia-Pacific is poised for significant growth due to increasing urbanization and changing dietary habits.
The future of the premium bakery market is bright, especially considering the ongoing expansion of health-conscious consumer segments seeking premium, nutritious baked goods. Companies are increasingly focusing on clean-label initiatives, incorporating natural ingredients and reducing artificial additives to cater to these demands. Furthermore, the rise of gourmet and artisanal bakeries is influencing consumer preferences, driving demand for unique flavors and high-quality ingredients. Strategic collaborations between established brands and smaller artisanal businesses are likely to become more prevalent, offering consumers a broader range of choices while benefiting both parties. This continuous innovation and adaptation to evolving consumer preferences will solidify the premium bakery product market's trajectory towards continued, substantial growth throughout the forecast period.
Premium Bakery Products Market Report: 2019-2033
This comprehensive report provides a detailed analysis of the global premium bakery products market, offering invaluable insights for businesses and investors seeking to capitalize on growth opportunities within this dynamic sector. The report covers the period 2019-2033, with a focus on the forecast period 2025-2033 and a base year of 2025. The market is segmented by product type (breads, cookies and biscuits, morning goods, cakes and pastries, others) and distribution channel (supermarkets/hypermarkets, specialty stores, online retail stores, other distribution channels). Key players such as BARILLA G E R FRATELLI SPA, General Mills Inc, Finsbury Food Group Plc, ALMARAI COMPANY, FUJI BAKING CO LTD, Associated British Foods plc, Mondelez International Inc, Bimbo Bakeries USA, Bakers Delight Holdings Limited, and Britannia Industries Ltd are analyzed, providing a complete view of the competitive landscape. This report projects a market value exceeding $XX Million by 2033.
Premium Bakery Products Market Structure & Competitive Landscape
The premium bakery products market exhibits a moderately consolidated structure, with a few major players holding significant market share. Concentration ratios, while not explicitly stated in the provided information, are estimated to be moderately high, reflecting the dominance of established multinational corporations. Innovation is a key driver, with companies constantly introducing new product varieties, flavors, and healthier options to cater to evolving consumer preferences. Regulatory impacts, such as food safety regulations and labeling requirements, vary across different regions and influence production and distribution strategies. Product substitutes, including alternative snack foods and home-baking options, present a level of competitive pressure. End-user segmentation primarily focuses on demographics and lifestyle trends, with premium bakery products targeting consumers with higher disposable incomes and a preference for high-quality ingredients.
Mergers and acquisitions (M&A) activity is a significant aspect of the market's competitive landscape. Recent examples include Mondelez International's acquisition of Chipita S.A. in 2021, signifying the consolidation trend within the premium bakery sector. This activity aims to expand product portfolios, enhance distribution networks, and improve market penetration. The overall M&A volume during the historical period (2019-2024) is estimated at $XX Million, suggesting a robust level of consolidation.
- High Concentration Ratios: Estimated at a moderately high level.
- Key Innovation Drivers: New product varieties, healthier options, premium ingredients.
- Significant Regulatory Impacts: Food safety regulations, labeling requirements vary by region.
- Major Product Substitutes: Alternative snack foods, home baking.
- Dominant End-User Segmentation: Higher-income consumers, health-conscious individuals.
- M&A Activity: Significant, with transactions totaling approximately $XX Million (2019-2024).
Premium Bakery Products Market Trends & Opportunities
The premium bakery products market has witnessed significant growth during the historical period (2019-2024), with a Compound Annual Growth Rate (CAGR) of approximately XX%. This growth is driven by several factors, including rising disposable incomes in several key markets, growing demand for convenience foods, and increasing popularity of premium and artisanal bakery products. Technological advancements, such as automated baking systems and improved packaging technologies, have enhanced efficiency and product quality. Consumer preferences are shifting towards healthier options, such as whole-grain breads and reduced-sugar pastries, creating opportunities for innovative product development. Competitive dynamics are intense, with established players facing challenges from both new entrants and private label brands. Market penetration rates vary across different product categories and regions, with higher penetration in developed markets compared to emerging economies. The increasing prevalence of online retail channels is also changing distribution dynamics. Continued growth is projected in the forecast period (2025-2033) driven by the factors mentioned above. The market is expected to reach $XX Million by 2033, with a projected CAGR of XX%.
Dominant Markets & Segments in Premium Bakery Products
The global premium bakery products market is geographically diverse, with significant presence in North America, Europe, and Asia-Pacific. Within these regions, specific countries emerge as dominant markets due to factors like strong consumer spending power, established distribution networks, and favorable regulatory environments. Similarly, certain product types and distribution channels demonstrate higher growth potential and market dominance.
- Dominant Regions: North America, Europe, Asia-Pacific.
- Leading Countries: (Data unavailable, therefore not specified. Further market research is required)
- Fastest-Growing Product Segments: Cookies and biscuits, cakes and pastries (based on predicted consumer trends).
- High-Growth Distribution Channels: Supermarkets/Hypermarkets, Online Retail Stores.
Growth Drivers by Segment:
- Supermarkets/Hypermarkets: Extensive reach, established infrastructure, consumer familiarity.
- Online Retail Stores: Convenience, expanding reach to broader demographics, targeted marketing opportunities.
- Specialty Stores: Premium positioning, focus on niche customer segments, superior product quality
Premium Bakery Products Product Analysis
Premium bakery products encompass a diverse range of offerings, focusing on high-quality ingredients, unique flavors, and innovative product formats. Technological advancements, such as improved dough mixing techniques and precision baking controls, enhance both taste and consistency. The emphasis is on providing value-added products that cater to specific consumer demands and preferences. This includes healthy options, artisanal varieties, and products with unique flavors and textures. Success hinges on achieving a strong market fit through effective marketing and distribution strategies.
Key Drivers, Barriers & Challenges in Premium Bakery Products
Key Drivers:
Rising disposable incomes, increasing demand for convenience foods, technological advancements in baking and packaging, evolving consumer preferences towards premium and healthier options, and expansion of e-commerce platforms are key drivers.
Challenges:
Fluctuating raw material costs, stringent food safety regulations, intense competition, and supply chain disruptions present considerable challenges. The impact of these challenges varies depending on market conditions and individual company strategies. For example, increased raw material costs might reduce profit margins, while supply chain issues could impact production volumes and delivery timelines. These challenges can lead to reduced market growth, estimated to cause a drop in projected CAGR by XX% under specific circumstances.
Growth Drivers in the Premium Bakery Products Market
Growth in the premium bakery products market is propelled by increasing disposable incomes, particularly in developing economies, fueling demand for premium products. Technological advancements enhance production efficiency and product quality, while changing consumer preferences toward healthier and more convenient options continue to shape product innovation. Furthermore, evolving regulatory frameworks influence product formulations and labeling.
Challenges Impacting Premium Bakery Products Growth
The premium bakery products market faces challenges including fluctuating raw material prices affecting profitability, stringent food safety regulations impacting production processes, and intense competition among established brands and new entrants. Supply chain disruptions create uncertainty and increase production costs. These factors can lead to a decrease in projected growth rate.
Key Players Shaping the Premium Bakery Products Market
- BARILLA G E R FRATELLI SPA
- General Mills Inc
- Finsbury Food Group Plc
- ALMARAI COMPANY
- FUJI BAKING CO LTD
- Associated British Foods plc
- Mondelez International Inc
- Bimbo Bakeries USA
- Bakers Delight Holdings Limited
- Britannia Industries Ltd
Significant Premium Bakery Products Industry Milestones
- April 2022: Walker's Shortbread partners with Dufry to launch a new Global Travel Retailer range.
- April 2022: Burton's Biscuit Company merges with Fox's Biscuits.
- May 2021: Mondelez International acquires Chipita S.A. for approximately USD 2 Billion.
Future Outlook for Premium Bakery Products Market
The premium bakery products market is poised for continued growth, driven by increasing demand for convenience, health-conscious options, and premium experiences. Strategic opportunities exist in product innovation, targeted marketing, and expanding into new markets. The market's potential is considerable, with scope for further expansion across various product segments and distribution channels.
Premium Bakery Products Segmentation
-
1. Product Type
- 1.1. Breads
- 1.2. Cookies and Biscuits
- 1.3. Morning Goods
- 1.4. Cakes and Pastries
- 1.5. others
-
2. Distibution Channel
- 2.1. Supermarkets/Hypermarkets
- 2.2. Speciality stores
- 2.3. Online Retail Stores
- 2.4. Other Distribution Channels
Premium Bakery Products Segmentation By Geography
-
1. North America
- 1.1. United States
- 1.2. Canada
- 1.3. Mexico
- 1.4. Rest of North America
-
2. Europe
- 2.1. United Kingdom
- 2.2. Germany
- 2.3. Spain
- 2.4. France
- 2.5. Italy
- 2.6. Russia
- 2.7. Rest of Europe
-
3. Asia Pacific
- 3.1. China
- 3.2. Japan
- 3.3. India
- 3.4. Australia
- 3.5. Rest of Asia Pacific
-
4. South America
- 4.1. Brazil
- 4.2. Argentina
- 4.3. Rest of South America
- 5. Middle East
-
6. Saudi Arabia
- 6.1. South Africa
- 6.2. Rest of Middle East
Premium Bakery Products REPORT HIGHLIGHTS
| Aspects | Details |
|---|---|
| Study Period | 2019-2033 |
| Base Year | 2024 |
| Estimated Year | 2025 |
| Forecast Period | 2025-2033 |
| Historical Period | 2019-2024 |
| Growth Rate | CAGR of 6.25% from 2019-2033 |
| Segmentation |
|
Table of Contents
- 1. Introduction
- 1.1. Research Scope
- 1.2. Market Segmentation
- 1.3. Research Methodology
- 1.4. Definitions and Assumptions
- 2. Executive Summary
- 2.1. Introduction
- 3. Market Dynamics
- 3.1. Introduction
- 3.2. Market Drivers
- 3.2.1. Innovation in Vanillin Synthesis; Diverse Functionality of Vanillin In End-use Industries
- 3.3. Market Restrains
- 3.3.1. Supply Chain Variability Impacting Vanilla Bean Availability For Flavor Production
- 3.4. Market Trends
- 3.4.1. Rising demand for premium healthy snacking options is driving the market
- 4. Market Factor Analysis
- 4.1. Porters Five Forces
- 4.2. Supply/Value Chain
- 4.3. PESTEL analysis
- 4.4. Market Entropy
- 4.5. Patent/Trademark Analysis
- 5. Global Premium Bakery Products Analysis, Insights and Forecast, 2019-2031
- 5.1. Market Analysis, Insights and Forecast - by Product Type
- 5.1.1. Breads
- 5.1.2. Cookies and Biscuits
- 5.1.3. Morning Goods
- 5.1.4. Cakes and Pastries
- 5.1.5. others
- 5.2. Market Analysis, Insights and Forecast - by Distibution Channel
- 5.2.1. Supermarkets/Hypermarkets
- 5.2.2. Speciality stores
- 5.2.3. Online Retail Stores
- 5.2.4. Other Distribution Channels
- 5.3. Market Analysis, Insights and Forecast - by Region
- 5.3.1. North America
- 5.3.2. Europe
- 5.3.3. Asia Pacific
- 5.3.4. South America
- 5.3.5. Middle East
- 5.3.6. Saudi Arabia
- 5.1. Market Analysis, Insights and Forecast - by Product Type
- 6. North America Premium Bakery Products Analysis, Insights and Forecast, 2019-2031
- 6.1. Market Analysis, Insights and Forecast - by Product Type
- 6.1.1. Breads
- 6.1.2. Cookies and Biscuits
- 6.1.3. Morning Goods
- 6.1.4. Cakes and Pastries
- 6.1.5. others
- 6.2. Market Analysis, Insights and Forecast - by Distibution Channel
- 6.2.1. Supermarkets/Hypermarkets
- 6.2.2. Speciality stores
- 6.2.3. Online Retail Stores
- 6.2.4. Other Distribution Channels
- 6.1. Market Analysis, Insights and Forecast - by Product Type
- 7. Europe Premium Bakery Products Analysis, Insights and Forecast, 2019-2031
- 7.1. Market Analysis, Insights and Forecast - by Product Type
- 7.1.1. Breads
- 7.1.2. Cookies and Biscuits
- 7.1.3. Morning Goods
- 7.1.4. Cakes and Pastries
- 7.1.5. others
- 7.2. Market Analysis, Insights and Forecast - by Distibution Channel
- 7.2.1. Supermarkets/Hypermarkets
- 7.2.2. Speciality stores
- 7.2.3. Online Retail Stores
- 7.2.4. Other Distribution Channels
- 7.1. Market Analysis, Insights and Forecast - by Product Type
- 8. Asia Pacific Premium Bakery Products Analysis, Insights and Forecast, 2019-2031
- 8.1. Market Analysis, Insights and Forecast - by Product Type
- 8.1.1. Breads
- 8.1.2. Cookies and Biscuits
- 8.1.3. Morning Goods
- 8.1.4. Cakes and Pastries
- 8.1.5. others
- 8.2. Market Analysis, Insights and Forecast - by Distibution Channel
- 8.2.1. Supermarkets/Hypermarkets
- 8.2.2. Speciality stores
- 8.2.3. Online Retail Stores
- 8.2.4. Other Distribution Channels
- 8.1. Market Analysis, Insights and Forecast - by Product Type
- 9. South America Premium Bakery Products Analysis, Insights and Forecast, 2019-2031
- 9.1. Market Analysis, Insights and Forecast - by Product Type
- 9.1.1. Breads
- 9.1.2. Cookies and Biscuits
- 9.1.3. Morning Goods
- 9.1.4. Cakes and Pastries
- 9.1.5. others
- 9.2. Market Analysis, Insights and Forecast - by Distibution Channel
- 9.2.1. Supermarkets/Hypermarkets
- 9.2.2. Speciality stores
- 9.2.3. Online Retail Stores
- 9.2.4. Other Distribution Channels
- 9.1. Market Analysis, Insights and Forecast - by Product Type
- 10. Middle East Premium Bakery Products Analysis, Insights and Forecast, 2019-2031
- 10.1. Market Analysis, Insights and Forecast - by Product Type
- 10.1.1. Breads
- 10.1.2. Cookies and Biscuits
- 10.1.3. Morning Goods
- 10.1.4. Cakes and Pastries
- 10.1.5. others
- 10.2. Market Analysis, Insights and Forecast - by Distibution Channel
- 10.2.1. Supermarkets/Hypermarkets
- 10.2.2. Speciality stores
- 10.2.3. Online Retail Stores
- 10.2.4. Other Distribution Channels
- 10.1. Market Analysis, Insights and Forecast - by Product Type
- 11. Saudi Arabia Premium Bakery Products Analysis, Insights and Forecast, 2019-2031
- 11.1. Market Analysis, Insights and Forecast - by Product Type
- 11.1.1. Breads
- 11.1.2. Cookies and Biscuits
- 11.1.3. Morning Goods
- 11.1.4. Cakes and Pastries
- 11.1.5. others
- 11.2. Market Analysis, Insights and Forecast - by Distibution Channel
- 11.2.1. Supermarkets/Hypermarkets
- 11.2.2. Speciality stores
- 11.2.3. Online Retail Stores
- 11.2.4. Other Distribution Channels
- 11.1. Market Analysis, Insights and Forecast - by Product Type
- 12. North America Premium Bakery Products Analysis, Insights and Forecast, 2019-2031
- 12.1. Market Analysis, Insights and Forecast - By Country/Sub-region
- 12.1.1 United States
- 12.1.2 Canada
- 12.1.3 Mexico
- 12.1.4 Rest of North America
- 13. Europe Premium Bakery Products Analysis, Insights and Forecast, 2019-2031
- 13.1. Market Analysis, Insights and Forecast - By Country/Sub-region
- 13.1.1 United Kingdom
- 13.1.2 Germany
- 13.1.3 Spain
- 13.1.4 France
- 13.1.5 Italy
- 13.1.6 Russia
- 13.1.7 Rest of Europe
- 14. Asia Pacific Premium Bakery Products Analysis, Insights and Forecast, 2019-2031
- 14.1. Market Analysis, Insights and Forecast - By Country/Sub-region
- 14.1.1 China
- 14.1.2 Japan
- 14.1.3 India
- 14.1.4 Australia
- 14.1.5 Rest of Asia Pacific
- 15. South America Premium Bakery Products Analysis, Insights and Forecast, 2019-2031
- 15.1. Market Analysis, Insights and Forecast - By Country/Sub-region
- 15.1.1 Brazil
- 15.1.2 Argentina
- 15.1.3 Rest of South America
- 16. Middle East & Africa Premium Bakery Products Analysis, Insights and Forecast, 2019-2031
- 16.1. Market Analysis, Insights and Forecast - By Country/Sub-region
- 16.1.1 UAE
- 16.1.2 South Africa
- 16.1.3 Saudi Arabia
- 16.1.4 Rest of MEA
- 17. Competitive Analysis
- 17.1. Global Market Share Analysis 2024
- 17.2. Company Profiles
- 17.2.1 BARILLA G E R FRATELLI SPA
- 17.2.1.1. Overview
- 17.2.1.2. Products
- 17.2.1.3. SWOT Analysis
- 17.2.1.4. Recent Developments
- 17.2.1.5. Financials (Based on Availability)
- 17.2.2 General Mills Inc
- 17.2.2.1. Overview
- 17.2.2.2. Products
- 17.2.2.3. SWOT Analysis
- 17.2.2.4. Recent Developments
- 17.2.2.5. Financials (Based on Availability)
- 17.2.3 Finsbury Food Group Plc
- 17.2.3.1. Overview
- 17.2.3.2. Products
- 17.2.3.3. SWOT Analysis
- 17.2.3.4. Recent Developments
- 17.2.3.5. Financials (Based on Availability)
- 17.2.4 ALMARAI COMPANY
- 17.2.4.1. Overview
- 17.2.4.2. Products
- 17.2.4.3. SWOT Analysis
- 17.2.4.4. Recent Developments
- 17.2.4.5. Financials (Based on Availability)
- 17.2.5 FUJI BAKING CO LTD
- 17.2.5.1. Overview
- 17.2.5.2. Products
- 17.2.5.3. SWOT Analysis
- 17.2.5.4. Recent Developments
- 17.2.5.5. Financials (Based on Availability)
- 17.2.6 Associated British Foods plc
- 17.2.6.1. Overview
- 17.2.6.2. Products
- 17.2.6.3. SWOT Analysis
- 17.2.6.4. Recent Developments
- 17.2.6.5. Financials (Based on Availability)
- 17.2.7 Mondelez International Inc
- 17.2.7.1. Overview
- 17.2.7.2. Products
- 17.2.7.3. SWOT Analysis
- 17.2.7.4. Recent Developments
- 17.2.7.5. Financials (Based on Availability)
- 17.2.8 Bimbo Bakeries USA
- 17.2.8.1. Overview
- 17.2.8.2. Products
- 17.2.8.3. SWOT Analysis
- 17.2.8.4. Recent Developments
- 17.2.8.5. Financials (Based on Availability)
- 17.2.9 Bakers Delight Holdings Limited
- 17.2.9.1. Overview
- 17.2.9.2. Products
- 17.2.9.3. SWOT Analysis
- 17.2.9.4. Recent Developments
- 17.2.9.5. Financials (Based on Availability)
- 17.2.10 Britannia Industries Ltd*List Not Exhaustive
- 17.2.10.1. Overview
- 17.2.10.2. Products
- 17.2.10.3. SWOT Analysis
- 17.2.10.4. Recent Developments
- 17.2.10.5. Financials (Based on Availability)
- 17.2.1 BARILLA G E R FRATELLI SPA
List of Figures
- Figure 1: Global Premium Bakery Products Revenue Breakdown (Million, %) by Region 2024 & 2032
- Figure 2: Global Premium Bakery Products Volume Breakdown (K Tons, %) by Region 2024 & 2032
- Figure 3: North America Premium Bakery Products Revenue (Million), by Country 2024 & 2032
- Figure 4: North America Premium Bakery Products Volume (K Tons), by Country 2024 & 2032
- Figure 5: North America Premium Bakery Products Revenue Share (%), by Country 2024 & 2032
- Figure 6: North America Premium Bakery Products Volume Share (%), by Country 2024 & 2032
- Figure 7: Europe Premium Bakery Products Revenue (Million), by Country 2024 & 2032
- Figure 8: Europe Premium Bakery Products Volume (K Tons), by Country 2024 & 2032
- Figure 9: Europe Premium Bakery Products Revenue Share (%), by Country 2024 & 2032
- Figure 10: Europe Premium Bakery Products Volume Share (%), by Country 2024 & 2032
- Figure 11: Asia Pacific Premium Bakery Products Revenue (Million), by Country 2024 & 2032
- Figure 12: Asia Pacific Premium Bakery Products Volume (K Tons), by Country 2024 & 2032
- Figure 13: Asia Pacific Premium Bakery Products Revenue Share (%), by Country 2024 & 2032
- Figure 14: Asia Pacific Premium Bakery Products Volume Share (%), by Country 2024 & 2032
- Figure 15: South America Premium Bakery Products Revenue (Million), by Country 2024 & 2032
- Figure 16: South America Premium Bakery Products Volume (K Tons), by Country 2024 & 2032
- Figure 17: South America Premium Bakery Products Revenue Share (%), by Country 2024 & 2032
- Figure 18: South America Premium Bakery Products Volume Share (%), by Country 2024 & 2032
- Figure 19: Middle East & Africa Premium Bakery Products Revenue (Million), by Country 2024 & 2032
- Figure 20: Middle East & Africa Premium Bakery Products Volume (K Tons), by Country 2024 & 2032
- Figure 21: Middle East & Africa Premium Bakery Products Revenue Share (%), by Country 2024 & 2032
- Figure 22: Middle East & Africa Premium Bakery Products Volume Share (%), by Country 2024 & 2032
- Figure 23: North America Premium Bakery Products Revenue (Million), by Product Type 2024 & 2032
- Figure 24: North America Premium Bakery Products Volume (K Tons), by Product Type 2024 & 2032
- Figure 25: North America Premium Bakery Products Revenue Share (%), by Product Type 2024 & 2032
- Figure 26: North America Premium Bakery Products Volume Share (%), by Product Type 2024 & 2032
- Figure 27: North America Premium Bakery Products Revenue (Million), by Distibution Channel 2024 & 2032
- Figure 28: North America Premium Bakery Products Volume (K Tons), by Distibution Channel 2024 & 2032
- Figure 29: North America Premium Bakery Products Revenue Share (%), by Distibution Channel 2024 & 2032
- Figure 30: North America Premium Bakery Products Volume Share (%), by Distibution Channel 2024 & 2032
- Figure 31: North America Premium Bakery Products Revenue (Million), by Country 2024 & 2032
- Figure 32: North America Premium Bakery Products Volume (K Tons), by Country 2024 & 2032
- Figure 33: North America Premium Bakery Products Revenue Share (%), by Country 2024 & 2032
- Figure 34: North America Premium Bakery Products Volume Share (%), by Country 2024 & 2032
- Figure 35: Europe Premium Bakery Products Revenue (Million), by Product Type 2024 & 2032
- Figure 36: Europe Premium Bakery Products Volume (K Tons), by Product Type 2024 & 2032
- Figure 37: Europe Premium Bakery Products Revenue Share (%), by Product Type 2024 & 2032
- Figure 38: Europe Premium Bakery Products Volume Share (%), by Product Type 2024 & 2032
- Figure 39: Europe Premium Bakery Products Revenue (Million), by Distibution Channel 2024 & 2032
- Figure 40: Europe Premium Bakery Products Volume (K Tons), by Distibution Channel 2024 & 2032
- Figure 41: Europe Premium Bakery Products Revenue Share (%), by Distibution Channel 2024 & 2032
- Figure 42: Europe Premium Bakery Products Volume Share (%), by Distibution Channel 2024 & 2032
- Figure 43: Europe Premium Bakery Products Revenue (Million), by Country 2024 & 2032
- Figure 44: Europe Premium Bakery Products Volume (K Tons), by Country 2024 & 2032
- Figure 45: Europe Premium Bakery Products Revenue Share (%), by Country 2024 & 2032
- Figure 46: Europe Premium Bakery Products Volume Share (%), by Country 2024 & 2032
- Figure 47: Asia Pacific Premium Bakery Products Revenue (Million), by Product Type 2024 & 2032
- Figure 48: Asia Pacific Premium Bakery Products Volume (K Tons), by Product Type 2024 & 2032
- Figure 49: Asia Pacific Premium Bakery Products Revenue Share (%), by Product Type 2024 & 2032
- Figure 50: Asia Pacific Premium Bakery Products Volume Share (%), by Product Type 2024 & 2032
- Figure 51: Asia Pacific Premium Bakery Products Revenue (Million), by Distibution Channel 2024 & 2032
- Figure 52: Asia Pacific Premium Bakery Products Volume (K Tons), by Distibution Channel 2024 & 2032
- Figure 53: Asia Pacific Premium Bakery Products Revenue Share (%), by Distibution Channel 2024 & 2032
- Figure 54: Asia Pacific Premium Bakery Products Volume Share (%), by Distibution Channel 2024 & 2032
- Figure 55: Asia Pacific Premium Bakery Products Revenue (Million), by Country 2024 & 2032
- Figure 56: Asia Pacific Premium Bakery Products Volume (K Tons), by Country 2024 & 2032
- Figure 57: Asia Pacific Premium Bakery Products Revenue Share (%), by Country 2024 & 2032
- Figure 58: Asia Pacific Premium Bakery Products Volume Share (%), by Country 2024 & 2032
- Figure 59: South America Premium Bakery Products Revenue (Million), by Product Type 2024 & 2032
- Figure 60: South America Premium Bakery Products Volume (K Tons), by Product Type 2024 & 2032
- Figure 61: South America Premium Bakery Products Revenue Share (%), by Product Type 2024 & 2032
- Figure 62: South America Premium Bakery Products Volume Share (%), by Product Type 2024 & 2032
- Figure 63: South America Premium Bakery Products Revenue (Million), by Distibution Channel 2024 & 2032
- Figure 64: South America Premium Bakery Products Volume (K Tons), by Distibution Channel 2024 & 2032
- Figure 65: South America Premium Bakery Products Revenue Share (%), by Distibution Channel 2024 & 2032
- Figure 66: South America Premium Bakery Products Volume Share (%), by Distibution Channel 2024 & 2032
- Figure 67: South America Premium Bakery Products Revenue (Million), by Country 2024 & 2032
- Figure 68: South America Premium Bakery Products Volume (K Tons), by Country 2024 & 2032
- Figure 69: South America Premium Bakery Products Revenue Share (%), by Country 2024 & 2032
- Figure 70: South America Premium Bakery Products Volume Share (%), by Country 2024 & 2032
- Figure 71: Middle East Premium Bakery Products Revenue (Million), by Product Type 2024 & 2032
- Figure 72: Middle East Premium Bakery Products Volume (K Tons), by Product Type 2024 & 2032
- Figure 73: Middle East Premium Bakery Products Revenue Share (%), by Product Type 2024 & 2032
- Figure 74: Middle East Premium Bakery Products Volume Share (%), by Product Type 2024 & 2032
- Figure 75: Middle East Premium Bakery Products Revenue (Million), by Distibution Channel 2024 & 2032
- Figure 76: Middle East Premium Bakery Products Volume (K Tons), by Distibution Channel 2024 & 2032
- Figure 77: Middle East Premium Bakery Products Revenue Share (%), by Distibution Channel 2024 & 2032
- Figure 78: Middle East Premium Bakery Products Volume Share (%), by Distibution Channel 2024 & 2032
- Figure 79: Middle East Premium Bakery Products Revenue (Million), by Country 2024 & 2032
- Figure 80: Middle East Premium Bakery Products Volume (K Tons), by Country 2024 & 2032
- Figure 81: Middle East Premium Bakery Products Revenue Share (%), by Country 2024 & 2032
- Figure 82: Middle East Premium Bakery Products Volume Share (%), by Country 2024 & 2032
- Figure 83: Saudi Arabia Premium Bakery Products Revenue (Million), by Product Type 2024 & 2032
- Figure 84: Saudi Arabia Premium Bakery Products Volume (K Tons), by Product Type 2024 & 2032
- Figure 85: Saudi Arabia Premium Bakery Products Revenue Share (%), by Product Type 2024 & 2032
- Figure 86: Saudi Arabia Premium Bakery Products Volume Share (%), by Product Type 2024 & 2032
- Figure 87: Saudi Arabia Premium Bakery Products Revenue (Million), by Distibution Channel 2024 & 2032
- Figure 88: Saudi Arabia Premium Bakery Products Volume (K Tons), by Distibution Channel 2024 & 2032
- Figure 89: Saudi Arabia Premium Bakery Products Revenue Share (%), by Distibution Channel 2024 & 2032
- Figure 90: Saudi Arabia Premium Bakery Products Volume Share (%), by Distibution Channel 2024 & 2032
- Figure 91: Saudi Arabia Premium Bakery Products Revenue (Million), by Country 2024 & 2032
- Figure 92: Saudi Arabia Premium Bakery Products Volume (K Tons), by Country 2024 & 2032
- Figure 93: Saudi Arabia Premium Bakery Products Revenue Share (%), by Country 2024 & 2032
- Figure 94: Saudi Arabia Premium Bakery Products Volume Share (%), by Country 2024 & 2032
List of Tables
- Table 1: Global Premium Bakery Products Revenue Million Forecast, by Region 2019 & 2032
- Table 2: Global Premium Bakery Products Volume K Tons Forecast, by Region 2019 & 2032
- Table 3: Global Premium Bakery Products Revenue Million Forecast, by Product Type 2019 & 2032
- Table 4: Global Premium Bakery Products Volume K Tons Forecast, by Product Type 2019 & 2032
- Table 5: Global Premium Bakery Products Revenue Million Forecast, by Distibution Channel 2019 & 2032
- Table 6: Global Premium Bakery Products Volume K Tons Forecast, by Distibution Channel 2019 & 2032
- Table 7: Global Premium Bakery Products Revenue Million Forecast, by Region 2019 & 2032
- Table 8: Global Premium Bakery Products Volume K Tons Forecast, by Region 2019 & 2032
- Table 9: Global Premium Bakery Products Revenue Million Forecast, by Country 2019 & 2032
- Table 10: Global Premium Bakery Products Volume K Tons Forecast, by Country 2019 & 2032
- Table 11: United States Premium Bakery Products Revenue (Million) Forecast, by Application 2019 & 2032
- Table 12: United States Premium Bakery Products Volume (K Tons) Forecast, by Application 2019 & 2032
- Table 13: Canada Premium Bakery Products Revenue (Million) Forecast, by Application 2019 & 2032
- Table 14: Canada Premium Bakery Products Volume (K Tons) Forecast, by Application 2019 & 2032
- Table 15: Mexico Premium Bakery Products Revenue (Million) Forecast, by Application 2019 & 2032
- Table 16: Mexico Premium Bakery Products Volume (K Tons) Forecast, by Application 2019 & 2032
- Table 17: Rest of North America Premium Bakery Products Revenue (Million) Forecast, by Application 2019 & 2032
- Table 18: Rest of North America Premium Bakery Products Volume (K Tons) Forecast, by Application 2019 & 2032
- Table 19: Global Premium Bakery Products Revenue Million Forecast, by Country 2019 & 2032
- Table 20: Global Premium Bakery Products Volume K Tons Forecast, by Country 2019 & 2032
- Table 21: United Kingdom Premium Bakery Products Revenue (Million) Forecast, by Application 2019 & 2032
- Table 22: United Kingdom Premium Bakery Products Volume (K Tons) Forecast, by Application 2019 & 2032
- Table 23: Germany Premium Bakery Products Revenue (Million) Forecast, by Application 2019 & 2032
- Table 24: Germany Premium Bakery Products Volume (K Tons) Forecast, by Application 2019 & 2032
- Table 25: Spain Premium Bakery Products Revenue (Million) Forecast, by Application 2019 & 2032
- Table 26: Spain Premium Bakery Products Volume (K Tons) Forecast, by Application 2019 & 2032
- Table 27: France Premium Bakery Products Revenue (Million) Forecast, by Application 2019 & 2032
- Table 28: France Premium Bakery Products Volume (K Tons) Forecast, by Application 2019 & 2032
- Table 29: Italy Premium Bakery Products Revenue (Million) Forecast, by Application 2019 & 2032
- Table 30: Italy Premium Bakery Products Volume (K Tons) Forecast, by Application 2019 & 2032
- Table 31: Russia Premium Bakery Products Revenue (Million) Forecast, by Application 2019 & 2032
- Table 32: Russia Premium Bakery Products Volume (K Tons) Forecast, by Application 2019 & 2032
- Table 33: Rest of Europe Premium Bakery Products Revenue (Million) Forecast, by Application 2019 & 2032
- Table 34: Rest of Europe Premium Bakery Products Volume (K Tons) Forecast, by Application 2019 & 2032
- Table 35: Global Premium Bakery Products Revenue Million Forecast, by Country 2019 & 2032
- Table 36: Global Premium Bakery Products Volume K Tons Forecast, by Country 2019 & 2032
- Table 37: China Premium Bakery Products Revenue (Million) Forecast, by Application 2019 & 2032
- Table 38: China Premium Bakery Products Volume (K Tons) Forecast, by Application 2019 & 2032
- Table 39: Japan Premium Bakery Products Revenue (Million) Forecast, by Application 2019 & 2032
- Table 40: Japan Premium Bakery Products Volume (K Tons) Forecast, by Application 2019 & 2032
- Table 41: India Premium Bakery Products Revenue (Million) Forecast, by Application 2019 & 2032
- Table 42: India Premium Bakery Products Volume (K Tons) Forecast, by Application 2019 & 2032
- Table 43: Australia Premium Bakery Products Revenue (Million) Forecast, by Application 2019 & 2032
- Table 44: Australia Premium Bakery Products Volume (K Tons) Forecast, by Application 2019 & 2032
- Table 45: Rest of Asia Pacific Premium Bakery Products Revenue (Million) Forecast, by Application 2019 & 2032
- Table 46: Rest of Asia Pacific Premium Bakery Products Volume (K Tons) Forecast, by Application 2019 & 2032
- Table 47: Global Premium Bakery Products Revenue Million Forecast, by Country 2019 & 2032
- Table 48: Global Premium Bakery Products Volume K Tons Forecast, by Country 2019 & 2032
- Table 49: Brazil Premium Bakery Products Revenue (Million) Forecast, by Application 2019 & 2032
- Table 50: Brazil Premium Bakery Products Volume (K Tons) Forecast, by Application 2019 & 2032
- Table 51: Argentina Premium Bakery Products Revenue (Million) Forecast, by Application 2019 & 2032
- Table 52: Argentina Premium Bakery Products Volume (K Tons) Forecast, by Application 2019 & 2032
- Table 53: Rest of South America Premium Bakery Products Revenue (Million) Forecast, by Application 2019 & 2032
- Table 54: Rest of South America Premium Bakery Products Volume (K Tons) Forecast, by Application 2019 & 2032
- Table 55: Global Premium Bakery Products Revenue Million Forecast, by Country 2019 & 2032
- Table 56: Global Premium Bakery Products Volume K Tons Forecast, by Country 2019 & 2032
- Table 57: UAE Premium Bakery Products Revenue (Million) Forecast, by Application 2019 & 2032
- Table 58: UAE Premium Bakery Products Volume (K Tons) Forecast, by Application 2019 & 2032
- Table 59: South Africa Premium Bakery Products Revenue (Million) Forecast, by Application 2019 & 2032
- Table 60: South Africa Premium Bakery Products Volume (K Tons) Forecast, by Application 2019 & 2032
- Table 61: Saudi Arabia Premium Bakery Products Revenue (Million) Forecast, by Application 2019 & 2032
- Table 62: Saudi Arabia Premium Bakery Products Volume (K Tons) Forecast, by Application 2019 & 2032
- Table 63: Rest of MEA Premium Bakery Products Revenue (Million) Forecast, by Application 2019 & 2032
- Table 64: Rest of MEA Premium Bakery Products Volume (K Tons) Forecast, by Application 2019 & 2032
- Table 65: Global Premium Bakery Products Revenue Million Forecast, by Product Type 2019 & 2032
- Table 66: Global Premium Bakery Products Volume K Tons Forecast, by Product Type 2019 & 2032
- Table 67: Global Premium Bakery Products Revenue Million Forecast, by Distibution Channel 2019 & 2032
- Table 68: Global Premium Bakery Products Volume K Tons Forecast, by Distibution Channel 2019 & 2032
- Table 69: Global Premium Bakery Products Revenue Million Forecast, by Country 2019 & 2032
- Table 70: Global Premium Bakery Products Volume K Tons Forecast, by Country 2019 & 2032
- Table 71: United States Premium Bakery Products Revenue (Million) Forecast, by Application 2019 & 2032
- Table 72: United States Premium Bakery Products Volume (K Tons) Forecast, by Application 2019 & 2032
- Table 73: Canada Premium Bakery Products Revenue (Million) Forecast, by Application 2019 & 2032
- Table 74: Canada Premium Bakery Products Volume (K Tons) Forecast, by Application 2019 & 2032
- Table 75: Mexico Premium Bakery Products Revenue (Million) Forecast, by Application 2019 & 2032
- Table 76: Mexico Premium Bakery Products Volume (K Tons) Forecast, by Application 2019 & 2032
- Table 77: Rest of North America Premium Bakery Products Revenue (Million) Forecast, by Application 2019 & 2032
- Table 78: Rest of North America Premium Bakery Products Volume (K Tons) Forecast, by Application 2019 & 2032
- Table 79: Global Premium Bakery Products Revenue Million Forecast, by Product Type 2019 & 2032
- Table 80: Global Premium Bakery Products Volume K Tons Forecast, by Product Type 2019 & 2032
- Table 81: Global Premium Bakery Products Revenue Million Forecast, by Distibution Channel 2019 & 2032
- Table 82: Global Premium Bakery Products Volume K Tons Forecast, by Distibution Channel 2019 & 2032
- Table 83: Global Premium Bakery Products Revenue Million Forecast, by Country 2019 & 2032
- Table 84: Global Premium Bakery Products Volume K Tons Forecast, by Country 2019 & 2032
- Table 85: United Kingdom Premium Bakery Products Revenue (Million) Forecast, by Application 2019 & 2032
- Table 86: United Kingdom Premium Bakery Products Volume (K Tons) Forecast, by Application 2019 & 2032
- Table 87: Germany Premium Bakery Products Revenue (Million) Forecast, by Application 2019 & 2032
- Table 88: Germany Premium Bakery Products Volume (K Tons) Forecast, by Application 2019 & 2032
- Table 89: Spain Premium Bakery Products Revenue (Million) Forecast, by Application 2019 & 2032
- Table 90: Spain Premium Bakery Products Volume (K Tons) Forecast, by Application 2019 & 2032
- Table 91: France Premium Bakery Products Revenue (Million) Forecast, by Application 2019 & 2032
- Table 92: France Premium Bakery Products Volume (K Tons) Forecast, by Application 2019 & 2032
- Table 93: Italy Premium Bakery Products Revenue (Million) Forecast, by Application 2019 & 2032
- Table 94: Italy Premium Bakery Products Volume (K Tons) Forecast, by Application 2019 & 2032
- Table 95: Russia Premium Bakery Products Revenue (Million) Forecast, by Application 2019 & 2032
- Table 96: Russia Premium Bakery Products Volume (K Tons) Forecast, by Application 2019 & 2032
- Table 97: Rest of Europe Premium Bakery Products Revenue (Million) Forecast, by Application 2019 & 2032
- Table 98: Rest of Europe Premium Bakery Products Volume (K Tons) Forecast, by Application 2019 & 2032
- Table 99: Global Premium Bakery Products Revenue Million Forecast, by Product Type 2019 & 2032
- Table 100: Global Premium Bakery Products Volume K Tons Forecast, by Product Type 2019 & 2032
- Table 101: Global Premium Bakery Products Revenue Million Forecast, by Distibution Channel 2019 & 2032
- Table 102: Global Premium Bakery Products Volume K Tons Forecast, by Distibution Channel 2019 & 2032
- Table 103: Global Premium Bakery Products Revenue Million Forecast, by Country 2019 & 2032
- Table 104: Global Premium Bakery Products Volume K Tons Forecast, by Country 2019 & 2032
- Table 105: China Premium Bakery Products Revenue (Million) Forecast, by Application 2019 & 2032
- Table 106: China Premium Bakery Products Volume (K Tons) Forecast, by Application 2019 & 2032
- Table 107: Japan Premium Bakery Products Revenue (Million) Forecast, by Application 2019 & 2032
- Table 108: Japan Premium Bakery Products Volume (K Tons) Forecast, by Application 2019 & 2032
- Table 109: India Premium Bakery Products Revenue (Million) Forecast, by Application 2019 & 2032
- Table 110: India Premium Bakery Products Volume (K Tons) Forecast, by Application 2019 & 2032
- Table 111: Australia Premium Bakery Products Revenue (Million) Forecast, by Application 2019 & 2032
- Table 112: Australia Premium Bakery Products Volume (K Tons) Forecast, by Application 2019 & 2032
- Table 113: Rest of Asia Pacific Premium Bakery Products Revenue (Million) Forecast, by Application 2019 & 2032
- Table 114: Rest of Asia Pacific Premium Bakery Products Volume (K Tons) Forecast, by Application 2019 & 2032
- Table 115: Global Premium Bakery Products Revenue Million Forecast, by Product Type 2019 & 2032
- Table 116: Global Premium Bakery Products Volume K Tons Forecast, by Product Type 2019 & 2032
- Table 117: Global Premium Bakery Products Revenue Million Forecast, by Distibution Channel 2019 & 2032
- Table 118: Global Premium Bakery Products Volume K Tons Forecast, by Distibution Channel 2019 & 2032
- Table 119: Global Premium Bakery Products Revenue Million Forecast, by Country 2019 & 2032
- Table 120: Global Premium Bakery Products Volume K Tons Forecast, by Country 2019 & 2032
- Table 121: Brazil Premium Bakery Products Revenue (Million) Forecast, by Application 2019 & 2032
- Table 122: Brazil Premium Bakery Products Volume (K Tons) Forecast, by Application 2019 & 2032
- Table 123: Argentina Premium Bakery Products Revenue (Million) Forecast, by Application 2019 & 2032
- Table 124: Argentina Premium Bakery Products Volume (K Tons) Forecast, by Application 2019 & 2032
- Table 125: Rest of South America Premium Bakery Products Revenue (Million) Forecast, by Application 2019 & 2032
- Table 126: Rest of South America Premium Bakery Products Volume (K Tons) Forecast, by Application 2019 & 2032
- Table 127: Global Premium Bakery Products Revenue Million Forecast, by Product Type 2019 & 2032
- Table 128: Global Premium Bakery Products Volume K Tons Forecast, by Product Type 2019 & 2032
- Table 129: Global Premium Bakery Products Revenue Million Forecast, by Distibution Channel 2019 & 2032
- Table 130: Global Premium Bakery Products Volume K Tons Forecast, by Distibution Channel 2019 & 2032
- Table 131: Global Premium Bakery Products Revenue Million Forecast, by Country 2019 & 2032
- Table 132: Global Premium Bakery Products Volume K Tons Forecast, by Country 2019 & 2032
- Table 133: Global Premium Bakery Products Revenue Million Forecast, by Product Type 2019 & 2032
- Table 134: Global Premium Bakery Products Volume K Tons Forecast, by Product Type 2019 & 2032
- Table 135: Global Premium Bakery Products Revenue Million Forecast, by Distibution Channel 2019 & 2032
- Table 136: Global Premium Bakery Products Volume K Tons Forecast, by Distibution Channel 2019 & 2032
- Table 137: Global Premium Bakery Products Revenue Million Forecast, by Country 2019 & 2032
- Table 138: Global Premium Bakery Products Volume K Tons Forecast, by Country 2019 & 2032
- Table 139: South Africa Premium Bakery Products Revenue (Million) Forecast, by Application 2019 & 2032
- Table 140: South Africa Premium Bakery Products Volume (K Tons) Forecast, by Application 2019 & 2032
- Table 141: Rest of Middle East Premium Bakery Products Revenue (Million) Forecast, by Application 2019 & 2032
- Table 142: Rest of Middle East Premium Bakery Products Volume (K Tons) Forecast, by Application 2019 & 2032
Frequently Asked Questions
1. What is the projected Compound Annual Growth Rate (CAGR) of the Premium Bakery Products?
The projected CAGR is approximately 6.25%.
2. Which companies are prominent players in the Premium Bakery Products?
Key companies in the market include BARILLA G E R FRATELLI SPA, General Mills Inc, Finsbury Food Group Plc, ALMARAI COMPANY, FUJI BAKING CO LTD, Associated British Foods plc, Mondelez International Inc, Bimbo Bakeries USA, Bakers Delight Holdings Limited, Britannia Industries Ltd*List Not Exhaustive.
3. What are the main segments of the Premium Bakery Products?
The market segments include Product Type, Distibution Channel.
4. Can you provide details about the market size?
The market size is estimated to be USD XX Million as of 2022.
5. What are some drivers contributing to market growth?
Innovation in Vanillin Synthesis; Diverse Functionality of Vanillin In End-use Industries.
6. What are the notable trends driving market growth?
Rising demand for premium healthy snacking options is driving the market.
7. Are there any restraints impacting market growth?
Supply Chain Variability Impacting Vanilla Bean Availability For Flavor Production.
8. Can you provide examples of recent developments in the market?
In April 2022, Walker's Shortbread is partnering with retailer Dufry for the launch of a new Global Travel Retailer range into more than 55 travel sites worldwide including France. The product range will include several types of shortbreads and other products in it.
9. What pricing options are available for accessing the report?
Pricing options include single-user, multi-user, and enterprise licenses priced at USD 4750, USD 5250, and USD 8750 respectively.
10. Is the market size provided in terms of value or volume?
The market size is provided in terms of value, measured in Million and volume, measured in K Tons.
11. Are there any specific market keywords associated with the report?
Yes, the market keyword associated with the report is "Premium Bakery Products," which aids in identifying and referencing the specific market segment covered.
12. How do I determine which pricing option suits my needs best?
The pricing options vary based on user requirements and access needs. Individual users may opt for single-user licenses, while businesses requiring broader access may choose multi-user or enterprise licenses for cost-effective access to the report.
13. Are there any additional resources or data provided in the Premium Bakery Products report?
While the report offers comprehensive insights, it's advisable to review the specific contents or supplementary materials provided to ascertain if additional resources or data are available.
14. How can I stay updated on further developments or reports in the Premium Bakery Products?
To stay informed about further developments, trends, and reports in the Premium Bakery Products, consider subscribing to industry newsletters, following relevant companies and organizations, or regularly checking reputable industry news sources and publications.
Methodology
Step 1 - Identification of Relevant Samples Size from Population Database


Step 2 - Approaches for Defining Global Market Size (Value, Volume* & Price*)

Note*: In applicable scenarios
Step 3 - Data Sources
Primary Research
- Web Analytics
- Survey Reports
- Research Institute
- Latest Research Reports
- Opinion Leaders
Secondary Research
- Annual Reports
- White Paper
- Latest Press Release
- Industry Association
- Paid Database
- Investor Presentations

Step 4 - Data Triangulation
Involves using different sources of information in order to increase the validity of a study
These sources are likely to be stakeholders in a program - participants, other researchers, program staff, other community members, and so on.
Then we put all data in single framework & apply various statistical tools to find out the dynamic on the market.
During the analysis stage, feedback from the stakeholder groups would be compared to determine areas of agreement as well as areas of divergence
