

Key Insights
The global sepsis therapeutics market, currently experiencing robust growth, is projected to reach a substantial size driven by several key factors. The rising prevalence of sepsis, a life-threatening condition stemming from the body's overwhelming response to infection, fuels significant demand for effective treatments. Aging populations in developed nations and increasing antimicrobial resistance contribute to the market's expansion. Technological advancements in diagnostics and therapeutics, such as the development of novel antibiotics and faster diagnostic tools, further stimulate market growth. While the market is segmented by drug class (Aminoglycosides, Cephalosporins, Glycopeptide Antibiotics, and Others) and route of administration (Intravenous and Oral), intravenous administration currently dominates due to its rapid action and efficacy in severe sepsis cases. Major players like Pfizer, GSK, and AbbVie are actively involved in research and development, contributing to a competitive landscape characterized by ongoing innovation and mergers & acquisitions. The market exhibits regional variations, with North America and Europe holding substantial shares owing to advanced healthcare infrastructure and higher sepsis prevalence. However, Asia-Pacific is expected to witness significant growth in the coming years driven by increasing healthcare spending and rising awareness.
Despite the substantial market growth, challenges remain. High treatment costs and the need for rapid diagnosis and intervention pose significant barriers to widespread access, particularly in low- and middle-income countries. Furthermore, the continuous emergence of drug-resistant bacterial strains necessitates the development of novel therapeutics to maintain treatment efficacy. Addressing these challenges requires focused efforts on improving affordability and accessibility, coupled with continued research into new antibiotics and alternative therapeutic strategies. The forecast period of 2025-2033 indicates a strong outlook for the sepsis therapeutics market, with continued expansion driven by the factors mentioned above, although the rate of growth may fluctuate depending on the success of new drug development and the evolution of antimicrobial resistance patterns. The market is expected to continue its trajectory of growth and consolidation, with larger pharmaceutical companies strategically positioning themselves to capitalize on the increasing demand for effective sepsis treatments.
Sepsis Therapeutics Industry Market Report: 2019-2033
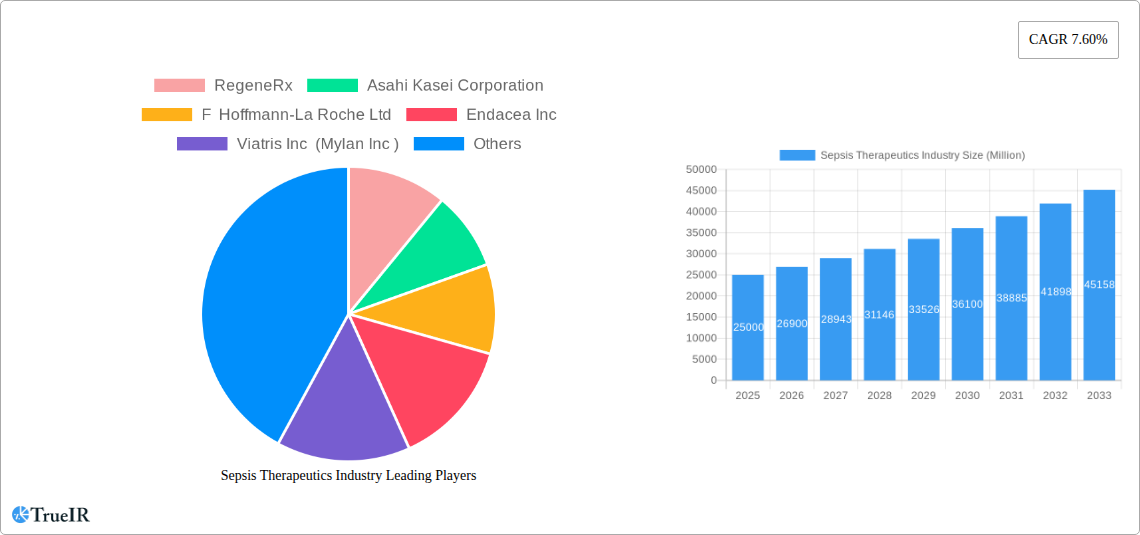
This comprehensive report provides a detailed analysis of the Sepsis Therapeutics industry, covering market size, growth drivers, competitive landscape, and future outlook from 2019 to 2033. With a focus on key players like RegeneRx, Asahi Kasei Corporation, and Pfizer Inc., this report is an essential resource for industry stakeholders, investors, and researchers seeking actionable insights into this dynamic market. The report leverages a robust methodology, combining extensive market research with detailed financial modeling, to provide a comprehensive and reliable forecast. The market value is predicted to reach xx Million by 2033.
Sepsis Therapeutics Industry Market Structure & Competitive Landscape
The sepsis therapeutics market exhibits a moderately concentrated structure, with a few large multinational pharmaceutical companies holding significant market share. However, the emergence of innovative biotech companies and a steady flow of new drug approvals suggest a dynamic competitive landscape. The market's competitive intensity is driven by factors such as:
- Innovation: Continuous research and development efforts are focused on developing novel therapies with improved efficacy and reduced side effects. The development of new drug classes, such as host-directed therapies, is a major driver of innovation.
- Regulatory Landscape: Stringent regulatory requirements for drug approval impact the market entry of new products, creating a significant barrier to entry for smaller companies. However, initiatives like Qualified Infectious Disease Product (QIDP) designation help expedite the development and approval of new treatments for sepsis.
- Product Substitutes: The availability of alternative treatments for sepsis, including supportive care measures, can influence the market share of specific therapeutic agents.
- End-User Segmentation: The market caters to a diverse range of end-users, including hospitals, clinics, and research institutions. Variations in treatment protocols and reimbursement policies across different healthcare settings impact the market dynamics.
- Mergers and Acquisitions (M&A): Consolidation activities, such as mergers and acquisitions, are reshaping the competitive landscape and creating larger entities with broader portfolios and greater market influence. While precise M&A volume data for this specific sector is unavailable, the overall pharmaceutical M&A activity reveals a significant trend towards consolidation (xx Million in transactions during 2019-2024, projected to increase).
The four-firm concentration ratio is estimated to be approximately xx%, indicating a moderately concentrated market. This concentration is expected to remain relatively stable over the forecast period, although smaller players could gain market share through successful product launches and strategic partnerships.
Sepsis Therapeutics Industry Market Trends & Opportunities
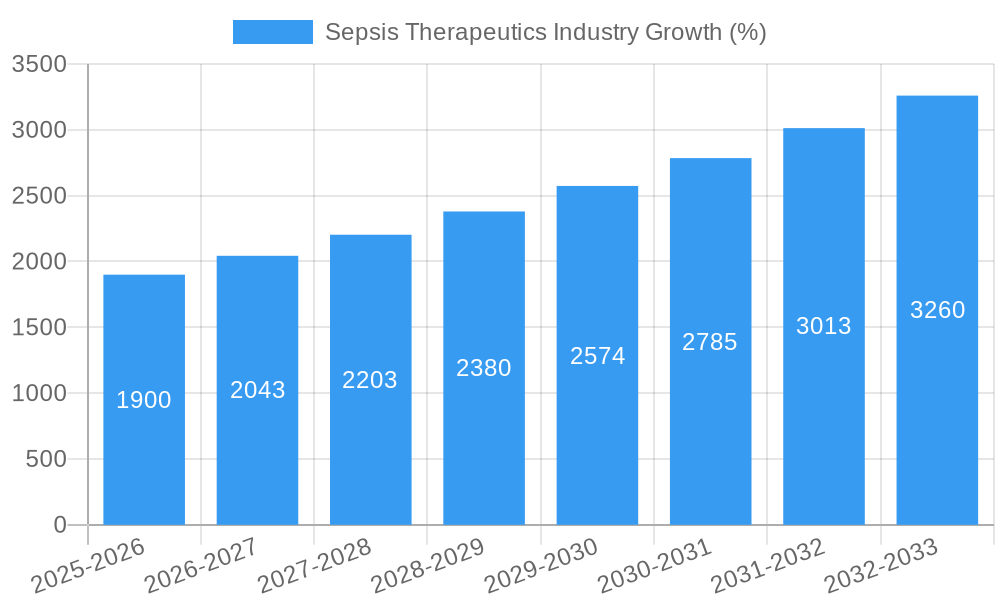
The global sepsis therapeutics market is witnessing robust growth, driven by factors such as the increasing prevalence of sepsis, advancements in diagnostic technologies, and the growing demand for effective treatment options. The market size is projected to grow at a Compound Annual Growth Rate (CAGR) of xx% during the forecast period (2025-2033), reaching xx Million by 2033 from an estimated value of xx Million in 2025. This growth is fuelled by:
- Rising Sepsis Prevalence: The global burden of sepsis continues to increase, creating a significant unmet medical need.
- Technological Advancements: Improvements in diagnostic tools, such as biomarkers and rapid diagnostic tests, facilitate early detection and prompt treatment.
- Development of Novel Therapies: Continuous research and development efforts have led to the introduction of new drug classes and improved treatment strategies.
- Increased Awareness and Public Health Initiatives: Growing awareness of sepsis among healthcare professionals and the general public, coupled with public health initiatives aimed at improving sepsis management, are creating a favorable environment for market growth.
The market penetration rate of effective sepsis treatments is still relatively low, presenting significant opportunities for growth. The focus on developing therapies that address the underlying causes of sepsis, rather than solely targeting the symptoms, offers substantial market potential.
Dominant Markets & Segments in Sepsis Therapeutics Industry
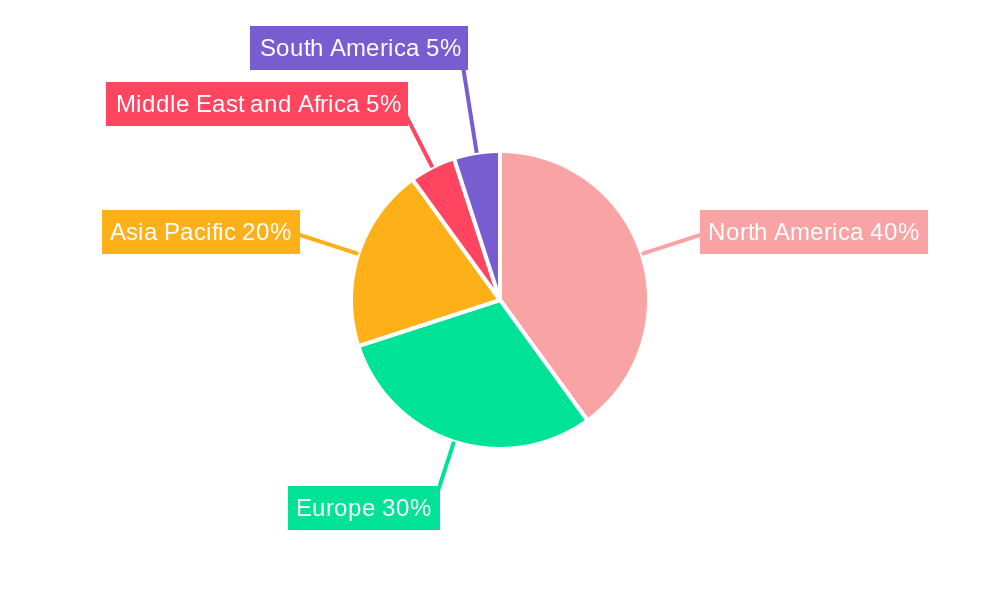
The North American market currently dominates the global sepsis therapeutics market, driven by high healthcare expenditure, robust healthcare infrastructure, and a significant number of clinical trials. However, the Asia-Pacific region is projected to experience rapid growth due to rising healthcare spending, increasing prevalence of sepsis, and growing awareness of the disease.
Key Growth Drivers:
- By Drug Class:
- Aminoglycosides: Strong existing market, but limitations in terms of toxicity and emergence of resistant strains are slowing growth.
- Cephalosporin: Widely used due to broad-spectrum activity and relatively low cost. Market growth is somewhat stable.
- Glycopeptide Antibiotics: Important for treating resistant strains, but high cost and potential for nephrotoxicity limit growth.
- Other Drug Classes: This segment presents significant opportunities due to the emergence of novel therapies, such as host-directed therapies and immunomodulators, promising enhanced efficacy and reduced toxicity.
- By Route of Administration:
- Intravenous: The dominant route of administration due to the severity of sepsis and need for rapid drug delivery.
- Oral: Oral administration offers improved patient comfort and convenience, driving growth in this segment.
Market Dominance Analysis:
The intravenous route of administration currently holds the largest market share, due to the need for rapid drug delivery in severe cases. However, the oral segment is projected to experience faster growth driven by the development of newer drugs suitable for oral administration. Among drug classes, "Other Drug Classes" are expected to dominate growth in the forecast period.
Sepsis Therapeutics Industry Product Analysis
The sepsis therapeutics market comprises a range of products, including antibiotics, immunomodulators, and supportive care therapies. Recent technological advancements have led to the development of novel antibiotics with improved efficacy and reduced side effects. Furthermore, the focus is shifting towards personalized medicine approaches, where treatment strategies are tailored to individual patient characteristics. This helps optimize treatment outcomes and minimizes the risk of adverse effects. The market is also seeing the introduction of diagnostic tools that enable rapid and accurate identification of sepsis, facilitating timely and targeted therapy. This leads to improved patient outcomes and reduced healthcare costs.
Key Drivers, Barriers & Challenges in Sepsis Therapeutics Industry
Key Drivers:
- Increasing prevalence of sepsis globally, coupled with rising healthcare expenditure and awareness.
- Advancements in diagnostic technologies and therapeutic agents, leading to earlier diagnosis and improved treatment outcomes.
- Government initiatives and funding for research and development of new sepsis therapies.
Challenges and Restraints:
- High costs associated with developing and manufacturing new therapies, limiting market access and affordability.
- Complex regulatory requirements for drug approval, increasing the time and cost of bringing new products to market.
- Emergence of antibiotic-resistant strains, necessitating the development of novel therapies.
- Supply chain disruptions and shortages of critical components can hinder the production and distribution of sepsis therapeutics. These issues can lead to an estimated xx% reduction in market supply during peak periods.
Growth Drivers in the Sepsis Therapeutics Industry Market
Technological advancements, particularly in diagnostics and novel therapeutics (host-directed therapies, immunomodulators), are significantly driving market expansion. The economic incentive created by the high prevalence and severity of sepsis coupled with government funding for research and development further accelerates growth. Favorable regulatory environments like QIDP designation programs also play a crucial role.
Challenges Impacting Sepsis Therapeutics Industry Growth
High drug development costs, coupled with stringent regulatory hurdles, create significant barriers to entry for new players. Antibiotic resistance remains a major challenge, demanding continuous research and development of new drug classes. Furthermore, inconsistencies in healthcare infrastructure across regions and the subsequent variability in healthcare access significantly affect market growth potential.
Key Players Shaping the Sepsis Therapeutics Industry Market
- RegeneRx
- Asahi Kasei Corporation
- F Hoffmann-La Roche Ltd
- Endacea Inc
- Viatris Inc (Mylan Inc)
- GSK Plc
- Inotrem SA
- Adrenomed AG
- AbbVie Inc (Allergan Pharmaceuticals Private Limited)
- Pfizer Inc
Significant Sepsis Therapeutics Industry Milestones
- May 2022: Phathom Pharmaceuticals received FDA approval for VOQUEZNA TRIPLE PAK and VOQUEZNA DUAL PAK for H. pylori infection. This highlights the progress in drug development and regulatory pathways within the broader infectious disease space, indirectly impacting the sepsis therapeutics market through advancements in antimicrobial strategies.
- May 2022: Sepsis Alliance launched the Sepsis Innovation Collaborative (SIC), a public-private partnership fostering innovation in sepsis diagnosis and treatment. This collaboration signifies a broader industry shift towards collaborative research and development efforts.
Future Outlook for Sepsis Therapeutics Industry Market
The sepsis therapeutics market is poised for significant growth driven by technological advancements in diagnostics and drug development. The emergence of new drug classes, coupled with a greater focus on preventative measures and personalized medicine, will shape the future landscape. This will create opportunities for players focusing on novel therapeutic targets, and innovative diagnostics. The market's future trajectory is significantly influenced by the continuing global fight against antibiotic resistance and the success of collaborative efforts to improve sepsis outcomes.
Sepsis Therapeutics Industry Segmentation
-
1. Drug Class
- 1.1. Aminoglycosides
- 1.2. Cephalosporin
- 1.3. Glycopeptide Antibiotics
- 1.4. Other Drug Classes
-
2. Route of Administration
- 2.1. Intravenous
- 2.2. Oral
Sepsis Therapeutics Industry Segmentation By Geography
-
1. North America
- 1.1. United States
- 1.2. Canada
- 1.3. Mexico
-
2. Europe
- 2.1. Germany
- 2.2. United Kingdom
- 2.3. France
- 2.4. Italy
- 2.5. Spain
- 2.6. Rest of Europe
-
3. Asia Pacific
- 3.1. China
- 3.2. Japan
- 3.3. India
- 3.4. Australia
- 3.5. South Korea
- 3.6. Rest of Asia Pacific
-
4. Middle East and Africa
- 4.1. GCC
- 4.2. South Africa
- 4.3. Rest of Middle East and Africa
-
5. South America
- 5.1. Brazil
- 5.2. Argentina
- 5.3. Rest of South America
Sepsis Therapeutics Industry REPORT HIGHLIGHTS
| Aspects | Details |
|---|---|
| Study Period | 2019-2033 |
| Base Year | 2024 |
| Estimated Year | 2025 |
| Forecast Period | 2025-2033 |
| Historical Period | 2019-2024 |
| Growth Rate | CAGR of 7.60% from 2019-2033 |
| Segmentation |
|
Table of Contents
- 1. Introduction
- 1.1. Research Scope
- 1.2. Market Segmentation
- 1.3. Research Methodology
- 1.4. Definitions and Assumptions
- 2. Executive Summary
- 2.1. Introduction
- 3. Market Dynamics
- 3.1. Introduction
- 3.2. Market Drivers
- 3.2.1. Increasing Incidence of Sepsis; High Prevalence of Sepsis in Infants; Rise in the Number of Pipeline Products and Upsurge in Research and Development Expenditures
- 3.3. Market Restrains
- 3.3.1. Lack of Initial Diagnostic Test for identifying Sepsis Conditions and Lack of Awareness
- 3.4. Market Trends
- 3.4.1. Cephalosporins Are Expected To Witness Growth Over The Forecast Period
- 4. Market Factor Analysis
- 4.1. Porters Five Forces
- 4.2. Supply/Value Chain
- 4.3. PESTEL analysis
- 4.4. Market Entropy
- 4.5. Patent/Trademark Analysis
- 5. Global Sepsis Therapeutics Industry Analysis, Insights and Forecast, 2019-2031
- 5.1. Market Analysis, Insights and Forecast - by Drug Class
- 5.1.1. Aminoglycosides
- 5.1.2. Cephalosporin
- 5.1.3. Glycopeptide Antibiotics
- 5.1.4. Other Drug Classes
- 5.2. Market Analysis, Insights and Forecast - by Route of Administration
- 5.2.1. Intravenous
- 5.2.2. Oral
- 5.3. Market Analysis, Insights and Forecast - by Region
- 5.3.1. North America
- 5.3.2. Europe
- 5.3.3. Asia Pacific
- 5.3.4. Middle East and Africa
- 5.3.5. South America
- 5.1. Market Analysis, Insights and Forecast - by Drug Class
- 6. North America Sepsis Therapeutics Industry Analysis, Insights and Forecast, 2019-2031
- 6.1. Market Analysis, Insights and Forecast - by Drug Class
- 6.1.1. Aminoglycosides
- 6.1.2. Cephalosporin
- 6.1.3. Glycopeptide Antibiotics
- 6.1.4. Other Drug Classes
- 6.2. Market Analysis, Insights and Forecast - by Route of Administration
- 6.2.1. Intravenous
- 6.2.2. Oral
- 6.1. Market Analysis, Insights and Forecast - by Drug Class
- 7. Europe Sepsis Therapeutics Industry Analysis, Insights and Forecast, 2019-2031
- 7.1. Market Analysis, Insights and Forecast - by Drug Class
- 7.1.1. Aminoglycosides
- 7.1.2. Cephalosporin
- 7.1.3. Glycopeptide Antibiotics
- 7.1.4. Other Drug Classes
- 7.2. Market Analysis, Insights and Forecast - by Route of Administration
- 7.2.1. Intravenous
- 7.2.2. Oral
- 7.1. Market Analysis, Insights and Forecast - by Drug Class
- 8. Asia Pacific Sepsis Therapeutics Industry Analysis, Insights and Forecast, 2019-2031
- 8.1. Market Analysis, Insights and Forecast - by Drug Class
- 8.1.1. Aminoglycosides
- 8.1.2. Cephalosporin
- 8.1.3. Glycopeptide Antibiotics
- 8.1.4. Other Drug Classes
- 8.2. Market Analysis, Insights and Forecast - by Route of Administration
- 8.2.1. Intravenous
- 8.2.2. Oral
- 8.1. Market Analysis, Insights and Forecast - by Drug Class
- 9. Middle East and Africa Sepsis Therapeutics Industry Analysis, Insights and Forecast, 2019-2031
- 9.1. Market Analysis, Insights and Forecast - by Drug Class
- 9.1.1. Aminoglycosides
- 9.1.2. Cephalosporin
- 9.1.3. Glycopeptide Antibiotics
- 9.1.4. Other Drug Classes
- 9.2. Market Analysis, Insights and Forecast - by Route of Administration
- 9.2.1. Intravenous
- 9.2.2. Oral
- 9.1. Market Analysis, Insights and Forecast - by Drug Class
- 10. South America Sepsis Therapeutics Industry Analysis, Insights and Forecast, 2019-2031
- 10.1. Market Analysis, Insights and Forecast - by Drug Class
- 10.1.1. Aminoglycosides
- 10.1.2. Cephalosporin
- 10.1.3. Glycopeptide Antibiotics
- 10.1.4. Other Drug Classes
- 10.2. Market Analysis, Insights and Forecast - by Route of Administration
- 10.2.1. Intravenous
- 10.2.2. Oral
- 10.1. Market Analysis, Insights and Forecast - by Drug Class
- 11. North America Sepsis Therapeutics Industry Analysis, Insights and Forecast, 2019-2031
- 11.1. Market Analysis, Insights and Forecast - By Country/Sub-region
- 11.1.1 United States
- 11.1.2 Canada
- 11.1.3 Mexico
- 12. Europe Sepsis Therapeutics Industry Analysis, Insights and Forecast, 2019-2031
- 12.1. Market Analysis, Insights and Forecast - By Country/Sub-region
- 12.1.1 Germany
- 12.1.2 United Kingdom
- 12.1.3 France
- 12.1.4 Italy
- 12.1.5 Spain
- 12.1.6 Rest of Europe
- 13. Asia Pacific Sepsis Therapeutics Industry Analysis, Insights and Forecast, 2019-2031
- 13.1. Market Analysis, Insights and Forecast - By Country/Sub-region
- 13.1.1 China
- 13.1.2 Japan
- 13.1.3 India
- 13.1.4 Australia
- 13.1.5 South Korea
- 13.1.6 Rest of Asia Pacific
- 14. Middle East and Africa Sepsis Therapeutics Industry Analysis, Insights and Forecast, 2019-2031
- 14.1. Market Analysis, Insights and Forecast - By Country/Sub-region
- 14.1.1 GCC
- 14.1.2 South Africa
- 14.1.3 Rest of Middle East and Africa
- 15. South America Sepsis Therapeutics Industry Analysis, Insights and Forecast, 2019-2031
- 15.1. Market Analysis, Insights and Forecast - By Country/Sub-region
- 15.1.1 Brazil
- 15.1.2 Argentina
- 15.1.3 Rest of South America
- 16. Competitive Analysis
- 16.1. Global Market Share Analysis 2024
- 16.2. Company Profiles
- 16.2.1 RegeneRx
- 16.2.1.1. Overview
- 16.2.1.2. Products
- 16.2.1.3. SWOT Analysis
- 16.2.1.4. Recent Developments
- 16.2.1.5. Financials (Based on Availability)
- 16.2.2 Asahi Kasei Corporation
- 16.2.2.1. Overview
- 16.2.2.2. Products
- 16.2.2.3. SWOT Analysis
- 16.2.2.4. Recent Developments
- 16.2.2.5. Financials (Based on Availability)
- 16.2.3 F Hoffmann-La Roche Ltd
- 16.2.3.1. Overview
- 16.2.3.2. Products
- 16.2.3.3. SWOT Analysis
- 16.2.3.4. Recent Developments
- 16.2.3.5. Financials (Based on Availability)
- 16.2.4 Endacea Inc
- 16.2.4.1. Overview
- 16.2.4.2. Products
- 16.2.4.3. SWOT Analysis
- 16.2.4.4. Recent Developments
- 16.2.4.5. Financials (Based on Availability)
- 16.2.5 Viatris Inc (Mylan Inc )
- 16.2.5.1. Overview
- 16.2.5.2. Products
- 16.2.5.3. SWOT Analysis
- 16.2.5.4. Recent Developments
- 16.2.5.5. Financials (Based on Availability)
- 16.2.6 GSK Plc
- 16.2.6.1. Overview
- 16.2.6.2. Products
- 16.2.6.3. SWOT Analysis
- 16.2.6.4. Recent Developments
- 16.2.6.5. Financials (Based on Availability)
- 16.2.7 Inotrem SA
- 16.2.7.1. Overview
- 16.2.7.2. Products
- 16.2.7.3. SWOT Analysis
- 16.2.7.4. Recent Developments
- 16.2.7.5. Financials (Based on Availability)
- 16.2.8 Adrenomed AG
- 16.2.8.1. Overview
- 16.2.8.2. Products
- 16.2.8.3. SWOT Analysis
- 16.2.8.4. Recent Developments
- 16.2.8.5. Financials (Based on Availability)
- 16.2.9 AbbVie Inc (Allergan Pharmaceuticals Private Limited)
- 16.2.9.1. Overview
- 16.2.9.2. Products
- 16.2.9.3. SWOT Analysis
- 16.2.9.4. Recent Developments
- 16.2.9.5. Financials (Based on Availability)
- 16.2.10 Pfizer Inc
- 16.2.10.1. Overview
- 16.2.10.2. Products
- 16.2.10.3. SWOT Analysis
- 16.2.10.4. Recent Developments
- 16.2.10.5. Financials (Based on Availability)
- 16.2.1 RegeneRx
List of Figures
- Figure 1: Global Sepsis Therapeutics Industry Revenue Breakdown (Million, %) by Region 2024 & 2032
- Figure 2: Global Sepsis Therapeutics Industry Volume Breakdown (K Unit, %) by Region 2024 & 2032
- Figure 3: North America Sepsis Therapeutics Industry Revenue (Million), by Country 2024 & 2032
- Figure 4: North America Sepsis Therapeutics Industry Volume (K Unit), by Country 2024 & 2032
- Figure 5: North America Sepsis Therapeutics Industry Revenue Share (%), by Country 2024 & 2032
- Figure 6: North America Sepsis Therapeutics Industry Volume Share (%), by Country 2024 & 2032
- Figure 7: Europe Sepsis Therapeutics Industry Revenue (Million), by Country 2024 & 2032
- Figure 8: Europe Sepsis Therapeutics Industry Volume (K Unit), by Country 2024 & 2032
- Figure 9: Europe Sepsis Therapeutics Industry Revenue Share (%), by Country 2024 & 2032
- Figure 10: Europe Sepsis Therapeutics Industry Volume Share (%), by Country 2024 & 2032
- Figure 11: Asia Pacific Sepsis Therapeutics Industry Revenue (Million), by Country 2024 & 2032
- Figure 12: Asia Pacific Sepsis Therapeutics Industry Volume (K Unit), by Country 2024 & 2032
- Figure 13: Asia Pacific Sepsis Therapeutics Industry Revenue Share (%), by Country 2024 & 2032
- Figure 14: Asia Pacific Sepsis Therapeutics Industry Volume Share (%), by Country 2024 & 2032
- Figure 15: Middle East and Africa Sepsis Therapeutics Industry Revenue (Million), by Country 2024 & 2032
- Figure 16: Middle East and Africa Sepsis Therapeutics Industry Volume (K Unit), by Country 2024 & 2032
- Figure 17: Middle East and Africa Sepsis Therapeutics Industry Revenue Share (%), by Country 2024 & 2032
- Figure 18: Middle East and Africa Sepsis Therapeutics Industry Volume Share (%), by Country 2024 & 2032
- Figure 19: South America Sepsis Therapeutics Industry Revenue (Million), by Country 2024 & 2032
- Figure 20: South America Sepsis Therapeutics Industry Volume (K Unit), by Country 2024 & 2032
- Figure 21: South America Sepsis Therapeutics Industry Revenue Share (%), by Country 2024 & 2032
- Figure 22: South America Sepsis Therapeutics Industry Volume Share (%), by Country 2024 & 2032
- Figure 23: North America Sepsis Therapeutics Industry Revenue (Million), by Drug Class 2024 & 2032
- Figure 24: North America Sepsis Therapeutics Industry Volume (K Unit), by Drug Class 2024 & 2032
- Figure 25: North America Sepsis Therapeutics Industry Revenue Share (%), by Drug Class 2024 & 2032
- Figure 26: North America Sepsis Therapeutics Industry Volume Share (%), by Drug Class 2024 & 2032
- Figure 27: North America Sepsis Therapeutics Industry Revenue (Million), by Route of Administration 2024 & 2032
- Figure 28: North America Sepsis Therapeutics Industry Volume (K Unit), by Route of Administration 2024 & 2032
- Figure 29: North America Sepsis Therapeutics Industry Revenue Share (%), by Route of Administration 2024 & 2032
- Figure 30: North America Sepsis Therapeutics Industry Volume Share (%), by Route of Administration 2024 & 2032
- Figure 31: North America Sepsis Therapeutics Industry Revenue (Million), by Country 2024 & 2032
- Figure 32: North America Sepsis Therapeutics Industry Volume (K Unit), by Country 2024 & 2032
- Figure 33: North America Sepsis Therapeutics Industry Revenue Share (%), by Country 2024 & 2032
- Figure 34: North America Sepsis Therapeutics Industry Volume Share (%), by Country 2024 & 2032
- Figure 35: Europe Sepsis Therapeutics Industry Revenue (Million), by Drug Class 2024 & 2032
- Figure 36: Europe Sepsis Therapeutics Industry Volume (K Unit), by Drug Class 2024 & 2032
- Figure 37: Europe Sepsis Therapeutics Industry Revenue Share (%), by Drug Class 2024 & 2032
- Figure 38: Europe Sepsis Therapeutics Industry Volume Share (%), by Drug Class 2024 & 2032
- Figure 39: Europe Sepsis Therapeutics Industry Revenue (Million), by Route of Administration 2024 & 2032
- Figure 40: Europe Sepsis Therapeutics Industry Volume (K Unit), by Route of Administration 2024 & 2032
- Figure 41: Europe Sepsis Therapeutics Industry Revenue Share (%), by Route of Administration 2024 & 2032
- Figure 42: Europe Sepsis Therapeutics Industry Volume Share (%), by Route of Administration 2024 & 2032
- Figure 43: Europe Sepsis Therapeutics Industry Revenue (Million), by Country 2024 & 2032
- Figure 44: Europe Sepsis Therapeutics Industry Volume (K Unit), by Country 2024 & 2032
- Figure 45: Europe Sepsis Therapeutics Industry Revenue Share (%), by Country 2024 & 2032
- Figure 46: Europe Sepsis Therapeutics Industry Volume Share (%), by Country 2024 & 2032
- Figure 47: Asia Pacific Sepsis Therapeutics Industry Revenue (Million), by Drug Class 2024 & 2032
- Figure 48: Asia Pacific Sepsis Therapeutics Industry Volume (K Unit), by Drug Class 2024 & 2032
- Figure 49: Asia Pacific Sepsis Therapeutics Industry Revenue Share (%), by Drug Class 2024 & 2032
- Figure 50: Asia Pacific Sepsis Therapeutics Industry Volume Share (%), by Drug Class 2024 & 2032
- Figure 51: Asia Pacific Sepsis Therapeutics Industry Revenue (Million), by Route of Administration 2024 & 2032
- Figure 52: Asia Pacific Sepsis Therapeutics Industry Volume (K Unit), by Route of Administration 2024 & 2032
- Figure 53: Asia Pacific Sepsis Therapeutics Industry Revenue Share (%), by Route of Administration 2024 & 2032
- Figure 54: Asia Pacific Sepsis Therapeutics Industry Volume Share (%), by Route of Administration 2024 & 2032
- Figure 55: Asia Pacific Sepsis Therapeutics Industry Revenue (Million), by Country 2024 & 2032
- Figure 56: Asia Pacific Sepsis Therapeutics Industry Volume (K Unit), by Country 2024 & 2032
- Figure 57: Asia Pacific Sepsis Therapeutics Industry Revenue Share (%), by Country 2024 & 2032
- Figure 58: Asia Pacific Sepsis Therapeutics Industry Volume Share (%), by Country 2024 & 2032
- Figure 59: Middle East and Africa Sepsis Therapeutics Industry Revenue (Million), by Drug Class 2024 & 2032
- Figure 60: Middle East and Africa Sepsis Therapeutics Industry Volume (K Unit), by Drug Class 2024 & 2032
- Figure 61: Middle East and Africa Sepsis Therapeutics Industry Revenue Share (%), by Drug Class 2024 & 2032
- Figure 62: Middle East and Africa Sepsis Therapeutics Industry Volume Share (%), by Drug Class 2024 & 2032
- Figure 63: Middle East and Africa Sepsis Therapeutics Industry Revenue (Million), by Route of Administration 2024 & 2032
- Figure 64: Middle East and Africa Sepsis Therapeutics Industry Volume (K Unit), by Route of Administration 2024 & 2032
- Figure 65: Middle East and Africa Sepsis Therapeutics Industry Revenue Share (%), by Route of Administration 2024 & 2032
- Figure 66: Middle East and Africa Sepsis Therapeutics Industry Volume Share (%), by Route of Administration 2024 & 2032
- Figure 67: Middle East and Africa Sepsis Therapeutics Industry Revenue (Million), by Country 2024 & 2032
- Figure 68: Middle East and Africa Sepsis Therapeutics Industry Volume (K Unit), by Country 2024 & 2032
- Figure 69: Middle East and Africa Sepsis Therapeutics Industry Revenue Share (%), by Country 2024 & 2032
- Figure 70: Middle East and Africa Sepsis Therapeutics Industry Volume Share (%), by Country 2024 & 2032
- Figure 71: South America Sepsis Therapeutics Industry Revenue (Million), by Drug Class 2024 & 2032
- Figure 72: South America Sepsis Therapeutics Industry Volume (K Unit), by Drug Class 2024 & 2032
- Figure 73: South America Sepsis Therapeutics Industry Revenue Share (%), by Drug Class 2024 & 2032
- Figure 74: South America Sepsis Therapeutics Industry Volume Share (%), by Drug Class 2024 & 2032
- Figure 75: South America Sepsis Therapeutics Industry Revenue (Million), by Route of Administration 2024 & 2032
- Figure 76: South America Sepsis Therapeutics Industry Volume (K Unit), by Route of Administration 2024 & 2032
- Figure 77: South America Sepsis Therapeutics Industry Revenue Share (%), by Route of Administration 2024 & 2032
- Figure 78: South America Sepsis Therapeutics Industry Volume Share (%), by Route of Administration 2024 & 2032
- Figure 79: South America Sepsis Therapeutics Industry Revenue (Million), by Country 2024 & 2032
- Figure 80: South America Sepsis Therapeutics Industry Volume (K Unit), by Country 2024 & 2032
- Figure 81: South America Sepsis Therapeutics Industry Revenue Share (%), by Country 2024 & 2032
- Figure 82: South America Sepsis Therapeutics Industry Volume Share (%), by Country 2024 & 2032
List of Tables
- Table 1: Global Sepsis Therapeutics Industry Revenue Million Forecast, by Region 2019 & 2032
- Table 2: Global Sepsis Therapeutics Industry Volume K Unit Forecast, by Region 2019 & 2032
- Table 3: Global Sepsis Therapeutics Industry Revenue Million Forecast, by Drug Class 2019 & 2032
- Table 4: Global Sepsis Therapeutics Industry Volume K Unit Forecast, by Drug Class 2019 & 2032
- Table 5: Global Sepsis Therapeutics Industry Revenue Million Forecast, by Route of Administration 2019 & 2032
- Table 6: Global Sepsis Therapeutics Industry Volume K Unit Forecast, by Route of Administration 2019 & 2032
- Table 7: Global Sepsis Therapeutics Industry Revenue Million Forecast, by Region 2019 & 2032
- Table 8: Global Sepsis Therapeutics Industry Volume K Unit Forecast, by Region 2019 & 2032
- Table 9: Global Sepsis Therapeutics Industry Revenue Million Forecast, by Country 2019 & 2032
- Table 10: Global Sepsis Therapeutics Industry Volume K Unit Forecast, by Country 2019 & 2032
- Table 11: United States Sepsis Therapeutics Industry Revenue (Million) Forecast, by Application 2019 & 2032
- Table 12: United States Sepsis Therapeutics Industry Volume (K Unit) Forecast, by Application 2019 & 2032
- Table 13: Canada Sepsis Therapeutics Industry Revenue (Million) Forecast, by Application 2019 & 2032
- Table 14: Canada Sepsis Therapeutics Industry Volume (K Unit) Forecast, by Application 2019 & 2032
- Table 15: Mexico Sepsis Therapeutics Industry Revenue (Million) Forecast, by Application 2019 & 2032
- Table 16: Mexico Sepsis Therapeutics Industry Volume (K Unit) Forecast, by Application 2019 & 2032
- Table 17: Global Sepsis Therapeutics Industry Revenue Million Forecast, by Country 2019 & 2032
- Table 18: Global Sepsis Therapeutics Industry Volume K Unit Forecast, by Country 2019 & 2032
- Table 19: Germany Sepsis Therapeutics Industry Revenue (Million) Forecast, by Application 2019 & 2032
- Table 20: Germany Sepsis Therapeutics Industry Volume (K Unit) Forecast, by Application 2019 & 2032
- Table 21: United Kingdom Sepsis Therapeutics Industry Revenue (Million) Forecast, by Application 2019 & 2032
- Table 22: United Kingdom Sepsis Therapeutics Industry Volume (K Unit) Forecast, by Application 2019 & 2032
- Table 23: France Sepsis Therapeutics Industry Revenue (Million) Forecast, by Application 2019 & 2032
- Table 24: France Sepsis Therapeutics Industry Volume (K Unit) Forecast, by Application 2019 & 2032
- Table 25: Italy Sepsis Therapeutics Industry Revenue (Million) Forecast, by Application 2019 & 2032
- Table 26: Italy Sepsis Therapeutics Industry Volume (K Unit) Forecast, by Application 2019 & 2032
- Table 27: Spain Sepsis Therapeutics Industry Revenue (Million) Forecast, by Application 2019 & 2032
- Table 28: Spain Sepsis Therapeutics Industry Volume (K Unit) Forecast, by Application 2019 & 2032
- Table 29: Rest of Europe Sepsis Therapeutics Industry Revenue (Million) Forecast, by Application 2019 & 2032
- Table 30: Rest of Europe Sepsis Therapeutics Industry Volume (K Unit) Forecast, by Application 2019 & 2032
- Table 31: Global Sepsis Therapeutics Industry Revenue Million Forecast, by Country 2019 & 2032
- Table 32: Global Sepsis Therapeutics Industry Volume K Unit Forecast, by Country 2019 & 2032
- Table 33: China Sepsis Therapeutics Industry Revenue (Million) Forecast, by Application 2019 & 2032
- Table 34: China Sepsis Therapeutics Industry Volume (K Unit) Forecast, by Application 2019 & 2032
- Table 35: Japan Sepsis Therapeutics Industry Revenue (Million) Forecast, by Application 2019 & 2032
- Table 36: Japan Sepsis Therapeutics Industry Volume (K Unit) Forecast, by Application 2019 & 2032
- Table 37: India Sepsis Therapeutics Industry Revenue (Million) Forecast, by Application 2019 & 2032
- Table 38: India Sepsis Therapeutics Industry Volume (K Unit) Forecast, by Application 2019 & 2032
- Table 39: Australia Sepsis Therapeutics Industry Revenue (Million) Forecast, by Application 2019 & 2032
- Table 40: Australia Sepsis Therapeutics Industry Volume (K Unit) Forecast, by Application 2019 & 2032
- Table 41: South Korea Sepsis Therapeutics Industry Revenue (Million) Forecast, by Application 2019 & 2032
- Table 42: South Korea Sepsis Therapeutics Industry Volume (K Unit) Forecast, by Application 2019 & 2032
- Table 43: Rest of Asia Pacific Sepsis Therapeutics Industry Revenue (Million) Forecast, by Application 2019 & 2032
- Table 44: Rest of Asia Pacific Sepsis Therapeutics Industry Volume (K Unit) Forecast, by Application 2019 & 2032
- Table 45: Global Sepsis Therapeutics Industry Revenue Million Forecast, by Country 2019 & 2032
- Table 46: Global Sepsis Therapeutics Industry Volume K Unit Forecast, by Country 2019 & 2032
- Table 47: GCC Sepsis Therapeutics Industry Revenue (Million) Forecast, by Application 2019 & 2032
- Table 48: GCC Sepsis Therapeutics Industry Volume (K Unit) Forecast, by Application 2019 & 2032
- Table 49: South Africa Sepsis Therapeutics Industry Revenue (Million) Forecast, by Application 2019 & 2032
- Table 50: South Africa Sepsis Therapeutics Industry Volume (K Unit) Forecast, by Application 2019 & 2032
- Table 51: Rest of Middle East and Africa Sepsis Therapeutics Industry Revenue (Million) Forecast, by Application 2019 & 2032
- Table 52: Rest of Middle East and Africa Sepsis Therapeutics Industry Volume (K Unit) Forecast, by Application 2019 & 2032
- Table 53: Global Sepsis Therapeutics Industry Revenue Million Forecast, by Country 2019 & 2032
- Table 54: Global Sepsis Therapeutics Industry Volume K Unit Forecast, by Country 2019 & 2032
- Table 55: Brazil Sepsis Therapeutics Industry Revenue (Million) Forecast, by Application 2019 & 2032
- Table 56: Brazil Sepsis Therapeutics Industry Volume (K Unit) Forecast, by Application 2019 & 2032
- Table 57: Argentina Sepsis Therapeutics Industry Revenue (Million) Forecast, by Application 2019 & 2032
- Table 58: Argentina Sepsis Therapeutics Industry Volume (K Unit) Forecast, by Application 2019 & 2032
- Table 59: Rest of South America Sepsis Therapeutics Industry Revenue (Million) Forecast, by Application 2019 & 2032
- Table 60: Rest of South America Sepsis Therapeutics Industry Volume (K Unit) Forecast, by Application 2019 & 2032
- Table 61: Global Sepsis Therapeutics Industry Revenue Million Forecast, by Drug Class 2019 & 2032
- Table 62: Global Sepsis Therapeutics Industry Volume K Unit Forecast, by Drug Class 2019 & 2032
- Table 63: Global Sepsis Therapeutics Industry Revenue Million Forecast, by Route of Administration 2019 & 2032
- Table 64: Global Sepsis Therapeutics Industry Volume K Unit Forecast, by Route of Administration 2019 & 2032
- Table 65: Global Sepsis Therapeutics Industry Revenue Million Forecast, by Country 2019 & 2032
- Table 66: Global Sepsis Therapeutics Industry Volume K Unit Forecast, by Country 2019 & 2032
- Table 67: United States Sepsis Therapeutics Industry Revenue (Million) Forecast, by Application 2019 & 2032
- Table 68: United States Sepsis Therapeutics Industry Volume (K Unit) Forecast, by Application 2019 & 2032
- Table 69: Canada Sepsis Therapeutics Industry Revenue (Million) Forecast, by Application 2019 & 2032
- Table 70: Canada Sepsis Therapeutics Industry Volume (K Unit) Forecast, by Application 2019 & 2032
- Table 71: Mexico Sepsis Therapeutics Industry Revenue (Million) Forecast, by Application 2019 & 2032
- Table 72: Mexico Sepsis Therapeutics Industry Volume (K Unit) Forecast, by Application 2019 & 2032
- Table 73: Global Sepsis Therapeutics Industry Revenue Million Forecast, by Drug Class 2019 & 2032
- Table 74: Global Sepsis Therapeutics Industry Volume K Unit Forecast, by Drug Class 2019 & 2032
- Table 75: Global Sepsis Therapeutics Industry Revenue Million Forecast, by Route of Administration 2019 & 2032
- Table 76: Global Sepsis Therapeutics Industry Volume K Unit Forecast, by Route of Administration 2019 & 2032
- Table 77: Global Sepsis Therapeutics Industry Revenue Million Forecast, by Country 2019 & 2032
- Table 78: Global Sepsis Therapeutics Industry Volume K Unit Forecast, by Country 2019 & 2032
- Table 79: Germany Sepsis Therapeutics Industry Revenue (Million) Forecast, by Application 2019 & 2032
- Table 80: Germany Sepsis Therapeutics Industry Volume (K Unit) Forecast, by Application 2019 & 2032
- Table 81: United Kingdom Sepsis Therapeutics Industry Revenue (Million) Forecast, by Application 2019 & 2032
- Table 82: United Kingdom Sepsis Therapeutics Industry Volume (K Unit) Forecast, by Application 2019 & 2032
- Table 83: France Sepsis Therapeutics Industry Revenue (Million) Forecast, by Application 2019 & 2032
- Table 84: France Sepsis Therapeutics Industry Volume (K Unit) Forecast, by Application 2019 & 2032
- Table 85: Italy Sepsis Therapeutics Industry Revenue (Million) Forecast, by Application 2019 & 2032
- Table 86: Italy Sepsis Therapeutics Industry Volume (K Unit) Forecast, by Application 2019 & 2032
- Table 87: Spain Sepsis Therapeutics Industry Revenue (Million) Forecast, by Application 2019 & 2032
- Table 88: Spain Sepsis Therapeutics Industry Volume (K Unit) Forecast, by Application 2019 & 2032
- Table 89: Rest of Europe Sepsis Therapeutics Industry Revenue (Million) Forecast, by Application 2019 & 2032
- Table 90: Rest of Europe Sepsis Therapeutics Industry Volume (K Unit) Forecast, by Application 2019 & 2032
- Table 91: Global Sepsis Therapeutics Industry Revenue Million Forecast, by Drug Class 2019 & 2032
- Table 92: Global Sepsis Therapeutics Industry Volume K Unit Forecast, by Drug Class 2019 & 2032
- Table 93: Global Sepsis Therapeutics Industry Revenue Million Forecast, by Route of Administration 2019 & 2032
- Table 94: Global Sepsis Therapeutics Industry Volume K Unit Forecast, by Route of Administration 2019 & 2032
- Table 95: Global Sepsis Therapeutics Industry Revenue Million Forecast, by Country 2019 & 2032
- Table 96: Global Sepsis Therapeutics Industry Volume K Unit Forecast, by Country 2019 & 2032
- Table 97: China Sepsis Therapeutics Industry Revenue (Million) Forecast, by Application 2019 & 2032
- Table 98: China Sepsis Therapeutics Industry Volume (K Unit) Forecast, by Application 2019 & 2032
- Table 99: Japan Sepsis Therapeutics Industry Revenue (Million) Forecast, by Application 2019 & 2032
- Table 100: Japan Sepsis Therapeutics Industry Volume (K Unit) Forecast, by Application 2019 & 2032
- Table 101: India Sepsis Therapeutics Industry Revenue (Million) Forecast, by Application 2019 & 2032
- Table 102: India Sepsis Therapeutics Industry Volume (K Unit) Forecast, by Application 2019 & 2032
- Table 103: Australia Sepsis Therapeutics Industry Revenue (Million) Forecast, by Application 2019 & 2032
- Table 104: Australia Sepsis Therapeutics Industry Volume (K Unit) Forecast, by Application 2019 & 2032
- Table 105: South Korea Sepsis Therapeutics Industry Revenue (Million) Forecast, by Application 2019 & 2032
- Table 106: South Korea Sepsis Therapeutics Industry Volume (K Unit) Forecast, by Application 2019 & 2032
- Table 107: Rest of Asia Pacific Sepsis Therapeutics Industry Revenue (Million) Forecast, by Application 2019 & 2032
- Table 108: Rest of Asia Pacific Sepsis Therapeutics Industry Volume (K Unit) Forecast, by Application 2019 & 2032
- Table 109: Global Sepsis Therapeutics Industry Revenue Million Forecast, by Drug Class 2019 & 2032
- Table 110: Global Sepsis Therapeutics Industry Volume K Unit Forecast, by Drug Class 2019 & 2032
- Table 111: Global Sepsis Therapeutics Industry Revenue Million Forecast, by Route of Administration 2019 & 2032
- Table 112: Global Sepsis Therapeutics Industry Volume K Unit Forecast, by Route of Administration 2019 & 2032
- Table 113: Global Sepsis Therapeutics Industry Revenue Million Forecast, by Country 2019 & 2032
- Table 114: Global Sepsis Therapeutics Industry Volume K Unit Forecast, by Country 2019 & 2032
- Table 115: GCC Sepsis Therapeutics Industry Revenue (Million) Forecast, by Application 2019 & 2032
- Table 116: GCC Sepsis Therapeutics Industry Volume (K Unit) Forecast, by Application 2019 & 2032
- Table 117: South Africa Sepsis Therapeutics Industry Revenue (Million) Forecast, by Application 2019 & 2032
- Table 118: South Africa Sepsis Therapeutics Industry Volume (K Unit) Forecast, by Application 2019 & 2032
- Table 119: Rest of Middle East and Africa Sepsis Therapeutics Industry Revenue (Million) Forecast, by Application 2019 & 2032
- Table 120: Rest of Middle East and Africa Sepsis Therapeutics Industry Volume (K Unit) Forecast, by Application 2019 & 2032
- Table 121: Global Sepsis Therapeutics Industry Revenue Million Forecast, by Drug Class 2019 & 2032
- Table 122: Global Sepsis Therapeutics Industry Volume K Unit Forecast, by Drug Class 2019 & 2032
- Table 123: Global Sepsis Therapeutics Industry Revenue Million Forecast, by Route of Administration 2019 & 2032
- Table 124: Global Sepsis Therapeutics Industry Volume K Unit Forecast, by Route of Administration 2019 & 2032
- Table 125: Global Sepsis Therapeutics Industry Revenue Million Forecast, by Country 2019 & 2032
- Table 126: Global Sepsis Therapeutics Industry Volume K Unit Forecast, by Country 2019 & 2032
- Table 127: Brazil Sepsis Therapeutics Industry Revenue (Million) Forecast, by Application 2019 & 2032
- Table 128: Brazil Sepsis Therapeutics Industry Volume (K Unit) Forecast, by Application 2019 & 2032
- Table 129: Argentina Sepsis Therapeutics Industry Revenue (Million) Forecast, by Application 2019 & 2032
- Table 130: Argentina Sepsis Therapeutics Industry Volume (K Unit) Forecast, by Application 2019 & 2032
- Table 131: Rest of South America Sepsis Therapeutics Industry Revenue (Million) Forecast, by Application 2019 & 2032
- Table 132: Rest of South America Sepsis Therapeutics Industry Volume (K Unit) Forecast, by Application 2019 & 2032
Frequently Asked Questions
1. What is the projected Compound Annual Growth Rate (CAGR) of the Sepsis Therapeutics Industry?
The projected CAGR is approximately 7.60%.
2. Which companies are prominent players in the Sepsis Therapeutics Industry?
Key companies in the market include RegeneRx, Asahi Kasei Corporation, F Hoffmann-La Roche Ltd, Endacea Inc, Viatris Inc (Mylan Inc ), GSK Plc, Inotrem SA, Adrenomed AG, AbbVie Inc (Allergan Pharmaceuticals Private Limited), Pfizer Inc.
3. What are the main segments of the Sepsis Therapeutics Industry?
The market segments include Drug Class, Route of Administration.
4. Can you provide details about the market size?
The market size is estimated to be USD XX Million as of 2022.
5. What are some drivers contributing to market growth?
Increasing Incidence of Sepsis; High Prevalence of Sepsis in Infants; Rise in the Number of Pipeline Products and Upsurge in Research and Development Expenditures.
6. What are the notable trends driving market growth?
Cephalosporins Are Expected To Witness Growth Over The Forecast Period.
7. Are there any restraints impacting market growth?
Lack of Initial Diagnostic Test for identifying Sepsis Conditions and Lack of Awareness.
8. Can you provide examples of recent developments in the market?
In May 2022, Phathom Pharmaceuticals, Inc. received the United States Food and Drug Administration (FDA) approval for VOQUEZNA TRIPLE PAK (vonoprazan tablets, amoxicillin capsules, clarithromycin tablets) and VOQUEZNA DUAL PAK (vonoprazan tablets, amoxicillin capsules), for the treatment of Helicobacter pylori (H. pylori) infection in adults. The two New Drug Applications for these products were previously granted as qualified infectious disease products (QIDP).
9. What pricing options are available for accessing the report?
Pricing options include single-user, multi-user, and enterprise licenses priced at USD 4750, USD 5250, and USD 8750 respectively.
10. Is the market size provided in terms of value or volume?
The market size is provided in terms of value, measured in Million and volume, measured in K Unit.
11. Are there any specific market keywords associated with the report?
Yes, the market keyword associated with the report is "Sepsis Therapeutics Industry," which aids in identifying and referencing the specific market segment covered.
12. How do I determine which pricing option suits my needs best?
The pricing options vary based on user requirements and access needs. Individual users may opt for single-user licenses, while businesses requiring broader access may choose multi-user or enterprise licenses for cost-effective access to the report.
13. Are there any additional resources or data provided in the Sepsis Therapeutics Industry report?
While the report offers comprehensive insights, it's advisable to review the specific contents or supplementary materials provided to ascertain if additional resources or data are available.
14. How can I stay updated on further developments or reports in the Sepsis Therapeutics Industry?
To stay informed about further developments, trends, and reports in the Sepsis Therapeutics Industry, consider subscribing to industry newsletters, following relevant companies and organizations, or regularly checking reputable industry news sources and publications.
Methodology
Step 1 - Identification of Relevant Samples Size from Population Database


Step 2 - Approaches for Defining Global Market Size (Value, Volume* & Price*)

Note*: In applicable scenarios
Step 3 - Data Sources
Primary Research
- Web Analytics
- Survey Reports
- Research Institute
- Latest Research Reports
- Opinion Leaders
Secondary Research
- Annual Reports
- White Paper
- Latest Press Release
- Industry Association
- Paid Database
- Investor Presentations

Step 4 - Data Triangulation
Involves using different sources of information in order to increase the validity of a study
These sources are likely to be stakeholders in a program - participants, other researchers, program staff, other community members, and so on.
Then we put all data in single framework & apply various statistical tools to find out the dynamic on the market.
During the analysis stage, feedback from the stakeholder groups would be compared to determine areas of agreement as well as areas of divergence
