

Key Insights
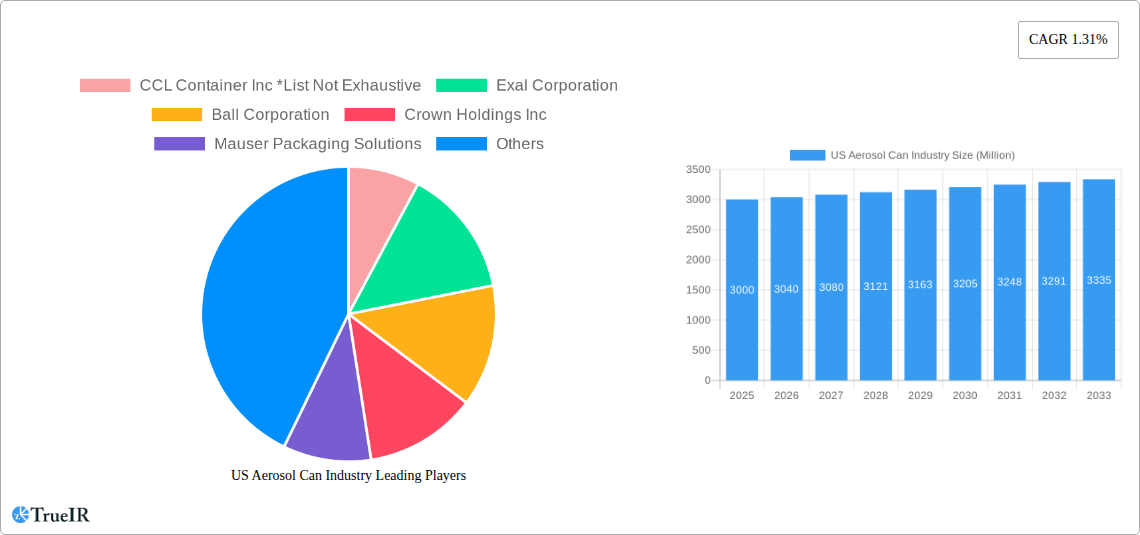
The US aerosol can market, valued at approximately $3 billion in 2025, is projected to experience steady growth, driven primarily by the increasing demand from the cosmetic and personal care, and household sectors. A compound annual growth rate (CAGR) of 1.31% from 2025 to 2033 suggests a gradual but consistent expansion. This growth is fueled by evolving consumer preferences towards convenient and user-friendly packaging solutions, particularly in the personal care sector where aerosols offer precise application and hygiene. Furthermore, innovations in sustainable materials, such as the exploration of recycled aluminum and alternative propellants, are likely to influence market dynamics in the coming years. While potential regulatory changes regarding certain aerosol propellants could pose a restraint, the overall market outlook remains positive, driven by the continued reliance on aerosol packaging across various industries.
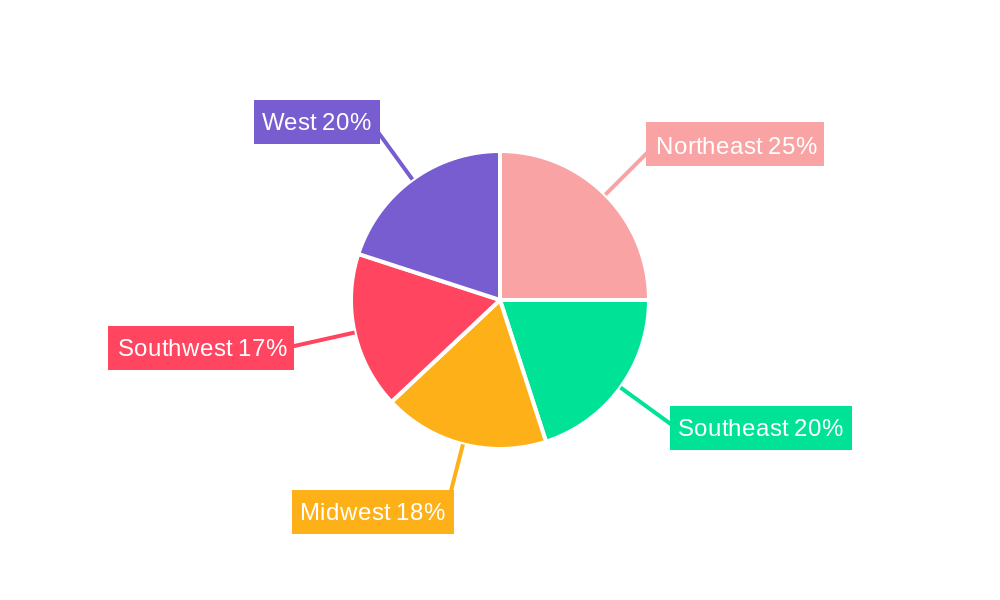
However, competitive pressures among major players like CCL Container Inc., Exal Corporation, Ball Corporation, Crown Holdings Inc., and Mauser Packaging Solutions will likely influence pricing and innovation strategies. The segmentation within the market, with aluminum cans maintaining a significant share due to its recyclability and performance, will continue to evolve as alternative materials gain traction. Regional variations in demand are anticipated, with the Northeast and West regions likely to show robust growth due to higher population density and consumer spending. The pharmaceutical/veterinary and automotive/industrial segments are expected to exhibit moderate growth, driven by specialized aerosol applications. The forecast period (2025-2033) will see continued consolidation within the industry, with larger players likely expanding their market share through strategic acquisitions and technological advancements.
US Aerosol Can Industry: A Comprehensive Market Report (2019-2033)
This in-depth report provides a comprehensive analysis of the US aerosol can industry, offering valuable insights into market size, trends, competitive dynamics, and future growth prospects. The report covers the period from 2019 to 2033, with a focus on the base year 2025 and a forecast period from 2025 to 2033. It leverages extensive data and qualitative analysis to provide a clear understanding of this dynamic market, essential for strategic decision-making by industry stakeholders. The market is estimated at $XX Million in 2025.
US Aerosol Can Industry Market Structure & Competitive Landscape
The US aerosol can industry exhibits a moderately concentrated market structure. Key players such as CCL Container Inc, Exal Corporation, Ball Corporation, Crown Holdings Inc, and Mauser Packaging Solutions hold significant market share, though a number of smaller regional players also compete. The industry is characterized by ongoing innovation, driven by demand for lighter, more sustainable packaging materials and improved manufacturing processes. Regulatory pressures related to environmental concerns and material safety are significant, impacting product design and material selection. Product substitutes, such as pouches and other dispensing systems, present competitive challenges, though the aerosol can retains its strong position due to its convenience and cost-effectiveness for various applications. Market concentration ratios (e.g., CR4, CR8) will be analyzed, along with M&A activity volume and value in the report. End-user segmentation is crucial, with significant differences across cosmetic & personal care, household, pharmaceutical/veterinary, paints and varnishes, automotive/industrial, and other end-users, influencing packaging needs and preferences.
US Aerosol Can Industry Market Trends & Opportunities
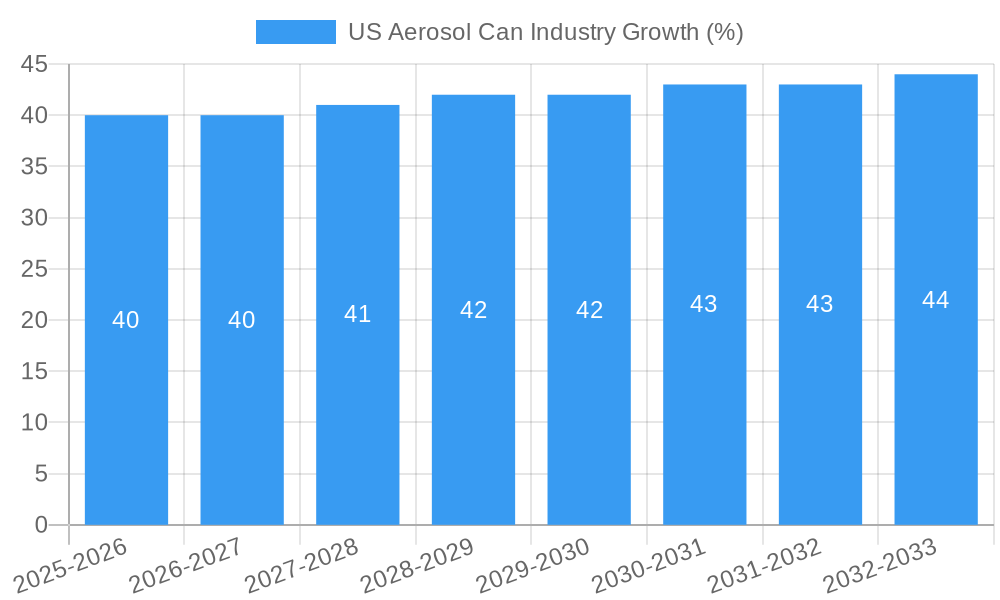
The US aerosol can market is experiencing steady growth driven by diverse factors. The report will detail the Compound Annual Growth Rate (CAGR) for the forecast period (2025-2033), highlighting expansion across various end-user segments. Technological advancements, particularly in materials science and manufacturing techniques, are leading to lighter, more sustainable, and more functional aerosol cans. Changing consumer preferences towards eco-friendly and recyclable products present both challenges and opportunities. Competitive dynamics are shaped by pricing pressures, innovation cycles, and strategic partnerships. Market penetration rates will be analyzed for different product types and end-user segments, providing valuable insights into market saturation and future expansion potential.
Dominant Markets & Segments in US Aerosol Can Industry
The report identifies the leading segments and regions within the US aerosol can market. Analysis will focus on the product type segmentation (Aluminum, Steel-Tinplate, Other Materials) and end-user segmentation (Cosmetic and Personal Care, Household, Pharmaceutical/Veterinary, Paints and Varnishes, Automotive/Industrial, Other End Users). Dominant segments will be identified through in-depth market share analysis, highlighting key regional differences.
- Key Growth Drivers (Examples):
- Increasing demand for convenience packaging in specific end-user sectors
- Advancements in material technology improving product performance and sustainability.
- Favorable regulatory environment promoting eco-friendly packaging.
US Aerosol Can Industry Product Analysis
Technological advancements are driving the evolution of aerosol cans, with a focus on improved functionality, sustainability, and reduced environmental impact. Innovations in materials (e.g., lighter-weight aluminum alloys, recyclable polymers) and manufacturing processes (e.g., improved coatings, reduced energy consumption) are key aspects of product evolution. These advancements offer competitive advantages, enhancing market fit and differentiation for manufacturers. The report analyzes the various applications of aerosol cans, emphasizing the unique attributes of each product type.
Key Drivers, Barriers & Challenges in US Aerosol Can Industry
Key Drivers: Technological innovations focusing on lighter-weight and sustainable materials are driving market growth. Economic factors like increasing disposable incomes in certain segments also support market expansion. Favorable regulatory policies, potentially promoting recyclable materials, create additional momentum.
Challenges: Supply chain disruptions, potentially impacting material availability and production costs, pose a significant challenge. Stringent environmental regulations can lead to increased compliance costs and limit product innovation. Intense competition among manufacturers creates pricing pressure, impacting profitability.
Growth Drivers in the US Aerosol Can Industry Market
Technological advancements, primarily in materials science and manufacturing, are leading to more sustainable and efficient aerosol cans. Economic factors, such as growth in relevant end-user sectors, also fuel market expansion. Changes in consumer preferences toward eco-friendly packaging solutions are driving innovation.
Challenges Impacting US Aerosol Can Industry Growth
Regulatory complexities, particularly concerning material safety and environmental compliance, represent significant hurdles. Supply chain disruptions and price volatility of raw materials are impacting production costs and overall market dynamics. Intense competition, particularly from alternative packaging solutions, is placing downward pressure on pricing and profitability.
Key Players Shaping the US Aerosol Can Industry Market
- CCL Container Inc
- Exal Corporation
- Ball Corporation
- Crown Holdings Inc
- Mauser Packaging Solutions
Significant US Aerosol Can Industry Milestones
- 2021: Introduction of a new, fully recyclable aerosol can material by a major manufacturer.
- 2022: Major merger between two industry players, leading to increased market consolidation.
- 2023: New regulations impacting material composition and labeling come into effect.
Future Outlook for US Aerosol Can Industry Market
The US aerosol can market is poised for continued growth, driven by innovation in sustainable materials and increased demand across key end-user segments. Strategic partnerships and acquisitions will likely shape the competitive landscape. The expanding focus on eco-friendly and recyclable packaging represents a significant growth opportunity, demanding innovation and adaptation within the industry. The market anticipates significant expansion in the forecast period (2025-2033).
US Aerosol Can Industry Segmentation
-
1. Product type
- 1.1. Aluminum
- 1.2. Steel-Tinplate
- 1.3. Other Materials
-
2. End-User
- 2.1. Cosmetic and Personal Care
- 2.2. Household
- 2.3. Pharmaceutical/Veterinary
- 2.4. Paints and Varnishes
- 2.5. Automotive/Industrial
- 2.6. Other End Users
US Aerosol Can Industry Segmentation By Geography
-
1. North America
- 1.1. United States
- 1.2. Canada
- 1.3. Mexico
-
2. South America
- 2.1. Brazil
- 2.2. Argentina
- 2.3. Rest of South America
-
3. Europe
- 3.1. United Kingdom
- 3.2. Germany
- 3.3. France
- 3.4. Italy
- 3.5. Spain
- 3.6. Russia
- 3.7. Benelux
- 3.8. Nordics
- 3.9. Rest of Europe
-
4. Middle East & Africa
- 4.1. Turkey
- 4.2. Israel
- 4.3. GCC
- 4.4. North Africa
- 4.5. South Africa
- 4.6. Rest of Middle East & Africa
-
5. Asia Pacific
- 5.1. China
- 5.2. India
- 5.3. Japan
- 5.4. South Korea
- 5.5. ASEAN
- 5.6. Oceania
- 5.7. Rest of Asia Pacific
US Aerosol Can Industry REPORT HIGHLIGHTS
| Aspects | Details |
|---|---|
| Study Period | 2019-2033 |
| Base Year | 2024 |
| Estimated Year | 2025 |
| Forecast Period | 2025-2033 |
| Historical Period | 2019-2024 |
| Growth Rate | CAGR of 1.31% from 2019-2033 |
| Segmentation |
|
Table of Contents
- 1. Introduction
- 1.1. Research Scope
- 1.2. Market Segmentation
- 1.3. Research Methodology
- 1.4. Definitions and Assumptions
- 2. Executive Summary
- 2.1. Introduction
- 3. Market Dynamics
- 3.1. Introduction
- 3.2. Market Drivers
- 3.2.1. ; Growing Demand from the Cosmetic Industry
- 3.3. Market Restrains
- 3.3.1. ; Increasing Competition from Substitute Packaging
- 3.4. Market Trends
- 3.4.1. Aluminum Cans to Register Highest Growth
- 4. Market Factor Analysis
- 4.1. Porters Five Forces
- 4.2. Supply/Value Chain
- 4.3. PESTEL analysis
- 4.4. Market Entropy
- 4.5. Patent/Trademark Analysis
- 5. Global US Aerosol Can Industry Analysis, Insights and Forecast, 2019-2031
- 5.1. Market Analysis, Insights and Forecast - by Product type
- 5.1.1. Aluminum
- 5.1.2. Steel-Tinplate
- 5.1.3. Other Materials
- 5.2. Market Analysis, Insights and Forecast - by End-User
- 5.2.1. Cosmetic and Personal Care
- 5.2.2. Household
- 5.2.3. Pharmaceutical/Veterinary
- 5.2.4. Paints and Varnishes
- 5.2.5. Automotive/Industrial
- 5.2.6. Other End Users
- 5.3. Market Analysis, Insights and Forecast - by Region
- 5.3.1. North America
- 5.3.2. South America
- 5.3.3. Europe
- 5.3.4. Middle East & Africa
- 5.3.5. Asia Pacific
- 5.1. Market Analysis, Insights and Forecast - by Product type
- 6. North America US Aerosol Can Industry Analysis, Insights and Forecast, 2019-2031
- 6.1. Market Analysis, Insights and Forecast - by Product type
- 6.1.1. Aluminum
- 6.1.2. Steel-Tinplate
- 6.1.3. Other Materials
- 6.2. Market Analysis, Insights and Forecast - by End-User
- 6.2.1. Cosmetic and Personal Care
- 6.2.2. Household
- 6.2.3. Pharmaceutical/Veterinary
- 6.2.4. Paints and Varnishes
- 6.2.5. Automotive/Industrial
- 6.2.6. Other End Users
- 6.1. Market Analysis, Insights and Forecast - by Product type
- 7. South America US Aerosol Can Industry Analysis, Insights and Forecast, 2019-2031
- 7.1. Market Analysis, Insights and Forecast - by Product type
- 7.1.1. Aluminum
- 7.1.2. Steel-Tinplate
- 7.1.3. Other Materials
- 7.2. Market Analysis, Insights and Forecast - by End-User
- 7.2.1. Cosmetic and Personal Care
- 7.2.2. Household
- 7.2.3. Pharmaceutical/Veterinary
- 7.2.4. Paints and Varnishes
- 7.2.5. Automotive/Industrial
- 7.2.6. Other End Users
- 7.1. Market Analysis, Insights and Forecast - by Product type
- 8. Europe US Aerosol Can Industry Analysis, Insights and Forecast, 2019-2031
- 8.1. Market Analysis, Insights and Forecast - by Product type
- 8.1.1. Aluminum
- 8.1.2. Steel-Tinplate
- 8.1.3. Other Materials
- 8.2. Market Analysis, Insights and Forecast - by End-User
- 8.2.1. Cosmetic and Personal Care
- 8.2.2. Household
- 8.2.3. Pharmaceutical/Veterinary
- 8.2.4. Paints and Varnishes
- 8.2.5. Automotive/Industrial
- 8.2.6. Other End Users
- 8.1. Market Analysis, Insights and Forecast - by Product type
- 9. Middle East & Africa US Aerosol Can Industry Analysis, Insights and Forecast, 2019-2031
- 9.1. Market Analysis, Insights and Forecast - by Product type
- 9.1.1. Aluminum
- 9.1.2. Steel-Tinplate
- 9.1.3. Other Materials
- 9.2. Market Analysis, Insights and Forecast - by End-User
- 9.2.1. Cosmetic and Personal Care
- 9.2.2. Household
- 9.2.3. Pharmaceutical/Veterinary
- 9.2.4. Paints and Varnishes
- 9.2.5. Automotive/Industrial
- 9.2.6. Other End Users
- 9.1. Market Analysis, Insights and Forecast - by Product type
- 10. Asia Pacific US Aerosol Can Industry Analysis, Insights and Forecast, 2019-2031
- 10.1. Market Analysis, Insights and Forecast - by Product type
- 10.1.1. Aluminum
- 10.1.2. Steel-Tinplate
- 10.1.3. Other Materials
- 10.2. Market Analysis, Insights and Forecast - by End-User
- 10.2.1. Cosmetic and Personal Care
- 10.2.2. Household
- 10.2.3. Pharmaceutical/Veterinary
- 10.2.4. Paints and Varnishes
- 10.2.5. Automotive/Industrial
- 10.2.6. Other End Users
- 10.1. Market Analysis, Insights and Forecast - by Product type
- 11. Northeast US Aerosol Can Industry Analysis, Insights and Forecast, 2019-2031
- 12. Southeast US Aerosol Can Industry Analysis, Insights and Forecast, 2019-2031
- 13. Midwest US Aerosol Can Industry Analysis, Insights and Forecast, 2019-2031
- 14. Southwest US Aerosol Can Industry Analysis, Insights and Forecast, 2019-2031
- 15. West US Aerosol Can Industry Analysis, Insights and Forecast, 2019-2031
- 16. Competitive Analysis
- 16.1. Global Market Share Analysis 2024
- 16.2. Company Profiles
- 16.2.1 CCL Container Inc *List Not Exhaustive
- 16.2.1.1. Overview
- 16.2.1.2. Products
- 16.2.1.3. SWOT Analysis
- 16.2.1.4. Recent Developments
- 16.2.1.5. Financials (Based on Availability)
- 16.2.2 Exal Corporation
- 16.2.2.1. Overview
- 16.2.2.2. Products
- 16.2.2.3. SWOT Analysis
- 16.2.2.4. Recent Developments
- 16.2.2.5. Financials (Based on Availability)
- 16.2.3 Ball Corporation
- 16.2.3.1. Overview
- 16.2.3.2. Products
- 16.2.3.3. SWOT Analysis
- 16.2.3.4. Recent Developments
- 16.2.3.5. Financials (Based on Availability)
- 16.2.4 Crown Holdings Inc
- 16.2.4.1. Overview
- 16.2.4.2. Products
- 16.2.4.3. SWOT Analysis
- 16.2.4.4. Recent Developments
- 16.2.4.5. Financials (Based on Availability)
- 16.2.5 Mauser Packaging Solutions
- 16.2.5.1. Overview
- 16.2.5.2. Products
- 16.2.5.3. SWOT Analysis
- 16.2.5.4. Recent Developments
- 16.2.5.5. Financials (Based on Availability)
- 16.2.1 CCL Container Inc *List Not Exhaustive
List of Figures
- Figure 1: Global US Aerosol Can Industry Revenue Breakdown (Million, %) by Region 2024 & 2032
- Figure 2: United states US Aerosol Can Industry Revenue (Million), by Country 2024 & 2032
- Figure 3: United states US Aerosol Can Industry Revenue Share (%), by Country 2024 & 2032
- Figure 4: North America US Aerosol Can Industry Revenue (Million), by Product type 2024 & 2032
- Figure 5: North America US Aerosol Can Industry Revenue Share (%), by Product type 2024 & 2032
- Figure 6: North America US Aerosol Can Industry Revenue (Million), by End-User 2024 & 2032
- Figure 7: North America US Aerosol Can Industry Revenue Share (%), by End-User 2024 & 2032
- Figure 8: North America US Aerosol Can Industry Revenue (Million), by Country 2024 & 2032
- Figure 9: North America US Aerosol Can Industry Revenue Share (%), by Country 2024 & 2032
- Figure 10: South America US Aerosol Can Industry Revenue (Million), by Product type 2024 & 2032
- Figure 11: South America US Aerosol Can Industry Revenue Share (%), by Product type 2024 & 2032
- Figure 12: South America US Aerosol Can Industry Revenue (Million), by End-User 2024 & 2032
- Figure 13: South America US Aerosol Can Industry Revenue Share (%), by End-User 2024 & 2032
- Figure 14: South America US Aerosol Can Industry Revenue (Million), by Country 2024 & 2032
- Figure 15: South America US Aerosol Can Industry Revenue Share (%), by Country 2024 & 2032
- Figure 16: Europe US Aerosol Can Industry Revenue (Million), by Product type 2024 & 2032
- Figure 17: Europe US Aerosol Can Industry Revenue Share (%), by Product type 2024 & 2032
- Figure 18: Europe US Aerosol Can Industry Revenue (Million), by End-User 2024 & 2032
- Figure 19: Europe US Aerosol Can Industry Revenue Share (%), by End-User 2024 & 2032
- Figure 20: Europe US Aerosol Can Industry Revenue (Million), by Country 2024 & 2032
- Figure 21: Europe US Aerosol Can Industry Revenue Share (%), by Country 2024 & 2032
- Figure 22: Middle East & Africa US Aerosol Can Industry Revenue (Million), by Product type 2024 & 2032
- Figure 23: Middle East & Africa US Aerosol Can Industry Revenue Share (%), by Product type 2024 & 2032
- Figure 24: Middle East & Africa US Aerosol Can Industry Revenue (Million), by End-User 2024 & 2032
- Figure 25: Middle East & Africa US Aerosol Can Industry Revenue Share (%), by End-User 2024 & 2032
- Figure 26: Middle East & Africa US Aerosol Can Industry Revenue (Million), by Country 2024 & 2032
- Figure 27: Middle East & Africa US Aerosol Can Industry Revenue Share (%), by Country 2024 & 2032
- Figure 28: Asia Pacific US Aerosol Can Industry Revenue (Million), by Product type 2024 & 2032
- Figure 29: Asia Pacific US Aerosol Can Industry Revenue Share (%), by Product type 2024 & 2032
- Figure 30: Asia Pacific US Aerosol Can Industry Revenue (Million), by End-User 2024 & 2032
- Figure 31: Asia Pacific US Aerosol Can Industry Revenue Share (%), by End-User 2024 & 2032
- Figure 32: Asia Pacific US Aerosol Can Industry Revenue (Million), by Country 2024 & 2032
- Figure 33: Asia Pacific US Aerosol Can Industry Revenue Share (%), by Country 2024 & 2032
List of Tables
- Table 1: Global US Aerosol Can Industry Revenue Million Forecast, by Region 2019 & 2032
- Table 2: Global US Aerosol Can Industry Revenue Million Forecast, by Product type 2019 & 2032
- Table 3: Global US Aerosol Can Industry Revenue Million Forecast, by End-User 2019 & 2032
- Table 4: Global US Aerosol Can Industry Revenue Million Forecast, by Region 2019 & 2032
- Table 5: Global US Aerosol Can Industry Revenue Million Forecast, by Country 2019 & 2032
- Table 6: Northeast US Aerosol Can Industry Revenue (Million) Forecast, by Application 2019 & 2032
- Table 7: Southeast US Aerosol Can Industry Revenue (Million) Forecast, by Application 2019 & 2032
- Table 8: Midwest US Aerosol Can Industry Revenue (Million) Forecast, by Application 2019 & 2032
- Table 9: Southwest US Aerosol Can Industry Revenue (Million) Forecast, by Application 2019 & 2032
- Table 10: West US Aerosol Can Industry Revenue (Million) Forecast, by Application 2019 & 2032
- Table 11: Global US Aerosol Can Industry Revenue Million Forecast, by Product type 2019 & 2032
- Table 12: Global US Aerosol Can Industry Revenue Million Forecast, by End-User 2019 & 2032
- Table 13: Global US Aerosol Can Industry Revenue Million Forecast, by Country 2019 & 2032
- Table 14: United States US Aerosol Can Industry Revenue (Million) Forecast, by Application 2019 & 2032
- Table 15: Canada US Aerosol Can Industry Revenue (Million) Forecast, by Application 2019 & 2032
- Table 16: Mexico US Aerosol Can Industry Revenue (Million) Forecast, by Application 2019 & 2032
- Table 17: Global US Aerosol Can Industry Revenue Million Forecast, by Product type 2019 & 2032
- Table 18: Global US Aerosol Can Industry Revenue Million Forecast, by End-User 2019 & 2032
- Table 19: Global US Aerosol Can Industry Revenue Million Forecast, by Country 2019 & 2032
- Table 20: Brazil US Aerosol Can Industry Revenue (Million) Forecast, by Application 2019 & 2032
- Table 21: Argentina US Aerosol Can Industry Revenue (Million) Forecast, by Application 2019 & 2032
- Table 22: Rest of South America US Aerosol Can Industry Revenue (Million) Forecast, by Application 2019 & 2032
- Table 23: Global US Aerosol Can Industry Revenue Million Forecast, by Product type 2019 & 2032
- Table 24: Global US Aerosol Can Industry Revenue Million Forecast, by End-User 2019 & 2032
- Table 25: Global US Aerosol Can Industry Revenue Million Forecast, by Country 2019 & 2032
- Table 26: United Kingdom US Aerosol Can Industry Revenue (Million) Forecast, by Application 2019 & 2032
- Table 27: Germany US Aerosol Can Industry Revenue (Million) Forecast, by Application 2019 & 2032
- Table 28: France US Aerosol Can Industry Revenue (Million) Forecast, by Application 2019 & 2032
- Table 29: Italy US Aerosol Can Industry Revenue (Million) Forecast, by Application 2019 & 2032
- Table 30: Spain US Aerosol Can Industry Revenue (Million) Forecast, by Application 2019 & 2032
- Table 31: Russia US Aerosol Can Industry Revenue (Million) Forecast, by Application 2019 & 2032
- Table 32: Benelux US Aerosol Can Industry Revenue (Million) Forecast, by Application 2019 & 2032
- Table 33: Nordics US Aerosol Can Industry Revenue (Million) Forecast, by Application 2019 & 2032
- Table 34: Rest of Europe US Aerosol Can Industry Revenue (Million) Forecast, by Application 2019 & 2032
- Table 35: Global US Aerosol Can Industry Revenue Million Forecast, by Product type 2019 & 2032
- Table 36: Global US Aerosol Can Industry Revenue Million Forecast, by End-User 2019 & 2032
- Table 37: Global US Aerosol Can Industry Revenue Million Forecast, by Country 2019 & 2032
- Table 38: Turkey US Aerosol Can Industry Revenue (Million) Forecast, by Application 2019 & 2032
- Table 39: Israel US Aerosol Can Industry Revenue (Million) Forecast, by Application 2019 & 2032
- Table 40: GCC US Aerosol Can Industry Revenue (Million) Forecast, by Application 2019 & 2032
- Table 41: North Africa US Aerosol Can Industry Revenue (Million) Forecast, by Application 2019 & 2032
- Table 42: South Africa US Aerosol Can Industry Revenue (Million) Forecast, by Application 2019 & 2032
- Table 43: Rest of Middle East & Africa US Aerosol Can Industry Revenue (Million) Forecast, by Application 2019 & 2032
- Table 44: Global US Aerosol Can Industry Revenue Million Forecast, by Product type 2019 & 2032
- Table 45: Global US Aerosol Can Industry Revenue Million Forecast, by End-User 2019 & 2032
- Table 46: Global US Aerosol Can Industry Revenue Million Forecast, by Country 2019 & 2032
- Table 47: China US Aerosol Can Industry Revenue (Million) Forecast, by Application 2019 & 2032
- Table 48: India US Aerosol Can Industry Revenue (Million) Forecast, by Application 2019 & 2032
- Table 49: Japan US Aerosol Can Industry Revenue (Million) Forecast, by Application 2019 & 2032
- Table 50: South Korea US Aerosol Can Industry Revenue (Million) Forecast, by Application 2019 & 2032
- Table 51: ASEAN US Aerosol Can Industry Revenue (Million) Forecast, by Application 2019 & 2032
- Table 52: Oceania US Aerosol Can Industry Revenue (Million) Forecast, by Application 2019 & 2032
- Table 53: Rest of Asia Pacific US Aerosol Can Industry Revenue (Million) Forecast, by Application 2019 & 2032
Frequently Asked Questions
1. What is the projected Compound Annual Growth Rate (CAGR) of the US Aerosol Can Industry?
The projected CAGR is approximately 1.31%.
2. Which companies are prominent players in the US Aerosol Can Industry?
Key companies in the market include CCL Container Inc *List Not Exhaustive, Exal Corporation, Ball Corporation, Crown Holdings Inc, Mauser Packaging Solutions.
3. What are the main segments of the US Aerosol Can Industry?
The market segments include Product type, End-User.
4. Can you provide details about the market size?
The market size is estimated to be USD XX Million as of 2022.
5. What are some drivers contributing to market growth?
; Growing Demand from the Cosmetic Industry.
6. What are the notable trends driving market growth?
Aluminum Cans to Register Highest Growth.
7. Are there any restraints impacting market growth?
; Increasing Competition from Substitute Packaging.
8. Can you provide examples of recent developments in the market?
N/A
9. What pricing options are available for accessing the report?
Pricing options include single-user, multi-user, and enterprise licenses priced at USD 3800, USD 4500, and USD 5800 respectively.
10. Is the market size provided in terms of value or volume?
The market size is provided in terms of value, measured in Million.
11. Are there any specific market keywords associated with the report?
Yes, the market keyword associated with the report is "US Aerosol Can Industry," which aids in identifying and referencing the specific market segment covered.
12. How do I determine which pricing option suits my needs best?
The pricing options vary based on user requirements and access needs. Individual users may opt for single-user licenses, while businesses requiring broader access may choose multi-user or enterprise licenses for cost-effective access to the report.
13. Are there any additional resources or data provided in the US Aerosol Can Industry report?
While the report offers comprehensive insights, it's advisable to review the specific contents or supplementary materials provided to ascertain if additional resources or data are available.
14. How can I stay updated on further developments or reports in the US Aerosol Can Industry?
To stay informed about further developments, trends, and reports in the US Aerosol Can Industry, consider subscribing to industry newsletters, following relevant companies and organizations, or regularly checking reputable industry news sources and publications.
Methodology
Step 1 - Identification of Relevant Samples Size from Population Database


Step 2 - Approaches for Defining Global Market Size (Value, Volume* & Price*)

Note*: In applicable scenarios
Step 3 - Data Sources
Primary Research
- Web Analytics
- Survey Reports
- Research Institute
- Latest Research Reports
- Opinion Leaders
Secondary Research
- Annual Reports
- White Paper
- Latest Press Release
- Industry Association
- Paid Database
- Investor Presentations

Step 4 - Data Triangulation
Involves using different sources of information in order to increase the validity of a study
These sources are likely to be stakeholders in a program - participants, other researchers, program staff, other community members, and so on.
Then we put all data in single framework & apply various statistical tools to find out the dynamic on the market.
During the analysis stage, feedback from the stakeholder groups would be compared to determine areas of agreement as well as areas of divergence
