

Key Insights
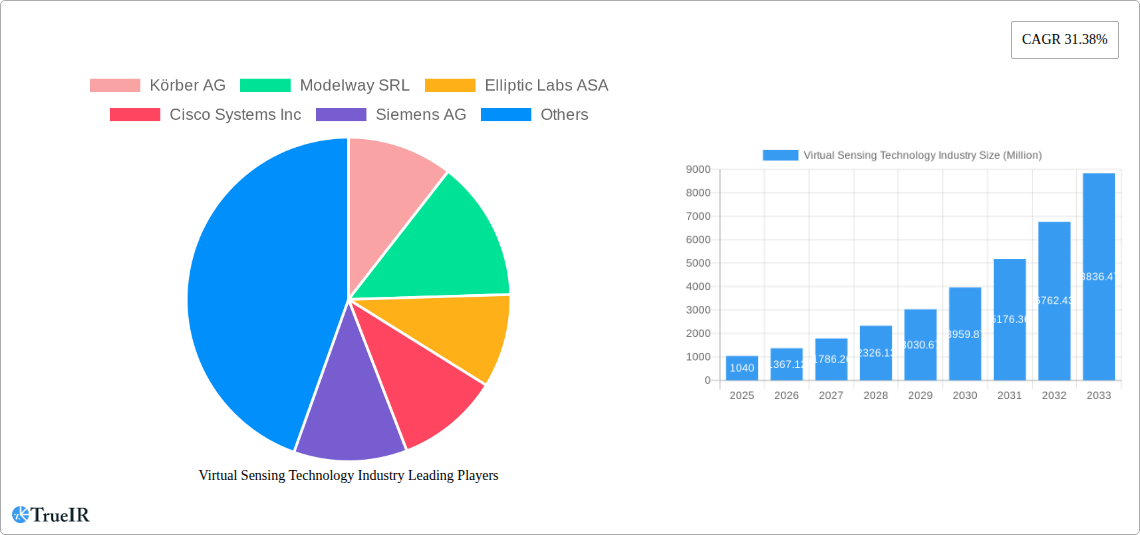
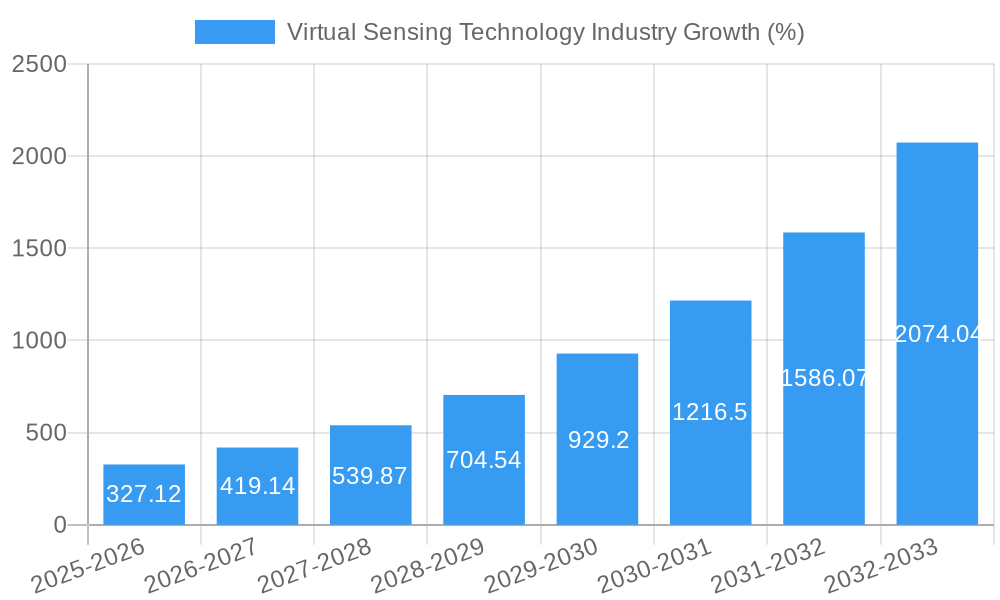
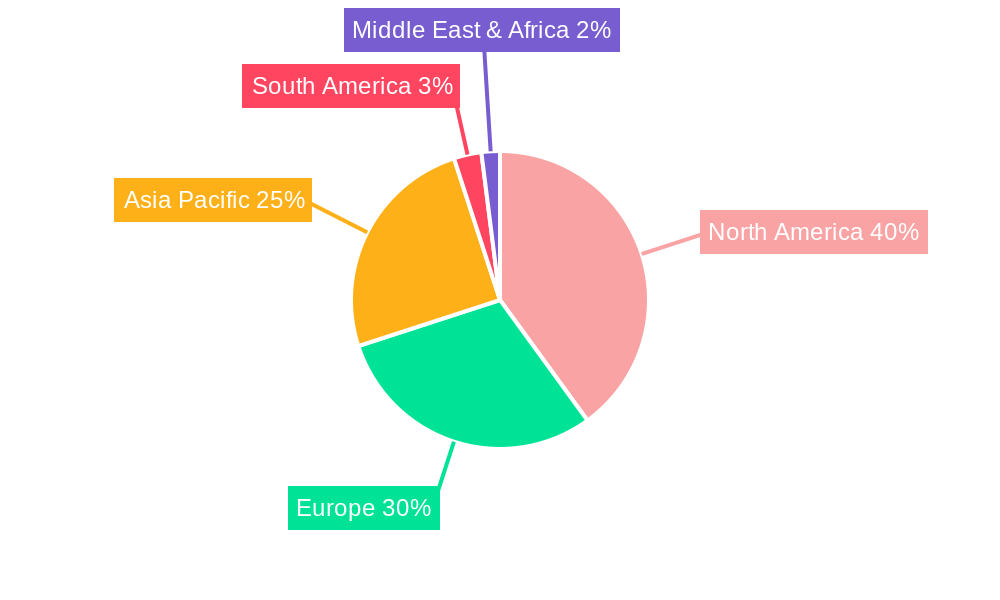
The Virtual Sensing Technology market is experiencing robust growth, projected to reach a value of $1.04 billion in 2025 and exhibiting a Compound Annual Growth Rate (CAGR) of 31.38% from 2025 to 2033. This expansion is fueled by several key drivers. The increasing adoption of smart devices in healthcare, manufacturing, and smart buildings is a significant factor, creating a substantial demand for virtual sensing solutions. Advanced sensor technologies, like those embedded in wearables and vehicles, are providing more accurate and real-time data, enabling predictive maintenance, improved operational efficiency, and enhanced safety measures across various industries. Furthermore, the growing need for remote monitoring and control, particularly within the healthcare sector, is driving market growth. The integration of virtual sensing with IoT (Internet of Things) and AI (Artificial Intelligence) further enhances its capabilities and appeal, enabling sophisticated data analysis and automation. While data security and privacy concerns represent a potential restraint, ongoing technological advancements and robust security protocols are mitigating these risks. The market is segmented by sensor type (wearable, vehicle, building), application (healthcare, manufacturing, smart buildings), and end-use industry (healthcare, manufacturing, transportation), offering diverse growth opportunities across various sectors. North America and Asia-Pacific, particularly the United States and China respectively, currently dominate the market share, due to the early adoption of advanced technologies and substantial investments in research and development. However, the European and other regional markets are anticipated to experience significant growth in the forecast period driven by increasing government support for digitalization initiatives and infrastructure development.
The competitive landscape is characterized by a mix of established players like Siemens AG, Schneider Electric SE, and General Electric Company, along with innovative smaller companies like Elliptic Labs ASA and Modelway SRL. These companies are constantly striving to innovate with new technologies, improve the accuracy and reliability of their products, and expand their market reach through strategic partnerships and acquisitions. The future growth of the virtual sensing technology market depends on continued innovation in sensor technology, the seamless integration of data analytics and AI capabilities, and the successful addressal of data security challenges. The sustained growth in related fields like IoT, AI and automation further suggests a promising outlook for this market. The rising demand for remote patient monitoring and the increasing focus on Industry 4.0 in the manufacturing sector will continue to be strong drivers for market expansion throughout the forecast period.
Virtual Sensing Technology Industry Market Report: 2019-2033
This comprehensive report provides a detailed analysis of the Virtual Sensing Technology industry, projecting a market value exceeding $XX Million by 2033. The study covers the period 2019-2033, with 2025 as the base and estimated year, and a forecast period of 2025-2033. This in-depth analysis leverages high-volume keywords to enhance discoverability and offer invaluable insights for industry professionals, investors, and strategic decision-makers.
Virtual Sensing Technology Industry Market Structure & Competitive Landscape
The Virtual Sensing Technology market exhibits a moderately concentrated structure, with several major players holding significant market share. The Herfindahl-Hirschman Index (HHI) is estimated at xx, indicating a competitive landscape. Key innovation drivers include advancements in AI, machine learning, and miniaturization of sensors. Regulatory impacts, particularly concerning data privacy and security, are increasingly shaping market dynamics. Product substitutes, such as traditional sensing technologies, pose a challenge, but virtual sensing offers advantages in cost, accuracy, and non-intrusiveness.
End-user segmentation is a crucial factor: Healthcare, manufacturing, and transportation sectors drive the majority of demand. M&A activity has been moderate in recent years, with xx acquisitions recorded between 2019 and 2024, primarily focused on consolidating technology and expanding market reach. Larger players such as Körber AG and Siemens AG are actively involved in strategic acquisitions to enhance their product portfolios and market positioning. The concentration ratio (CR4) stands at approximately xx%, signifying a dynamic competitive environment.
Virtual Sensing Technology Industry Market Trends & Opportunities
The Virtual Sensing Technology market is experiencing robust growth, with a projected Compound Annual Growth Rate (CAGR) of xx% during the forecast period. This growth is fueled by several factors: increasing adoption of IoT devices across various sectors, rising demand for enhanced safety and security systems, and the growing need for real-time data analytics. Market penetration rates remain relatively low compared to the total addressable market, signifying significant untapped potential. Technological advancements, particularly in AI-powered sensor fusion and edge computing, are transforming the industry landscape. Consumer preference is shifting towards seamless, contactless solutions, driving demand for virtual sensing technologies in sectors like healthcare and smart buildings. Increased integration of virtual sensors into existing infrastructure will continue to boost market adoption.
Dominant Markets & Segments in Virtual Sensing Technology Industry
The global Virtual Sensing Technology market is witnessing significant growth across various segments.
- Leading Region: North America currently dominates the market due to early adoption and technological advancements. Asia-Pacific is expected to witness the highest growth rate driven by rapid industrialization and infrastructure development.
- Leading Sensor Type: The wearable sensor segment currently leads, driven by the proliferation of smartwatches and fitness trackers. However, the vehicle sensor segment is expected to experience significant growth due to the increasing adoption of advanced driver-assistance systems (ADAS) and autonomous vehicles.
- Leading Application: The healthcare application segment is currently showing the fastest growth, driven by the need for remote patient monitoring and improved diagnostic capabilities. The manufacturing segment is also witnessing substantial growth, owing to the increasing demand for automation and efficiency improvements.
- Leading End-use Industry: The healthcare and manufacturing industries are currently the largest consumers of virtual sensing technologies. However, the transportation sector is projected to show strong growth in the coming years.
Key Growth Drivers:
- Robust government initiatives promoting technological innovation and digital transformation.
- Expanding smart city infrastructure initiatives across major economies.
- Increasing adoption of Industry 4.0 technologies and automation in manufacturing.
- Growing awareness about the benefits of virtual sensing technologies in various applications.
Virtual Sensing Technology Industry Product Analysis
Virtual sensing technology encompasses a wide range of products, from proximity sensors and gesture recognition systems to sophisticated AI-powered sensor fusion platforms. Innovations center on improving accuracy, reducing power consumption, and expanding functionalities. Competitive advantages are achieved through superior algorithms, patented technologies, and strong integration capabilities. The market increasingly emphasizes ease of integration, data security features, and high performance across various applications. The key is to offer solutions that seamlessly integrate into existing systems, minimizing disruption and maximizing efficiency.
Key Drivers, Barriers & Challenges in Virtual Sensing Technology Industry
Key Drivers:
- Advancements in AI and machine learning enabling more accurate and sophisticated sensor solutions.
- Increasing demand for contactless solutions across various sectors.
- Rising investments in IoT and smart infrastructure projects.
- Favorable government regulations and incentives supporting technological adoption.
Challenges:
- High initial investment costs for deploying virtual sensing solutions, hindering broader adoption, especially among SMEs.
- Data privacy and security concerns associated with the collection and processing of sensor data, requiring robust security measures.
- Interoperability issues across different sensor platforms, limiting seamless integration of systems.
- Intense competition from established players in the sensing and automation industries.
Growth Drivers in the Virtual Sensing Technology Industry Market
The market’s growth is fueled by technological advancements in AI, sensor miniaturization, and low-power consumption designs. Economic factors such as increasing automation in various industries and the demand for efficient solutions are also key drivers. Finally, government regulations and incentives pushing for digitalization and smart technologies bolster the market. The integration of virtual sensing technologies within Industry 4.0 initiatives further fuels the expansion.
Challenges Impacting Virtual Sensing Technology Industry Growth
Regulatory complexities surrounding data privacy and security pose significant barriers. Supply chain disruptions, especially concerning the availability of specialized components, can impact production and timely delivery. Intense competition, coupled with price pressures, create challenges for smaller players. The need for robust data security measures and skilled workforce to manage the data from virtual sensors also adds to the hurdles faced by the industry.
Key Players Shaping the Virtual Sensing Technology Industry Market
- Körber AG
- Modelway SRL
- Elliptic Labs ASA
- Cisco Systems Inc
- Siemens AG
- Schneider Electric SE
- Andata Lt
- Intelli Dynamics (Biocomp Systems Inc )
- General Electric Company
Significant Virtual Sensing Technology Industry Milestones
- March 2024: Elliptic Labs announced the deployment of over 500 million devices and the shipping of its AI Virtual Proximity Sensor INNER BEAUTY on the Lava Blaze Curve smartphone. This signifies a major breakthrough in the market adoption of AI-based virtual proximity sensors.
- February 2024: Capgemini and Unity's expanded strategic alliance, integrating Unity's Digital Twin Professional Services into Capgemini, will accelerate the development and deployment of real-time 3D visualization software for industrial digital twin applications. This collaboration highlights the growing importance of digital twins and virtual sensing in industrial applications.
Future Outlook for Virtual Sensing Technology Industry Market
The Virtual Sensing Technology market is poised for significant growth, driven by continued technological innovation, increasing demand across diverse sectors, and supportive government policies. Strategic opportunities lie in developing advanced sensor fusion technologies, enhancing data security measures, and expanding market penetration into emerging economies. The industry's potential is vast, promising substantial returns for companies capable of adapting to the rapidly evolving technological landscape and market demands.
Virtual Sensing Technology Industry Segmentation
-
1. Deployment Type
- 1.1. Cloud
- 1.2. On-premise
-
2. End-user Industry
- 2.1. Oil and Gas
- 2.2. Manufacturing
- 2.3. Transportation and Automotive
- 2.4. Metal and Mining
- 2.5. Aerospace and Defense
- 2.6. Electronics and Consumer Technologies
- 2.7. Other End User Industries
- 3. Market Segmentation and Target Audience
- 4. Value Proposition
- 5. Distribution Channel Strategies
- 6. Competitive Landscape
- 7. Addressing Market Challenges
- 8. Conclusion and Recommendations
Virtual Sensing Technology Industry Segmentation By Geography
-
1. North America
- 1.1. United States
- 1.2. Canada
-
2. Europe
- 2.1. United Kingdom
- 2.2. Germany
- 2.3. France
- 2.4. Italy
-
3. Asia
- 3.1. China
- 3.2. Japan
- 3.3. India
- 4. Australia and New Zealand
- 5. Latin America
- 6. Middle East and Africa
Virtual Sensing Technology Industry REPORT HIGHLIGHTS
| Aspects | Details |
|---|---|
| Study Period | 2019-2033 |
| Base Year | 2024 |
| Estimated Year | 2025 |
| Forecast Period | 2025-2033 |
| Historical Period | 2019-2024 |
| Growth Rate | CAGR of 31.38% from 2019-2033 |
| Segmentation |
|
Table of Contents
- 1. Introduction
- 1.1. Research Scope
- 1.2. Market Segmentation
- 1.3. Research Methodology
- 1.4. Definitions and Assumptions
- 2. Executive Summary
- 2.1. Introduction
- 3. Market Dynamics
- 3.1. Introduction
- 3.2. Market Drivers
- 3.2.1. Increasing Adoption of IoT and Cloud Platform Is Expected to Drive the Market; Growing Need For Enhanced Cost-effectiveness and Operational Efficiency in Manufacturing
- 3.3. Market Restrains
- 3.3.1. High Deployment and Maintenance Cost
- 3.4. Market Trends
- 3.4.1. Transportation and Automotive Industry to be the Fastest Growing End User
- 4. Market Factor Analysis
- 4.1. Porters Five Forces
- 4.2. Supply/Value Chain
- 4.3. PESTEL analysis
- 4.4. Market Entropy
- 4.5. Patent/Trademark Analysis
- 5. Global Virtual Sensing Technology Industry Analysis, Insights and Forecast, 2019-2031
- 5.1. Market Analysis, Insights and Forecast - by Deployment Type
- 5.1.1. Cloud
- 5.1.2. On-premise
- 5.2. Market Analysis, Insights and Forecast - by End-user Industry
- 5.2.1. Oil and Gas
- 5.2.2. Manufacturing
- 5.2.3. Transportation and Automotive
- 5.2.4. Metal and Mining
- 5.2.5. Aerospace and Defense
- 5.2.6. Electronics and Consumer Technologies
- 5.2.7. Other End User Industries
- 5.3. Market Analysis, Insights and Forecast - by Market Segmentation and Target Audience
- 5.4. Market Analysis, Insights and Forecast - by Value Proposition
- 5.5. Market Analysis, Insights and Forecast - by Distribution Channel Strategies
- 5.6. Market Analysis, Insights and Forecast - by Competitive Landscape
- 5.7. Market Analysis, Insights and Forecast - by Addressing Market Challenges
- 5.8. Market Analysis, Insights and Forecast - by Conclusion and Recommendations
- 5.9. Market Analysis, Insights and Forecast - by Region
- 5.9.1. North America
- 5.9.2. Europe
- 5.9.3. Asia
- 5.9.4. Australia and New Zealand
- 5.9.5. Latin America
- 5.9.6. Middle East and Africa
- 5.1. Market Analysis, Insights and Forecast - by Deployment Type
- 6. North America Virtual Sensing Technology Industry Analysis, Insights and Forecast, 2019-2031
- 6.1. Market Analysis, Insights and Forecast - by Deployment Type
- 6.1.1. Cloud
- 6.1.2. On-premise
- 6.2. Market Analysis, Insights and Forecast - by End-user Industry
- 6.2.1. Oil and Gas
- 6.2.2. Manufacturing
- 6.2.3. Transportation and Automotive
- 6.2.4. Metal and Mining
- 6.2.5. Aerospace and Defense
- 6.2.6. Electronics and Consumer Technologies
- 6.2.7. Other End User Industries
- 6.3. Market Analysis, Insights and Forecast - by Market Segmentation and Target Audience
- 6.4. Market Analysis, Insights and Forecast - by Value Proposition
- 6.5. Market Analysis, Insights and Forecast - by Distribution Channel Strategies
- 6.6. Market Analysis, Insights and Forecast - by Competitive Landscape
- 6.7. Market Analysis, Insights and Forecast - by Addressing Market Challenges
- 6.8. Market Analysis, Insights and Forecast - by Conclusion and Recommendations
- 6.1. Market Analysis, Insights and Forecast - by Deployment Type
- 7. Europe Virtual Sensing Technology Industry Analysis, Insights and Forecast, 2019-2031
- 7.1. Market Analysis, Insights and Forecast - by Deployment Type
- 7.1.1. Cloud
- 7.1.2. On-premise
- 7.2. Market Analysis, Insights and Forecast - by End-user Industry
- 7.2.1. Oil and Gas
- 7.2.2. Manufacturing
- 7.2.3. Transportation and Automotive
- 7.2.4. Metal and Mining
- 7.2.5. Aerospace and Defense
- 7.2.6. Electronics and Consumer Technologies
- 7.2.7. Other End User Industries
- 7.3. Market Analysis, Insights and Forecast - by Market Segmentation and Target Audience
- 7.4. Market Analysis, Insights and Forecast - by Value Proposition
- 7.5. Market Analysis, Insights and Forecast - by Distribution Channel Strategies
- 7.6. Market Analysis, Insights and Forecast - by Competitive Landscape
- 7.7. Market Analysis, Insights and Forecast - by Addressing Market Challenges
- 7.8. Market Analysis, Insights and Forecast - by Conclusion and Recommendations
- 7.1. Market Analysis, Insights and Forecast - by Deployment Type
- 8. Asia Virtual Sensing Technology Industry Analysis, Insights and Forecast, 2019-2031
- 8.1. Market Analysis, Insights and Forecast - by Deployment Type
- 8.1.1. Cloud
- 8.1.2. On-premise
- 8.2. Market Analysis, Insights and Forecast - by End-user Industry
- 8.2.1. Oil and Gas
- 8.2.2. Manufacturing
- 8.2.3. Transportation and Automotive
- 8.2.4. Metal and Mining
- 8.2.5. Aerospace and Defense
- 8.2.6. Electronics and Consumer Technologies
- 8.2.7. Other End User Industries
- 8.3. Market Analysis, Insights and Forecast - by Market Segmentation and Target Audience
- 8.4. Market Analysis, Insights and Forecast - by Value Proposition
- 8.5. Market Analysis, Insights and Forecast - by Distribution Channel Strategies
- 8.6. Market Analysis, Insights and Forecast - by Competitive Landscape
- 8.7. Market Analysis, Insights and Forecast - by Addressing Market Challenges
- 8.8. Market Analysis, Insights and Forecast - by Conclusion and Recommendations
- 8.1. Market Analysis, Insights and Forecast - by Deployment Type
- 9. Australia and New Zealand Virtual Sensing Technology Industry Analysis, Insights and Forecast, 2019-2031
- 9.1. Market Analysis, Insights and Forecast - by Deployment Type
- 9.1.1. Cloud
- 9.1.2. On-premise
- 9.2. Market Analysis, Insights and Forecast - by End-user Industry
- 9.2.1. Oil and Gas
- 9.2.2. Manufacturing
- 9.2.3. Transportation and Automotive
- 9.2.4. Metal and Mining
- 9.2.5. Aerospace and Defense
- 9.2.6. Electronics and Consumer Technologies
- 9.2.7. Other End User Industries
- 9.3. Market Analysis, Insights and Forecast - by Market Segmentation and Target Audience
- 9.4. Market Analysis, Insights and Forecast - by Value Proposition
- 9.5. Market Analysis, Insights and Forecast - by Distribution Channel Strategies
- 9.6. Market Analysis, Insights and Forecast - by Competitive Landscape
- 9.7. Market Analysis, Insights and Forecast - by Addressing Market Challenges
- 9.8. Market Analysis, Insights and Forecast - by Conclusion and Recommendations
- 9.1. Market Analysis, Insights and Forecast - by Deployment Type
- 10. Latin America Virtual Sensing Technology Industry Analysis, Insights and Forecast, 2019-2031
- 10.1. Market Analysis, Insights and Forecast - by Deployment Type
- 10.1.1. Cloud
- 10.1.2. On-premise
- 10.2. Market Analysis, Insights and Forecast - by End-user Industry
- 10.2.1. Oil and Gas
- 10.2.2. Manufacturing
- 10.2.3. Transportation and Automotive
- 10.2.4. Metal and Mining
- 10.2.5. Aerospace and Defense
- 10.2.6. Electronics and Consumer Technologies
- 10.2.7. Other End User Industries
- 10.3. Market Analysis, Insights and Forecast - by Market Segmentation and Target Audience
- 10.4. Market Analysis, Insights and Forecast - by Value Proposition
- 10.5. Market Analysis, Insights and Forecast - by Distribution Channel Strategies
- 10.6. Market Analysis, Insights and Forecast - by Competitive Landscape
- 10.7. Market Analysis, Insights and Forecast - by Addressing Market Challenges
- 10.8. Market Analysis, Insights and Forecast - by Conclusion and Recommendations
- 10.1. Market Analysis, Insights and Forecast - by Deployment Type
- 11. Middle East and Africa Virtual Sensing Technology Industry Analysis, Insights and Forecast, 2019-2031
- 11.1. Market Analysis, Insights and Forecast - by Deployment Type
- 11.1.1. Cloud
- 11.1.2. On-premise
- 11.2. Market Analysis, Insights and Forecast - by End-user Industry
- 11.2.1. Oil and Gas
- 11.2.2. Manufacturing
- 11.2.3. Transportation and Automotive
- 11.2.4. Metal and Mining
- 11.2.5. Aerospace and Defense
- 11.2.6. Electronics and Consumer Technologies
- 11.2.7. Other End User Industries
- 11.3. Market Analysis, Insights and Forecast - by Market Segmentation and Target Audience
- 11.4. Market Analysis, Insights and Forecast - by Value Proposition
- 11.5. Market Analysis, Insights and Forecast - by Distribution Channel Strategies
- 11.6. Market Analysis, Insights and Forecast - by Competitive Landscape
- 11.7. Market Analysis, Insights and Forecast - by Addressing Market Challenges
- 11.8. Market Analysis, Insights and Forecast - by Conclusion and Recommendations
- 11.1. Market Analysis, Insights and Forecast - by Deployment Type
- 12. North America Virtual Sensing Technology Industry Analysis, Insights and Forecast, 2019-2031
- 12.1. Market Analysis, Insights and Forecast - By Country/Sub-region
- 12.1.1 United States
- 12.1.2 Canada
- 13. Asia Pacific Virtual Sensing Technology Industry Analysis, Insights and Forecast, 2019-2031
- 13.1. Market Analysis, Insights and Forecast - By Country/Sub-region
- 13.1.1 China
- 13.1.2 Japan
- 13.1.3 India
- 13.1.4 South Korea
- 13.1.5 Taiwan
- 13.1.6 Australia
- 13.1.7 Rest of Asia-Pacific
- 14. Europe Virtual Sensing Technology Industry Analysis, Insights and Forecast, 2019-2031
- 14.1. Market Analysis, Insights and Forecast - By Country/Sub-region
- 14.1.1 Germany
- 14.1.2 France
- 14.1.3 Italy
- 14.1.4 United Kingdom
- 14.1.5 Netherlands
- 14.1.6 Sweden
- 14.1.7 Rest of Europe
- 15. South America Virtual Sensing Technology Industry Analysis, Insights and Forecast, 2019-2031
- 15.1. Market Analysis, Insights and Forecast - By Country/Sub-region
- 15.1.1 Brazil
- 15.1.2 Argentina
- 15.1.3 Rest of South America
- 16. Middle East & Africa Virtual Sensing Technology Industry Analysis, Insights and Forecast, 2019-2031
- 16.1. Market Analysis, Insights and Forecast - By Country/Sub-region
- 16.1.1 UAE
- 16.1.2 South Africa
- 16.1.3 Saudi Arabia
- 16.1.4 Rest of MEA
- 17. Competitive Analysis
- 17.1. Global Market Share Analysis 2024
- 17.2. Company Profiles
- 17.2.1 Körber AG
- 17.2.1.1. Overview
- 17.2.1.2. Products
- 17.2.1.3. SWOT Analysis
- 17.2.1.4. Recent Developments
- 17.2.1.5. Financials (Based on Availability)
- 17.2.2 Modelway SRL
- 17.2.2.1. Overview
- 17.2.2.2. Products
- 17.2.2.3. SWOT Analysis
- 17.2.2.4. Recent Developments
- 17.2.2.5. Financials (Based on Availability)
- 17.2.3 Elliptic Labs ASA
- 17.2.3.1. Overview
- 17.2.3.2. Products
- 17.2.3.3. SWOT Analysis
- 17.2.3.4. Recent Developments
- 17.2.3.5. Financials (Based on Availability)
- 17.2.4 Cisco Systems Inc
- 17.2.4.1. Overview
- 17.2.4.2. Products
- 17.2.4.3. SWOT Analysis
- 17.2.4.4. Recent Developments
- 17.2.4.5. Financials (Based on Availability)
- 17.2.5 Siemens AG
- 17.2.5.1. Overview
- 17.2.5.2. Products
- 17.2.5.3. SWOT Analysis
- 17.2.5.4. Recent Developments
- 17.2.5.5. Financials (Based on Availability)
- 17.2.6 Schneider Electric SE
- 17.2.6.1. Overview
- 17.2.6.2. Products
- 17.2.6.3. SWOT Analysis
- 17.2.6.4. Recent Developments
- 17.2.6.5. Financials (Based on Availability)
- 17.2.7 Andata Lt
- 17.2.7.1. Overview
- 17.2.7.2. Products
- 17.2.7.3. SWOT Analysis
- 17.2.7.4. Recent Developments
- 17.2.7.5. Financials (Based on Availability)
- 17.2.8 Intelli Dynamics (Biocomp Systems Inc )
- 17.2.8.1. Overview
- 17.2.8.2. Products
- 17.2.8.3. SWOT Analysis
- 17.2.8.4. Recent Developments
- 17.2.8.5. Financials (Based on Availability)
- 17.2.9 General Electric Company
- 17.2.9.1. Overview
- 17.2.9.2. Products
- 17.2.9.3. SWOT Analysis
- 17.2.9.4. Recent Developments
- 17.2.9.5. Financials (Based on Availability)
- 17.2.1 Körber AG
List of Figures
- Figure 1: Global Virtual Sensing Technology Industry Revenue Breakdown (Million, %) by Region 2024 & 2032
- Figure 2: North America Virtual Sensing Technology Industry Revenue (Million), by Country 2024 & 2032
- Figure 3: North America Virtual Sensing Technology Industry Revenue Share (%), by Country 2024 & 2032
- Figure 4: Asia Pacific Virtual Sensing Technology Industry Revenue (Million), by Country 2024 & 2032
- Figure 5: Asia Pacific Virtual Sensing Technology Industry Revenue Share (%), by Country 2024 & 2032
- Figure 6: Europe Virtual Sensing Technology Industry Revenue (Million), by Country 2024 & 2032
- Figure 7: Europe Virtual Sensing Technology Industry Revenue Share (%), by Country 2024 & 2032
- Figure 8: South America Virtual Sensing Technology Industry Revenue (Million), by Country 2024 & 2032
- Figure 9: South America Virtual Sensing Technology Industry Revenue Share (%), by Country 2024 & 2032
- Figure 10: Middle East & Africa Virtual Sensing Technology Industry Revenue (Million), by Country 2024 & 2032
- Figure 11: Middle East & Africa Virtual Sensing Technology Industry Revenue Share (%), by Country 2024 & 2032
- Figure 12: North America Virtual Sensing Technology Industry Revenue (Million), by Deployment Type 2024 & 2032
- Figure 13: North America Virtual Sensing Technology Industry Revenue Share (%), by Deployment Type 2024 & 2032
- Figure 14: North America Virtual Sensing Technology Industry Revenue (Million), by End-user Industry 2024 & 2032
- Figure 15: North America Virtual Sensing Technology Industry Revenue Share (%), by End-user Industry 2024 & 2032
- Figure 16: North America Virtual Sensing Technology Industry Revenue (Million), by Market Segmentation and Target Audience 2024 & 2032
- Figure 17: North America Virtual Sensing Technology Industry Revenue Share (%), by Market Segmentation and Target Audience 2024 & 2032
- Figure 18: North America Virtual Sensing Technology Industry Revenue (Million), by Value Proposition 2024 & 2032
- Figure 19: North America Virtual Sensing Technology Industry Revenue Share (%), by Value Proposition 2024 & 2032
- Figure 20: North America Virtual Sensing Technology Industry Revenue (Million), by Distribution Channel Strategies 2024 & 2032
- Figure 21: North America Virtual Sensing Technology Industry Revenue Share (%), by Distribution Channel Strategies 2024 & 2032
- Figure 22: North America Virtual Sensing Technology Industry Revenue (Million), by Competitive Landscape 2024 & 2032
- Figure 23: North America Virtual Sensing Technology Industry Revenue Share (%), by Competitive Landscape 2024 & 2032
- Figure 24: North America Virtual Sensing Technology Industry Revenue (Million), by Addressing Market Challenges 2024 & 2032
- Figure 25: North America Virtual Sensing Technology Industry Revenue Share (%), by Addressing Market Challenges 2024 & 2032
- Figure 26: North America Virtual Sensing Technology Industry Revenue (Million), by Conclusion and Recommendations 2024 & 2032
- Figure 27: North America Virtual Sensing Technology Industry Revenue Share (%), by Conclusion and Recommendations 2024 & 2032
- Figure 28: North America Virtual Sensing Technology Industry Revenue (Million), by Country 2024 & 2032
- Figure 29: North America Virtual Sensing Technology Industry Revenue Share (%), by Country 2024 & 2032
- Figure 30: Europe Virtual Sensing Technology Industry Revenue (Million), by Deployment Type 2024 & 2032
- Figure 31: Europe Virtual Sensing Technology Industry Revenue Share (%), by Deployment Type 2024 & 2032
- Figure 32: Europe Virtual Sensing Technology Industry Revenue (Million), by End-user Industry 2024 & 2032
- Figure 33: Europe Virtual Sensing Technology Industry Revenue Share (%), by End-user Industry 2024 & 2032
- Figure 34: Europe Virtual Sensing Technology Industry Revenue (Million), by Market Segmentation and Target Audience 2024 & 2032
- Figure 35: Europe Virtual Sensing Technology Industry Revenue Share (%), by Market Segmentation and Target Audience 2024 & 2032
- Figure 36: Europe Virtual Sensing Technology Industry Revenue (Million), by Value Proposition 2024 & 2032
- Figure 37: Europe Virtual Sensing Technology Industry Revenue Share (%), by Value Proposition 2024 & 2032
- Figure 38: Europe Virtual Sensing Technology Industry Revenue (Million), by Distribution Channel Strategies 2024 & 2032
- Figure 39: Europe Virtual Sensing Technology Industry Revenue Share (%), by Distribution Channel Strategies 2024 & 2032
- Figure 40: Europe Virtual Sensing Technology Industry Revenue (Million), by Competitive Landscape 2024 & 2032
- Figure 41: Europe Virtual Sensing Technology Industry Revenue Share (%), by Competitive Landscape 2024 & 2032
- Figure 42: Europe Virtual Sensing Technology Industry Revenue (Million), by Addressing Market Challenges 2024 & 2032
- Figure 43: Europe Virtual Sensing Technology Industry Revenue Share (%), by Addressing Market Challenges 2024 & 2032
- Figure 44: Europe Virtual Sensing Technology Industry Revenue (Million), by Conclusion and Recommendations 2024 & 2032
- Figure 45: Europe Virtual Sensing Technology Industry Revenue Share (%), by Conclusion and Recommendations 2024 & 2032
- Figure 46: Europe Virtual Sensing Technology Industry Revenue (Million), by Country 2024 & 2032
- Figure 47: Europe Virtual Sensing Technology Industry Revenue Share (%), by Country 2024 & 2032
- Figure 48: Asia Virtual Sensing Technology Industry Revenue (Million), by Deployment Type 2024 & 2032
- Figure 49: Asia Virtual Sensing Technology Industry Revenue Share (%), by Deployment Type 2024 & 2032
- Figure 50: Asia Virtual Sensing Technology Industry Revenue (Million), by End-user Industry 2024 & 2032
- Figure 51: Asia Virtual Sensing Technology Industry Revenue Share (%), by End-user Industry 2024 & 2032
- Figure 52: Asia Virtual Sensing Technology Industry Revenue (Million), by Market Segmentation and Target Audience 2024 & 2032
- Figure 53: Asia Virtual Sensing Technology Industry Revenue Share (%), by Market Segmentation and Target Audience 2024 & 2032
- Figure 54: Asia Virtual Sensing Technology Industry Revenue (Million), by Value Proposition 2024 & 2032
- Figure 55: Asia Virtual Sensing Technology Industry Revenue Share (%), by Value Proposition 2024 & 2032
- Figure 56: Asia Virtual Sensing Technology Industry Revenue (Million), by Distribution Channel Strategies 2024 & 2032
- Figure 57: Asia Virtual Sensing Technology Industry Revenue Share (%), by Distribution Channel Strategies 2024 & 2032
- Figure 58: Asia Virtual Sensing Technology Industry Revenue (Million), by Competitive Landscape 2024 & 2032
- Figure 59: Asia Virtual Sensing Technology Industry Revenue Share (%), by Competitive Landscape 2024 & 2032
- Figure 60: Asia Virtual Sensing Technology Industry Revenue (Million), by Addressing Market Challenges 2024 & 2032
- Figure 61: Asia Virtual Sensing Technology Industry Revenue Share (%), by Addressing Market Challenges 2024 & 2032
- Figure 62: Asia Virtual Sensing Technology Industry Revenue (Million), by Conclusion and Recommendations 2024 & 2032
- Figure 63: Asia Virtual Sensing Technology Industry Revenue Share (%), by Conclusion and Recommendations 2024 & 2032
- Figure 64: Asia Virtual Sensing Technology Industry Revenue (Million), by Country 2024 & 2032
- Figure 65: Asia Virtual Sensing Technology Industry Revenue Share (%), by Country 2024 & 2032
- Figure 66: Australia and New Zealand Virtual Sensing Technology Industry Revenue (Million), by Deployment Type 2024 & 2032
- Figure 67: Australia and New Zealand Virtual Sensing Technology Industry Revenue Share (%), by Deployment Type 2024 & 2032
- Figure 68: Australia and New Zealand Virtual Sensing Technology Industry Revenue (Million), by End-user Industry 2024 & 2032
- Figure 69: Australia and New Zealand Virtual Sensing Technology Industry Revenue Share (%), by End-user Industry 2024 & 2032
- Figure 70: Australia and New Zealand Virtual Sensing Technology Industry Revenue (Million), by Market Segmentation and Target Audience 2024 & 2032
- Figure 71: Australia and New Zealand Virtual Sensing Technology Industry Revenue Share (%), by Market Segmentation and Target Audience 2024 & 2032
- Figure 72: Australia and New Zealand Virtual Sensing Technology Industry Revenue (Million), by Value Proposition 2024 & 2032
- Figure 73: Australia and New Zealand Virtual Sensing Technology Industry Revenue Share (%), by Value Proposition 2024 & 2032
- Figure 74: Australia and New Zealand Virtual Sensing Technology Industry Revenue (Million), by Distribution Channel Strategies 2024 & 2032
- Figure 75: Australia and New Zealand Virtual Sensing Technology Industry Revenue Share (%), by Distribution Channel Strategies 2024 & 2032
- Figure 76: Australia and New Zealand Virtual Sensing Technology Industry Revenue (Million), by Competitive Landscape 2024 & 2032
- Figure 77: Australia and New Zealand Virtual Sensing Technology Industry Revenue Share (%), by Competitive Landscape 2024 & 2032
- Figure 78: Australia and New Zealand Virtual Sensing Technology Industry Revenue (Million), by Addressing Market Challenges 2024 & 2032
- Figure 79: Australia and New Zealand Virtual Sensing Technology Industry Revenue Share (%), by Addressing Market Challenges 2024 & 2032
- Figure 80: Australia and New Zealand Virtual Sensing Technology Industry Revenue (Million), by Conclusion and Recommendations 2024 & 2032
- Figure 81: Australia and New Zealand Virtual Sensing Technology Industry Revenue Share (%), by Conclusion and Recommendations 2024 & 2032
- Figure 82: Australia and New Zealand Virtual Sensing Technology Industry Revenue (Million), by Country 2024 & 2032
- Figure 83: Australia and New Zealand Virtual Sensing Technology Industry Revenue Share (%), by Country 2024 & 2032
- Figure 84: Latin America Virtual Sensing Technology Industry Revenue (Million), by Deployment Type 2024 & 2032
- Figure 85: Latin America Virtual Sensing Technology Industry Revenue Share (%), by Deployment Type 2024 & 2032
- Figure 86: Latin America Virtual Sensing Technology Industry Revenue (Million), by End-user Industry 2024 & 2032
- Figure 87: Latin America Virtual Sensing Technology Industry Revenue Share (%), by End-user Industry 2024 & 2032
- Figure 88: Latin America Virtual Sensing Technology Industry Revenue (Million), by Market Segmentation and Target Audience 2024 & 2032
- Figure 89: Latin America Virtual Sensing Technology Industry Revenue Share (%), by Market Segmentation and Target Audience 2024 & 2032
- Figure 90: Latin America Virtual Sensing Technology Industry Revenue (Million), by Value Proposition 2024 & 2032
- Figure 91: Latin America Virtual Sensing Technology Industry Revenue Share (%), by Value Proposition 2024 & 2032
- Figure 92: Latin America Virtual Sensing Technology Industry Revenue (Million), by Distribution Channel Strategies 2024 & 2032
- Figure 93: Latin America Virtual Sensing Technology Industry Revenue Share (%), by Distribution Channel Strategies 2024 & 2032
- Figure 94: Latin America Virtual Sensing Technology Industry Revenue (Million), by Competitive Landscape 2024 & 2032
- Figure 95: Latin America Virtual Sensing Technology Industry Revenue Share (%), by Competitive Landscape 2024 & 2032
- Figure 96: Latin America Virtual Sensing Technology Industry Revenue (Million), by Addressing Market Challenges 2024 & 2032
- Figure 97: Latin America Virtual Sensing Technology Industry Revenue Share (%), by Addressing Market Challenges 2024 & 2032
- Figure 98: Latin America Virtual Sensing Technology Industry Revenue (Million), by Conclusion and Recommendations 2024 & 2032
- Figure 99: Latin America Virtual Sensing Technology Industry Revenue Share (%), by Conclusion and Recommendations 2024 & 2032
- Figure 100: Latin America Virtual Sensing Technology Industry Revenue (Million), by Country 2024 & 2032
- Figure 101: Latin America Virtual Sensing Technology Industry Revenue Share (%), by Country 2024 & 2032
- Figure 102: Middle East and Africa Virtual Sensing Technology Industry Revenue (Million), by Deployment Type 2024 & 2032
- Figure 103: Middle East and Africa Virtual Sensing Technology Industry Revenue Share (%), by Deployment Type 2024 & 2032
- Figure 104: Middle East and Africa Virtual Sensing Technology Industry Revenue (Million), by End-user Industry 2024 & 2032
- Figure 105: Middle East and Africa Virtual Sensing Technology Industry Revenue Share (%), by End-user Industry 2024 & 2032
- Figure 106: Middle East and Africa Virtual Sensing Technology Industry Revenue (Million), by Market Segmentation and Target Audience 2024 & 2032
- Figure 107: Middle East and Africa Virtual Sensing Technology Industry Revenue Share (%), by Market Segmentation and Target Audience 2024 & 2032
- Figure 108: Middle East and Africa Virtual Sensing Technology Industry Revenue (Million), by Value Proposition 2024 & 2032
- Figure 109: Middle East and Africa Virtual Sensing Technology Industry Revenue Share (%), by Value Proposition 2024 & 2032
- Figure 110: Middle East and Africa Virtual Sensing Technology Industry Revenue (Million), by Distribution Channel Strategies 2024 & 2032
- Figure 111: Middle East and Africa Virtual Sensing Technology Industry Revenue Share (%), by Distribution Channel Strategies 2024 & 2032
- Figure 112: Middle East and Africa Virtual Sensing Technology Industry Revenue (Million), by Competitive Landscape 2024 & 2032
- Figure 113: Middle East and Africa Virtual Sensing Technology Industry Revenue Share (%), by Competitive Landscape 2024 & 2032
- Figure 114: Middle East and Africa Virtual Sensing Technology Industry Revenue (Million), by Addressing Market Challenges 2024 & 2032
- Figure 115: Middle East and Africa Virtual Sensing Technology Industry Revenue Share (%), by Addressing Market Challenges 2024 & 2032
- Figure 116: Middle East and Africa Virtual Sensing Technology Industry Revenue (Million), by Conclusion and Recommendations 2024 & 2032
- Figure 117: Middle East and Africa Virtual Sensing Technology Industry Revenue Share (%), by Conclusion and Recommendations 2024 & 2032
- Figure 118: Middle East and Africa Virtual Sensing Technology Industry Revenue (Million), by Country 2024 & 2032
- Figure 119: Middle East and Africa Virtual Sensing Technology Industry Revenue Share (%), by Country 2024 & 2032
List of Tables
- Table 1: Global Virtual Sensing Technology Industry Revenue Million Forecast, by Region 2019 & 2032
- Table 2: Global Virtual Sensing Technology Industry Revenue Million Forecast, by Deployment Type 2019 & 2032
- Table 3: Global Virtual Sensing Technology Industry Revenue Million Forecast, by End-user Industry 2019 & 2032
- Table 4: Global Virtual Sensing Technology Industry Revenue Million Forecast, by Market Segmentation and Target Audience 2019 & 2032
- Table 5: Global Virtual Sensing Technology Industry Revenue Million Forecast, by Value Proposition 2019 & 2032
- Table 6: Global Virtual Sensing Technology Industry Revenue Million Forecast, by Distribution Channel Strategies 2019 & 2032
- Table 7: Global Virtual Sensing Technology Industry Revenue Million Forecast, by Competitive Landscape 2019 & 2032
- Table 8: Global Virtual Sensing Technology Industry Revenue Million Forecast, by Addressing Market Challenges 2019 & 2032
- Table 9: Global Virtual Sensing Technology Industry Revenue Million Forecast, by Conclusion and Recommendations 2019 & 2032
- Table 10: Global Virtual Sensing Technology Industry Revenue Million Forecast, by Region 2019 & 2032
- Table 11: Global Virtual Sensing Technology Industry Revenue Million Forecast, by Country 2019 & 2032
- Table 12: United States Virtual Sensing Technology Industry Revenue (Million) Forecast, by Application 2019 & 2032
- Table 13: Canada Virtual Sensing Technology Industry Revenue (Million) Forecast, by Application 2019 & 2032
- Table 14: Global Virtual Sensing Technology Industry Revenue Million Forecast, by Country 2019 & 2032
- Table 15: China Virtual Sensing Technology Industry Revenue (Million) Forecast, by Application 2019 & 2032
- Table 16: Japan Virtual Sensing Technology Industry Revenue (Million) Forecast, by Application 2019 & 2032
- Table 17: India Virtual Sensing Technology Industry Revenue (Million) Forecast, by Application 2019 & 2032
- Table 18: South Korea Virtual Sensing Technology Industry Revenue (Million) Forecast, by Application 2019 & 2032
- Table 19: Taiwan Virtual Sensing Technology Industry Revenue (Million) Forecast, by Application 2019 & 2032
- Table 20: Australia Virtual Sensing Technology Industry Revenue (Million) Forecast, by Application 2019 & 2032
- Table 21: Rest of Asia-Pacific Virtual Sensing Technology Industry Revenue (Million) Forecast, by Application 2019 & 2032
- Table 22: Global Virtual Sensing Technology Industry Revenue Million Forecast, by Country 2019 & 2032
- Table 23: Germany Virtual Sensing Technology Industry Revenue (Million) Forecast, by Application 2019 & 2032
- Table 24: France Virtual Sensing Technology Industry Revenue (Million) Forecast, by Application 2019 & 2032
- Table 25: Italy Virtual Sensing Technology Industry Revenue (Million) Forecast, by Application 2019 & 2032
- Table 26: United Kingdom Virtual Sensing Technology Industry Revenue (Million) Forecast, by Application 2019 & 2032
- Table 27: Netherlands Virtual Sensing Technology Industry Revenue (Million) Forecast, by Application 2019 & 2032
- Table 28: Sweden Virtual Sensing Technology Industry Revenue (Million) Forecast, by Application 2019 & 2032
- Table 29: Rest of Europe Virtual Sensing Technology Industry Revenue (Million) Forecast, by Application 2019 & 2032
- Table 30: Global Virtual Sensing Technology Industry Revenue Million Forecast, by Country 2019 & 2032
- Table 31: Brazil Virtual Sensing Technology Industry Revenue (Million) Forecast, by Application 2019 & 2032
- Table 32: Argentina Virtual Sensing Technology Industry Revenue (Million) Forecast, by Application 2019 & 2032
- Table 33: Rest of South America Virtual Sensing Technology Industry Revenue (Million) Forecast, by Application 2019 & 2032
- Table 34: Global Virtual Sensing Technology Industry Revenue Million Forecast, by Country 2019 & 2032
- Table 35: UAE Virtual Sensing Technology Industry Revenue (Million) Forecast, by Application 2019 & 2032
- Table 36: South Africa Virtual Sensing Technology Industry Revenue (Million) Forecast, by Application 2019 & 2032
- Table 37: Saudi Arabia Virtual Sensing Technology Industry Revenue (Million) Forecast, by Application 2019 & 2032
- Table 38: Rest of MEA Virtual Sensing Technology Industry Revenue (Million) Forecast, by Application 2019 & 2032
- Table 39: Global Virtual Sensing Technology Industry Revenue Million Forecast, by Deployment Type 2019 & 2032
- Table 40: Global Virtual Sensing Technology Industry Revenue Million Forecast, by End-user Industry 2019 & 2032
- Table 41: Global Virtual Sensing Technology Industry Revenue Million Forecast, by Market Segmentation and Target Audience 2019 & 2032
- Table 42: Global Virtual Sensing Technology Industry Revenue Million Forecast, by Value Proposition 2019 & 2032
- Table 43: Global Virtual Sensing Technology Industry Revenue Million Forecast, by Distribution Channel Strategies 2019 & 2032
- Table 44: Global Virtual Sensing Technology Industry Revenue Million Forecast, by Competitive Landscape 2019 & 2032
- Table 45: Global Virtual Sensing Technology Industry Revenue Million Forecast, by Addressing Market Challenges 2019 & 2032
- Table 46: Global Virtual Sensing Technology Industry Revenue Million Forecast, by Conclusion and Recommendations 2019 & 2032
- Table 47: Global Virtual Sensing Technology Industry Revenue Million Forecast, by Country 2019 & 2032
- Table 48: United States Virtual Sensing Technology Industry Revenue (Million) Forecast, by Application 2019 & 2032
- Table 49: Canada Virtual Sensing Technology Industry Revenue (Million) Forecast, by Application 2019 & 2032
- Table 50: Global Virtual Sensing Technology Industry Revenue Million Forecast, by Deployment Type 2019 & 2032
- Table 51: Global Virtual Sensing Technology Industry Revenue Million Forecast, by End-user Industry 2019 & 2032
- Table 52: Global Virtual Sensing Technology Industry Revenue Million Forecast, by Market Segmentation and Target Audience 2019 & 2032
- Table 53: Global Virtual Sensing Technology Industry Revenue Million Forecast, by Value Proposition 2019 & 2032
- Table 54: Global Virtual Sensing Technology Industry Revenue Million Forecast, by Distribution Channel Strategies 2019 & 2032
- Table 55: Global Virtual Sensing Technology Industry Revenue Million Forecast, by Competitive Landscape 2019 & 2032
- Table 56: Global Virtual Sensing Technology Industry Revenue Million Forecast, by Addressing Market Challenges 2019 & 2032
- Table 57: Global Virtual Sensing Technology Industry Revenue Million Forecast, by Conclusion and Recommendations 2019 & 2032
- Table 58: Global Virtual Sensing Technology Industry Revenue Million Forecast, by Country 2019 & 2032
- Table 59: United Kingdom Virtual Sensing Technology Industry Revenue (Million) Forecast, by Application 2019 & 2032
- Table 60: Germany Virtual Sensing Technology Industry Revenue (Million) Forecast, by Application 2019 & 2032
- Table 61: France Virtual Sensing Technology Industry Revenue (Million) Forecast, by Application 2019 & 2032
- Table 62: Italy Virtual Sensing Technology Industry Revenue (Million) Forecast, by Application 2019 & 2032
- Table 63: Global Virtual Sensing Technology Industry Revenue Million Forecast, by Deployment Type 2019 & 2032
- Table 64: Global Virtual Sensing Technology Industry Revenue Million Forecast, by End-user Industry 2019 & 2032
- Table 65: Global Virtual Sensing Technology Industry Revenue Million Forecast, by Market Segmentation and Target Audience 2019 & 2032
- Table 66: Global Virtual Sensing Technology Industry Revenue Million Forecast, by Value Proposition 2019 & 2032
- Table 67: Global Virtual Sensing Technology Industry Revenue Million Forecast, by Distribution Channel Strategies 2019 & 2032
- Table 68: Global Virtual Sensing Technology Industry Revenue Million Forecast, by Competitive Landscape 2019 & 2032
- Table 69: Global Virtual Sensing Technology Industry Revenue Million Forecast, by Addressing Market Challenges 2019 & 2032
- Table 70: Global Virtual Sensing Technology Industry Revenue Million Forecast, by Conclusion and Recommendations 2019 & 2032
- Table 71: Global Virtual Sensing Technology Industry Revenue Million Forecast, by Country 2019 & 2032
- Table 72: China Virtual Sensing Technology Industry Revenue (Million) Forecast, by Application 2019 & 2032
- Table 73: Japan Virtual Sensing Technology Industry Revenue (Million) Forecast, by Application 2019 & 2032
- Table 74: India Virtual Sensing Technology Industry Revenue (Million) Forecast, by Application 2019 & 2032
- Table 75: Global Virtual Sensing Technology Industry Revenue Million Forecast, by Deployment Type 2019 & 2032
- Table 76: Global Virtual Sensing Technology Industry Revenue Million Forecast, by End-user Industry 2019 & 2032
- Table 77: Global Virtual Sensing Technology Industry Revenue Million Forecast, by Market Segmentation and Target Audience 2019 & 2032
- Table 78: Global Virtual Sensing Technology Industry Revenue Million Forecast, by Value Proposition 2019 & 2032
- Table 79: Global Virtual Sensing Technology Industry Revenue Million Forecast, by Distribution Channel Strategies 2019 & 2032
- Table 80: Global Virtual Sensing Technology Industry Revenue Million Forecast, by Competitive Landscape 2019 & 2032
- Table 81: Global Virtual Sensing Technology Industry Revenue Million Forecast, by Addressing Market Challenges 2019 & 2032
- Table 82: Global Virtual Sensing Technology Industry Revenue Million Forecast, by Conclusion and Recommendations 2019 & 2032
- Table 83: Global Virtual Sensing Technology Industry Revenue Million Forecast, by Country 2019 & 2032
- Table 84: Global Virtual Sensing Technology Industry Revenue Million Forecast, by Deployment Type 2019 & 2032
- Table 85: Global Virtual Sensing Technology Industry Revenue Million Forecast, by End-user Industry 2019 & 2032
- Table 86: Global Virtual Sensing Technology Industry Revenue Million Forecast, by Market Segmentation and Target Audience 2019 & 2032
- Table 87: Global Virtual Sensing Technology Industry Revenue Million Forecast, by Value Proposition 2019 & 2032
- Table 88: Global Virtual Sensing Technology Industry Revenue Million Forecast, by Distribution Channel Strategies 2019 & 2032
- Table 89: Global Virtual Sensing Technology Industry Revenue Million Forecast, by Competitive Landscape 2019 & 2032
- Table 90: Global Virtual Sensing Technology Industry Revenue Million Forecast, by Addressing Market Challenges 2019 & 2032
- Table 91: Global Virtual Sensing Technology Industry Revenue Million Forecast, by Conclusion and Recommendations 2019 & 2032
- Table 92: Global Virtual Sensing Technology Industry Revenue Million Forecast, by Country 2019 & 2032
- Table 93: Global Virtual Sensing Technology Industry Revenue Million Forecast, by Deployment Type 2019 & 2032
- Table 94: Global Virtual Sensing Technology Industry Revenue Million Forecast, by End-user Industry 2019 & 2032
- Table 95: Global Virtual Sensing Technology Industry Revenue Million Forecast, by Market Segmentation and Target Audience 2019 & 2032
- Table 96: Global Virtual Sensing Technology Industry Revenue Million Forecast, by Value Proposition 2019 & 2032
- Table 97: Global Virtual Sensing Technology Industry Revenue Million Forecast, by Distribution Channel Strategies 2019 & 2032
- Table 98: Global Virtual Sensing Technology Industry Revenue Million Forecast, by Competitive Landscape 2019 & 2032
- Table 99: Global Virtual Sensing Technology Industry Revenue Million Forecast, by Addressing Market Challenges 2019 & 2032
- Table 100: Global Virtual Sensing Technology Industry Revenue Million Forecast, by Conclusion and Recommendations 2019 & 2032
- Table 101: Global Virtual Sensing Technology Industry Revenue Million Forecast, by Country 2019 & 2032
Frequently Asked Questions
1. What is the projected Compound Annual Growth Rate (CAGR) of the Virtual Sensing Technology Industry?
The projected CAGR is approximately 31.38%.
2. Which companies are prominent players in the Virtual Sensing Technology Industry?
Key companies in the market include Körber AG, Modelway SRL, Elliptic Labs ASA, Cisco Systems Inc, Siemens AG, Schneider Electric SE, Andata Lt, Intelli Dynamics (Biocomp Systems Inc ), General Electric Company.
3. What are the main segments of the Virtual Sensing Technology Industry?
The market segments include Deployment Type, End-user Industry, Market Segmentation and Target Audience, Value Proposition, Distribution Channel Strategies, Competitive Landscape, Addressing Market Challenges, Conclusion and Recommendations.
4. Can you provide details about the market size?
The market size is estimated to be USD 1.04 Million as of 2022.
5. What are some drivers contributing to market growth?
Increasing Adoption of IoT and Cloud Platform Is Expected to Drive the Market; Growing Need For Enhanced Cost-effectiveness and Operational Efficiency in Manufacturing.
6. What are the notable trends driving market growth?
Transportation and Automotive Industry to be the Fastest Growing End User.
7. Are there any restraints impacting market growth?
High Deployment and Maintenance Cost.
8. Can you provide examples of recent developments in the market?
March 2024 - Elliptic Labs announced that it has deployed over 500 million devices and is shipping its AI Virtual Proximity Sensor INNER BEAUTY on the Lava Blaze Curve smartphone. Elliptic Labs' newest smartphone customer, Lava International, has released the Lava Blaze Curve smartphone for the international market. Lava has collaborated with Elliptic Labs' partner MediaTek and chosen MediaTek's Dimensity 7050 chipset to drive the Blaze Curve smartphone. Elliptic Labs previously announced the contract for this launch.
9. What pricing options are available for accessing the report?
Pricing options include single-user, multi-user, and enterprise licenses priced at USD 4750, USD 5250, and USD 8750 respectively.
10. Is the market size provided in terms of value or volume?
The market size is provided in terms of value, measured in Million.
11. Are there any specific market keywords associated with the report?
Yes, the market keyword associated with the report is "Virtual Sensing Technology Industry," which aids in identifying and referencing the specific market segment covered.
12. How do I determine which pricing option suits my needs best?
The pricing options vary based on user requirements and access needs. Individual users may opt for single-user licenses, while businesses requiring broader access may choose multi-user or enterprise licenses for cost-effective access to the report.
13. Are there any additional resources or data provided in the Virtual Sensing Technology Industry report?
While the report offers comprehensive insights, it's advisable to review the specific contents or supplementary materials provided to ascertain if additional resources or data are available.
14. How can I stay updated on further developments or reports in the Virtual Sensing Technology Industry?
To stay informed about further developments, trends, and reports in the Virtual Sensing Technology Industry, consider subscribing to industry newsletters, following relevant companies and organizations, or regularly checking reputable industry news sources and publications.
Methodology
Step 1 - Identification of Relevant Samples Size from Population Database


Step 2 - Approaches for Defining Global Market Size (Value, Volume* & Price*)

Note*: In applicable scenarios
Step 3 - Data Sources
Primary Research
- Web Analytics
- Survey Reports
- Research Institute
- Latest Research Reports
- Opinion Leaders
Secondary Research
- Annual Reports
- White Paper
- Latest Press Release
- Industry Association
- Paid Database
- Investor Presentations

Step 4 - Data Triangulation
Involves using different sources of information in order to increase the validity of a study
These sources are likely to be stakeholders in a program - participants, other researchers, program staff, other community members, and so on.
Then we put all data in single framework & apply various statistical tools to find out the dynamic on the market.
During the analysis stage, feedback from the stakeholder groups would be compared to determine areas of agreement as well as areas of divergence
