

Key Insights
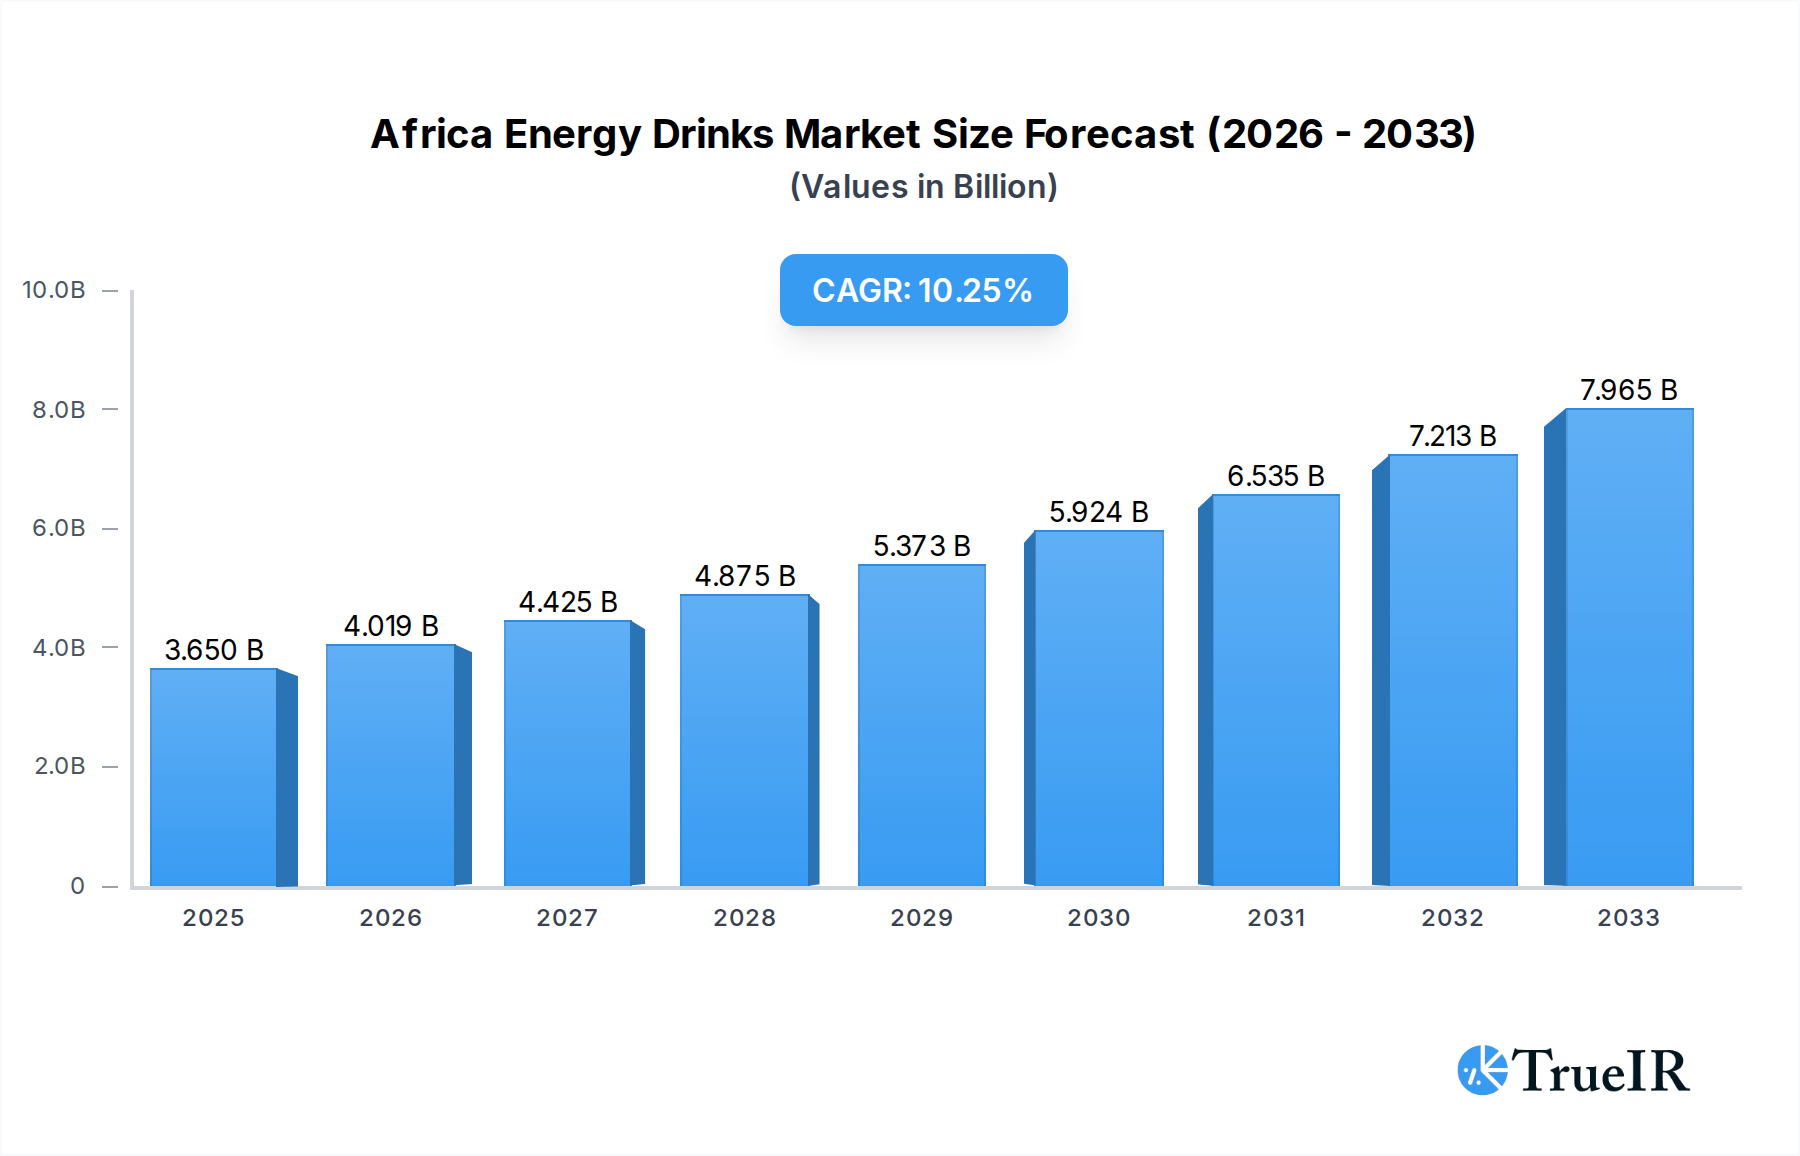
The Africa Energy Drinks Market is poised for significant expansion, projected to reach approximately USD 3.65 billion by 2025, with an impressive compound annual growth rate (CAGR) of 10.19% during the forecast period of 2025-2033. This robust growth is fueled by a confluence of factors, including the increasing disposable incomes across key African nations, a burgeoning young population with active lifestyles, and a growing awareness and demand for functional beverages that offer enhanced energy and performance. Traditional energy drinks continue to dominate the market, but emerging trends like the rise of natural and organic energy drinks, alongside sugar-free and low-calorie alternatives, are catering to a more health-conscious consumer base. The convenience of off-trade channels, particularly online retail and supermarkets, is proving instrumental in driving accessibility and sales across the continent. Key companies are actively investing in product innovation and expanding their distribution networks to capture this dynamic market.

Africa Energy Drinks Market Market Size (In Billion)
Looking ahead, the market's trajectory is expected to be further shaped by evolving consumer preferences and increased product diversification. While traditional energy drinks remain popular, the demand for healthier options is steadily gaining momentum, presenting opportunities for companies focusing on natural ingredients and reduced sugar content. The packaging landscape is also seeing a shift, with metal cans and PET bottles gaining traction due to their portability and cost-effectiveness, complementing the established presence of glass bottles. The strategic focus on prominent African markets like Nigeria, South Africa, and Egypt, alongside emerging markets, underscores the immense potential for growth. Continued market penetration and strategic alliances among major players will be crucial in navigating competitive landscapes and capitalizing on the evolving demands of the African energy drinks consumer.
Africa Energy Drinks Market Company Market Share
Africa Energy Drinks Market: Comprehensive Report and Future Outlook (2019-2033)
This in-depth analysis of the Africa Energy Drinks Market provides a detailed examination of market dynamics, key players, emerging trends, and future projections. Covering the historical period of 2019-2024 and extending to a forecast period of 2025-2033, with a base year of 2025, this report offers invaluable insights for stakeholders seeking to capitalize on the burgeoning African energy drink sector. The market is projected to reach USD XXX billion by 2033, exhibiting a robust Compound Annual Growth Rate (CAGR) of XX.XX%.
Africa Energy Drinks Market Market Structure & Competitive Landscape
The Africa Energy Drinks Market is characterized by a dynamic and evolving competitive landscape. Market concentration varies across different sub-regions, with some areas exhibiting dominance by multinational corporations and others fostering the growth of local players. Innovation is a key differentiator, driven by evolving consumer preferences for healthier alternatives and unique flavor profiles. Regulatory frameworks, while still developing in some nations, are increasingly impacting product development and marketing strategies. The threat of product substitutes, such as traditional soft drinks and coffee, remains a constant factor, influencing brand differentiation and consumer loyalty. End-user segmentation reveals a growing demand from the younger demographic, athletes, and individuals seeking an energy boost for demanding lifestyles. Mergers and acquisitions (M&A) are anticipated to play a significant role in market consolidation and expansion, with an estimated XX number of M&A deals expected in the forecast period, collectively valued at USD XXX billion. The market structure is projected to see a shift towards increased collaboration between established players and agile local enterprises to navigate diverse market entry barriers.
Africa Energy Drinks Market Market Trends & Opportunities
The Africa Energy Drinks Market is poised for significant expansion, driven by a confluence of favorable demographic trends, increasing disposable incomes, and a growing awareness of functional beverages. The market size is projected to ascend from an estimated USD XXX billion in 2025 to USD XXX billion by 2033, fueled by a projected CAGR of XX.XX%. Technological shifts in manufacturing and packaging are enabling greater efficiency and sustainability, leading to cost reductions and enhanced product appeal. Consumer preferences are rapidly evolving, with a discernible shift towards natural/organic options and sugar-free or low-calorie formulations. This presents a substantial opportunity for brands to cater to health-conscious consumers. Competitive dynamics are intensifying, with both global giants and nimble local brands vying for market share through innovative product launches, strategic partnerships, and targeted marketing campaigns. The increasing urbanization across the continent, coupled with rising participation in sports and fitness activities, further amplifies the demand for energy drinks. Furthermore, the growing influence of social media and digital marketing channels provides brands with unprecedented opportunities to reach and engage with a wider consumer base, fostering brand loyalty and driving sales. The untapped potential in various African nations, with their rapidly expanding youth populations, represents a fertile ground for market penetration and growth.
Dominant Markets & Segments in Africa Energy Drinks Market
The Africa Energy Drinks Market demonstrates significant dominance in specific regions and segments, reflecting diverse consumer behaviors and market penetration.
- Leading Regions & Countries: South Africa consistently emerges as a leading market due to its relatively mature economy, established distribution networks, and higher disposable incomes. Nigeria and Kenya follow closely, driven by their large, young populations and increasing urbanization. Emerging markets in North Africa, such as Egypt and Morocco, also present substantial growth potential, albeit with distinct consumer preferences and regulatory landscapes.
- Dominant Soft Drink Types:
- Traditional Energy Drinks: These continue to hold a significant market share, appealing to consumers seeking a potent and familiar energy boost.
- Sugar-free or Low-calories Energy Drinks: The health and wellness trend is significantly propelling the growth of this segment, driven by growing concerns about sugar intake and obesity.
- Natural/Organic Energy Drinks: While still a nascent segment, its growth trajectory is steep, catering to a niche but expanding consumer base that prioritizes natural ingredients and perceived health benefits.
- Dominant Packaging Types:
- Metal Can: This remains the preferred packaging format for its convenience, portability, and perceived premium appeal, especially for traditional energy drinks.
- PET Bottles: Their cost-effectiveness and recyclability make them a strong contender, particularly for mass-market appeal and larger format offerings.
- Glass Bottles: While less prevalent in mass retail, glass bottles are often associated with premium positioning and are favored by some niche brands.
- Dominant Distribution Channels:
- Off-trade: This is the most significant channel, encompassing:
- Supermarket/Hypermarket: Offering broad reach and visibility for established brands.
- Convenience Stores: Providing accessibility and impulse purchase opportunities, particularly in urban areas.
- Online Retail: Experiencing rapid growth, especially in technologically advanced markets, offering convenience and wider product selection.
- On-trade: This channel, including bars, clubs, and restaurants, is crucial for brand visibility and trial, especially for younger demographics and during social occasions.
- Off-trade: This is the most significant channel, encompassing:
Key growth drivers across these segments include targeted marketing campaigns that resonate with local cultures, affordable pricing strategies to enhance accessibility, and strategic partnerships with local distributors and retailers to navigate complex logistical challenges. The increasing availability of these products through e-commerce platforms is also a pivotal factor in expanding market reach.
Africa Energy Drinks Market Product Analysis
Product innovation within the Africa Energy Drinks Market is primarily focused on diversification and catering to evolving consumer needs. Companies are actively introducing formulations that emphasize natural ingredients, lower sugar content, and unique flavor profiles to capture a broader market segment. Competitive advantages are being built through unique ingredient combinations, such as tropical fruit extracts and adaptogens, offering functional benefits beyond simple energy enhancement. The market is witnessing a trend towards "better-for-you" energy drinks, positioning them as a healthier alternative to traditional sugary beverages. Technological advancements in ingredient sourcing and formulation are enabling brands to create products with enhanced bioavailability and taste profiles, thereby strengthening their market fit and consumer appeal.
Key Drivers, Barriers & Challenges in Africa Energy Drinks Market
Key Drivers:
- Growing Youth Population: A large and young demographic with a taste for modern beverages and an active lifestyle.
- Increasing Disposable Incomes: Rising purchasing power across many African nations fuels demand for premium and convenience products.
- Urbanization: Concentrated populations in cities create hubs for consumption and distribution.
- Health and Wellness Trends: A rising consciousness about health drives demand for sugar-free and natural alternatives.
- Marketing and Sponsorships: Targeted campaigns, particularly in sports and entertainment, create brand awareness and desire.
Barriers & Challenges:
- Supply Chain and Logistics: Inadequate infrastructure in some regions can lead to distribution hurdles and increased costs.
- Regulatory Hurdles: Varying regulations across countries regarding ingredients, labeling, and advertising can pose complexities.
- Economic Volatility: Currency fluctuations and economic instability can impact consumer spending and import costs.
- Competition from Traditional Beverages: Established soft drinks and coffee brands offer strong competition.
- Counterfeiting and Substandard Products: Ensuring product authenticity and quality remains a concern in some markets.
Growth Drivers in the Africa Energy Drinks Market Market
The Africa Energy Drinks Market's growth is primarily propelled by a burgeoning youthful population actively seeking energy boosts for their demanding lifestyles. Increasing disposable incomes across the continent are making energy drinks more accessible, shifting them from niche products to mainstream choices. Furthermore, the growing awareness of health and wellness is driving demand for sugar-free and natural energy drink variants, presenting significant opportunities for innovation. Technological advancements in product formulation and distribution networks are also playing a crucial role, enabling companies to reach a wider consumer base more efficiently. Government initiatives promoting local manufacturing and economic development can further stimulate market expansion.
Challenges Impacting Africa Energy Drinks Market Growth
Despite the optimistic outlook, several challenges can impede the growth of the Africa Energy Drinks Market. Inconsistent supply chain infrastructure across various African nations can lead to distribution bottlenecks and increased operational costs, impacting product availability. Navigating diverse and sometimes stringent regulatory frameworks for food and beverage products across different countries can also present significant hurdles for market entry and expansion. Intense competition from established global brands as well as local players, coupled with price sensitivities in certain markets, necessitates strategic pricing and value propositions. Furthermore, economic volatility and currency fluctuations can impact both consumer purchasing power and import costs, creating an unpredictable operating environment.
Key Players Shaping the Africa Energy Drinks Market Market
- Mutalo Group sp z o o
- Aje Group
- Tiger Brands Ltd
- The Alternative Power (Pty) Ltd
- Monster Beverage Corporation
- PepsiCo Inc
- Mofaya Beverage Company (PTY) Ltd
- S Spitz GmbH
- Suntory Holdings Limited
- Red Bull GmbH
- Halewood International South Africa (Pty) Ltd
- The Coca-Cola Company
Significant Africa Energy Drinks Market Industry Milestones
- October 2023: Miss South Africa Natasha Joubert collaborated with MoFaya energy drink, launching the "Berry Queen" flavored energy drink.
- October 2023: Switch Energy Drink introduced three new limited-edition flavors: Sour Worms, Naartjie & Grape, and Kiwi, Mango & Strawberry in the African region.
- September 2023: Switch Energy Drink launched a special limited-edition flavor in celebration of South African Heritage Day, highlighting its roots in the South African spirit.
Future Outlook for Africa Energy Drinks Market Market
The future outlook for the Africa Energy Drinks Market is exceptionally promising, driven by continued demographic tailwinds and evolving consumer demands. Strategic opportunities lie in further developing the natural/organic and sugar-free segments, aligning with global health trends. Expansion into underserved rural markets and leveraging e-commerce platforms for broader reach will be crucial. Investments in local manufacturing and partnerships with local enterprises will strengthen market penetration and brand loyalty. The market's potential for growth is substantial, with innovative product development and agile distribution strategies poised to capture significant market share in the coming years. The increasing engagement of local influencers and celebrities in brand collaborations will also play a pivotal role in driving consumer adoption and market momentum.
Africa Energy Drinks Market Segmentation
-
1. Soft Drink Type
- 1.1. Energy Shots
- 1.2. Natural/Organic Energy Drinks
- 1.3. Sugar-free or Low-calories Energy Drinks
- 1.4. Traditional Energy Drinks
- 1.5. Other Energy Drinks
-
2. Packaging Type
- 2.1. Glass Bottles
- 2.2. Metal Can
- 2.3. PET Bottles
-
3. Distribution Channel
-
3.1. Off-trade
- 3.1.1. Convenience Stores
- 3.1.2. Online Retail
- 3.1.3. Supermarket/Hypermarket
- 3.1.4. Others
- 3.2. On-trade
-
3.1. Off-trade
Africa Energy Drinks Market Segmentation By Geography
-
1. Africa
- 1.1. Nigeria
- 1.2. South Africa
- 1.3. Egypt
- 1.4. Kenya
- 1.5. Ethiopia
- 1.6. Morocco
- 1.7. Ghana
- 1.8. Algeria
- 1.9. Tanzania
- 1.10. Ivory Coast
Africa Energy Drinks Market Regional Market Share
Geographic Coverage of Africa Energy Drinks Market
Africa Energy Drinks Market REPORT HIGHLIGHTS
| Aspects | Details |
|---|---|
| Study Period | 2020-2034 |
| Base Year | 2025 |
| Estimated Year | 2026 |
| Forecast Period | 2026-2034 |
| Historical Period | 2020-2025 |
| Growth Rate | CAGR of 10.19% from 2020-2034 |
| Segmentation |
|
Table of Contents
- 1. Introduction
- 1.1. Research Scope
- 1.2. Market Segmentation
- 1.3. Research Objective
- 1.4. Definitions and Assumptions
- 2. Executive Summary
- 2.1. Market Snapshot
- 3. Market Dynamics
- 3.1. Market Drivers
- 3.2. Market Restrains
- 3.3. Market Trends
- 3.4. Market Opportunities
- 4. Market Factor Analysis
- 4.1. Porters Five Forces
- 4.1.1. Bargaining Power of Suppliers
- 4.1.2. Bargaining Power of Buyers
- 4.1.3. Threat of New Entrants
- 4.1.4. Threat of Substitutes
- 4.1.5. Competitive Rivalry
- 4.2. PESTEL analysis
- 4.3. BCG Analysis
- 4.3.1. Stars (High Growth, High Market Share)
- 4.3.2. Cash Cows (Low Growth, High Market Share)
- 4.3.3. Question Mark (High Growth, Low Market Share)
- 4.3.4. Dogs (Low Growth, Low Market Share)
- 4.4. Ansoff Matrix Analysis
- 4.5. Supply Chain Analysis
- 4.6. Regulatory Landscape
- 4.7. Current Market Potential and Opportunity Assessment (TAM–SAM–SOM Framework)
- 4.8. TIR Analyst Note
- 4.1. Porters Five Forces
- 5. Market Analysis, Insights and Forecast 2021-2033
- 5.1. Market Analysis, Insights and Forecast - by Soft Drink Type
- 5.1.1. Energy Shots
- 5.1.2. Natural/Organic Energy Drinks
- 5.1.3. Sugar-free or Low-calories Energy Drinks
- 5.1.4. Traditional Energy Drinks
- 5.1.5. Other Energy Drinks
- 5.2. Market Analysis, Insights and Forecast - by Packaging Type
- 5.2.1. Glass Bottles
- 5.2.2. Metal Can
- 5.2.3. PET Bottles
- 5.3. Market Analysis, Insights and Forecast - by Distribution Channel
- 5.3.1. Off-trade
- 5.3.1.1. Convenience Stores
- 5.3.1.2. Online Retail
- 5.3.1.3. Supermarket/Hypermarket
- 5.3.1.4. Others
- 5.3.2. On-trade
- 5.3.1. Off-trade
- 5.4. Market Analysis, Insights and Forecast - by Region
- 5.4.1. Africa
- 5.1. Market Analysis, Insights and Forecast - by Soft Drink Type
- 6. Africa Energy Drinks Market Analysis, Insights and Forecast, 2021-2033
- 6.1. Market Analysis, Insights and Forecast - by Soft Drink Type
- 6.1.1. Energy Shots
- 6.1.2. Natural/Organic Energy Drinks
- 6.1.3. Sugar-free or Low-calories Energy Drinks
- 6.1.4. Traditional Energy Drinks
- 6.1.5. Other Energy Drinks
- 6.2. Market Analysis, Insights and Forecast - by Packaging Type
- 6.2.1. Glass Bottles
- 6.2.2. Metal Can
- 6.2.3. PET Bottles
- 6.3. Market Analysis, Insights and Forecast - by Distribution Channel
- 6.3.1. Off-trade
- 6.3.1.1. Convenience Stores
- 6.3.1.2. Online Retail
- 6.3.1.3. Supermarket/Hypermarket
- 6.3.1.4. Others
- 6.3.2. On-trade
- 6.3.1. Off-trade
- 6.1. Market Analysis, Insights and Forecast - by Soft Drink Type
- 7. Competitive Analysis
- 7.1. Company Profiles
- 7.1.1 Mutalo Group sp z o o
- 7.1.1.1. Company Overview
- 7.1.1.2. Products
- 7.1.1.3. Company Financials
- 7.1.1.4. SWOT Analysis
- 7.1.2 Aje Group
- 7.1.2.1. Company Overview
- 7.1.2.2. Products
- 7.1.2.3. Company Financials
- 7.1.2.4. SWOT Analysis
- 7.1.3 Tiger Brands Ltd
- 7.1.3.1. Company Overview
- 7.1.3.2. Products
- 7.1.3.3. Company Financials
- 7.1.3.4. SWOT Analysis
- 7.1.4 The Alternative Power (Pty) Ltd
- 7.1.4.1. Company Overview
- 7.1.4.2. Products
- 7.1.4.3. Company Financials
- 7.1.4.4. SWOT Analysis
- 7.1.5 Monster Beverage Corporation
- 7.1.5.1. Company Overview
- 7.1.5.2. Products
- 7.1.5.3. Company Financials
- 7.1.5.4. SWOT Analysis
- 7.1.6 PepsiCo Inc
- 7.1.6.1. Company Overview
- 7.1.6.2. Products
- 7.1.6.3. Company Financials
- 7.1.6.4. SWOT Analysis
- 7.1.7 Mofaya Beverage Company (PTY) Ltd
- 7.1.7.1. Company Overview
- 7.1.7.2. Products
- 7.1.7.3. Company Financials
- 7.1.7.4. SWOT Analysis
- 7.1.8 S Spitz GmbH
- 7.1.8.1. Company Overview
- 7.1.8.2. Products
- 7.1.8.3. Company Financials
- 7.1.8.4. SWOT Analysis
- 7.1.9 Suntory Holdings Limited
- 7.1.9.1. Company Overview
- 7.1.9.2. Products
- 7.1.9.3. Company Financials
- 7.1.9.4. SWOT Analysis
- 7.1.10 Red Bull GmbH
- 7.1.10.1. Company Overview
- 7.1.10.2. Products
- 7.1.10.3. Company Financials
- 7.1.10.4. SWOT Analysis
- 7.1.11 Halewood International South Africa (Pty) Ltd
- 7.1.11.1. Company Overview
- 7.1.11.2. Products
- 7.1.11.3. Company Financials
- 7.1.11.4. SWOT Analysis
- 7.1.12 The Coca-Cola Company
- 7.1.12.1. Company Overview
- 7.1.12.2. Products
- 7.1.12.3. Company Financials
- 7.1.12.4. SWOT Analysis
- 7.1.1 Mutalo Group sp z o o
- 7.2. Market Entropy
- 7.2.1 Company's Key Areas Served
- 7.2.2 Recent Developments
- 7.3. Company Market Share Analysis 2025
- 7.3.1 Top 5 Companies Market Share Analysis
- 7.3.2 Top 3 Companies Market Share Analysis
- 7.4. List of Potential Customers
- 8. Research Methodology
List of Figures
- Figure 1: Africa Energy Drinks Market Revenue Breakdown (billion, %) by Product 2025 & 2033
- Figure 2: Africa Energy Drinks Market Share (%) by Company 2025
List of Tables
- Table 1: Africa Energy Drinks Market Revenue billion Forecast, by Soft Drink Type 2020 & 2033
- Table 2: Africa Energy Drinks Market Volume K Tons Forecast, by Soft Drink Type 2020 & 2033
- Table 3: Africa Energy Drinks Market Revenue billion Forecast, by Packaging Type 2020 & 2033
- Table 4: Africa Energy Drinks Market Volume K Tons Forecast, by Packaging Type 2020 & 2033
- Table 5: Africa Energy Drinks Market Revenue billion Forecast, by Distribution Channel 2020 & 2033
- Table 6: Africa Energy Drinks Market Volume K Tons Forecast, by Distribution Channel 2020 & 2033
- Table 7: Africa Energy Drinks Market Revenue billion Forecast, by Region 2020 & 2033
- Table 8: Africa Energy Drinks Market Volume K Tons Forecast, by Region 2020 & 2033
- Table 9: Africa Energy Drinks Market Revenue billion Forecast, by Soft Drink Type 2020 & 2033
- Table 10: Africa Energy Drinks Market Volume K Tons Forecast, by Soft Drink Type 2020 & 2033
- Table 11: Africa Energy Drinks Market Revenue billion Forecast, by Packaging Type 2020 & 2033
- Table 12: Africa Energy Drinks Market Volume K Tons Forecast, by Packaging Type 2020 & 2033
- Table 13: Africa Energy Drinks Market Revenue billion Forecast, by Distribution Channel 2020 & 2033
- Table 14: Africa Energy Drinks Market Volume K Tons Forecast, by Distribution Channel 2020 & 2033
- Table 15: Africa Energy Drinks Market Revenue billion Forecast, by Country 2020 & 2033
- Table 16: Africa Energy Drinks Market Volume K Tons Forecast, by Country 2020 & 2033
- Table 17: Nigeria Africa Energy Drinks Market Revenue (billion) Forecast, by Application 2020 & 2033
- Table 18: Nigeria Africa Energy Drinks Market Volume (K Tons) Forecast, by Application 2020 & 2033
- Table 19: South Africa Africa Energy Drinks Market Revenue (billion) Forecast, by Application 2020 & 2033
- Table 20: South Africa Africa Energy Drinks Market Volume (K Tons) Forecast, by Application 2020 & 2033
- Table 21: Egypt Africa Energy Drinks Market Revenue (billion) Forecast, by Application 2020 & 2033
- Table 22: Egypt Africa Energy Drinks Market Volume (K Tons) Forecast, by Application 2020 & 2033
- Table 23: Kenya Africa Energy Drinks Market Revenue (billion) Forecast, by Application 2020 & 2033
- Table 24: Kenya Africa Energy Drinks Market Volume (K Tons) Forecast, by Application 2020 & 2033
- Table 25: Ethiopia Africa Energy Drinks Market Revenue (billion) Forecast, by Application 2020 & 2033
- Table 26: Ethiopia Africa Energy Drinks Market Volume (K Tons) Forecast, by Application 2020 & 2033
- Table 27: Morocco Africa Energy Drinks Market Revenue (billion) Forecast, by Application 2020 & 2033
- Table 28: Morocco Africa Energy Drinks Market Volume (K Tons) Forecast, by Application 2020 & 2033
- Table 29: Ghana Africa Energy Drinks Market Revenue (billion) Forecast, by Application 2020 & 2033
- Table 30: Ghana Africa Energy Drinks Market Volume (K Tons) Forecast, by Application 2020 & 2033
- Table 31: Algeria Africa Energy Drinks Market Revenue (billion) Forecast, by Application 2020 & 2033
- Table 32: Algeria Africa Energy Drinks Market Volume (K Tons) Forecast, by Application 2020 & 2033
- Table 33: Tanzania Africa Energy Drinks Market Revenue (billion) Forecast, by Application 2020 & 2033
- Table 34: Tanzania Africa Energy Drinks Market Volume (K Tons) Forecast, by Application 2020 & 2033
- Table 35: Ivory Coast Africa Energy Drinks Market Revenue (billion) Forecast, by Application 2020 & 2033
- Table 36: Ivory Coast Africa Energy Drinks Market Volume (K Tons) Forecast, by Application 2020 & 2033
Frequently Asked Questions
1. What is the projected Compound Annual Growth Rate (CAGR) of the Africa Energy Drinks Market?
The projected CAGR is approximately 10.19%.
2. Which companies are prominent players in the Africa Energy Drinks Market?
Key companies in the market include Mutalo Group sp z o o, Aje Group, Tiger Brands Ltd, The Alternative Power (Pty) Ltd, Monster Beverage Corporation, PepsiCo Inc, Mofaya Beverage Company (PTY) Ltd, S Spitz GmbH, Suntory Holdings Limited, Red Bull GmbH, Halewood International South Africa (Pty) Ltd, The Coca-Cola Company.
3. What are the main segments of the Africa Energy Drinks Market?
The market segments include Soft Drink Type, Packaging Type, Distribution Channel.
4. Can you provide details about the market size?
The market size is estimated to be USD 3.65 billion as of 2022.
5. What are some drivers contributing to market growth?
Increasing Demand for Protein-Rich Food; Increasing Demand for Plant-Based and Organic Ingredients.
6. What are the notable trends driving market growth?
OTHER KEY INDUSTRY TRENDS COVERED IN THE REPORT.
7. Are there any restraints impacting market growth?
Presence of Counterfeit Products.
8. Can you provide examples of recent developments in the market?
October 2023: Miss South Africa Natasha Joubert has expanded her business venture by collaborating with the MoFaya energy drink business. Joubert has launched the Berry Queen-flavoured energy drink under the MoFaya energy drink brand.October 2023: Switch Energy Drink introduced 3 new flavors in the African region. The three new limited-edition flavors are Sour Worms, Naartjie & Grape, and Kiwi, Mango & Strawberry.September 2023: Switch Energy Drink launched a special limited-edition flavor in celebration of South African Heritage Day. As a brand deeply rooted in the South African spirit, Switch Energy Drink is excited to contribute to the festivities with this special edition.
9. What pricing options are available for accessing the report?
Pricing options include single-user, multi-user, and enterprise licenses priced at USD 3800, USD 4500, and USD 5800 respectively.
10. Is the market size provided in terms of value or volume?
The market size is provided in terms of value, measured in billion and volume, measured in K Tons.
11. Are there any specific market keywords associated with the report?
Yes, the market keyword associated with the report is "Africa Energy Drinks Market," which aids in identifying and referencing the specific market segment covered.
12. How do I determine which pricing option suits my needs best?
The pricing options vary based on user requirements and access needs. Individual users may opt for single-user licenses, while businesses requiring broader access may choose multi-user or enterprise licenses for cost-effective access to the report.
13. Are there any additional resources or data provided in the Africa Energy Drinks Market report?
While the report offers comprehensive insights, it's advisable to review the specific contents or supplementary materials provided to ascertain if additional resources or data are available.
14. How can I stay updated on further developments or reports in the Africa Energy Drinks Market?
To stay informed about further developments, trends, and reports in the Africa Energy Drinks Market, consider subscribing to industry newsletters, following relevant companies and organizations, or regularly checking reputable industry news sources and publications.
Methodology
Step 1 - Identification of Relevant Samples Size from Population Database


Step 2 - Approaches for Defining Global Market Size (Value, Volume* & Price*)

Note*: In applicable scenarios
Step 3 - Data Sources
Primary Research
- Web Analytics
- Survey Reports
- Research Institute
- Latest Research Reports
- Opinion Leaders
Secondary Research
- Annual Reports
- White Paper
- Latest Press Release
- Industry Association
- Paid Database
- Investor Presentations

Step 4 - Data Triangulation
Involves using different sources of information in order to increase the validity of a study
These sources are likely to be stakeholders in a program - participants, other researchers, program staff, other community members, and so on.
Then we put all data in single framework & apply various statistical tools to find out the dynamic on the market.
During the analysis stage, feedback from the stakeholder groups would be compared to determine areas of agreement as well as areas of divergence