

Key Insights
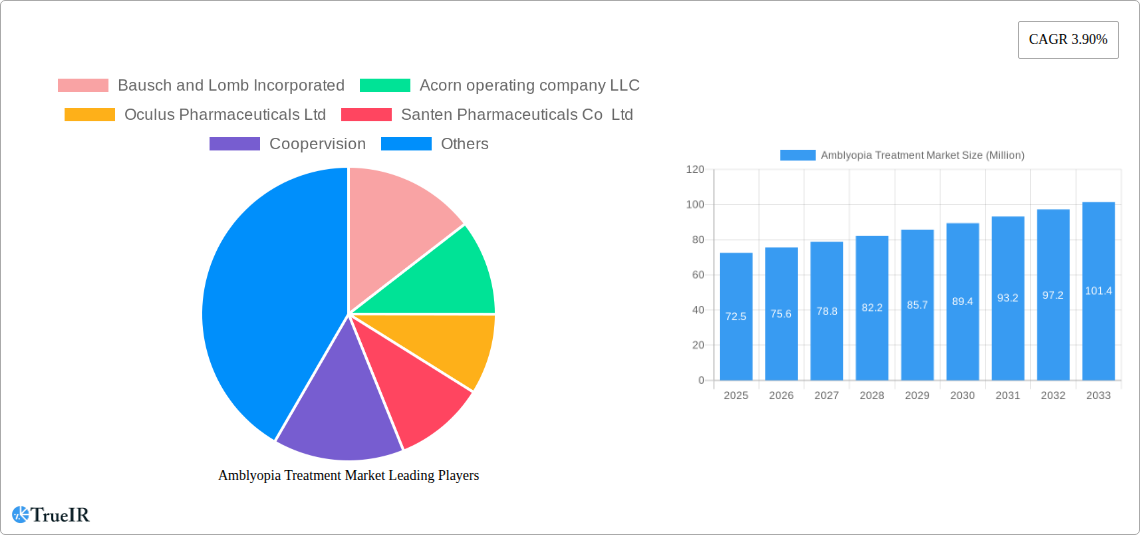
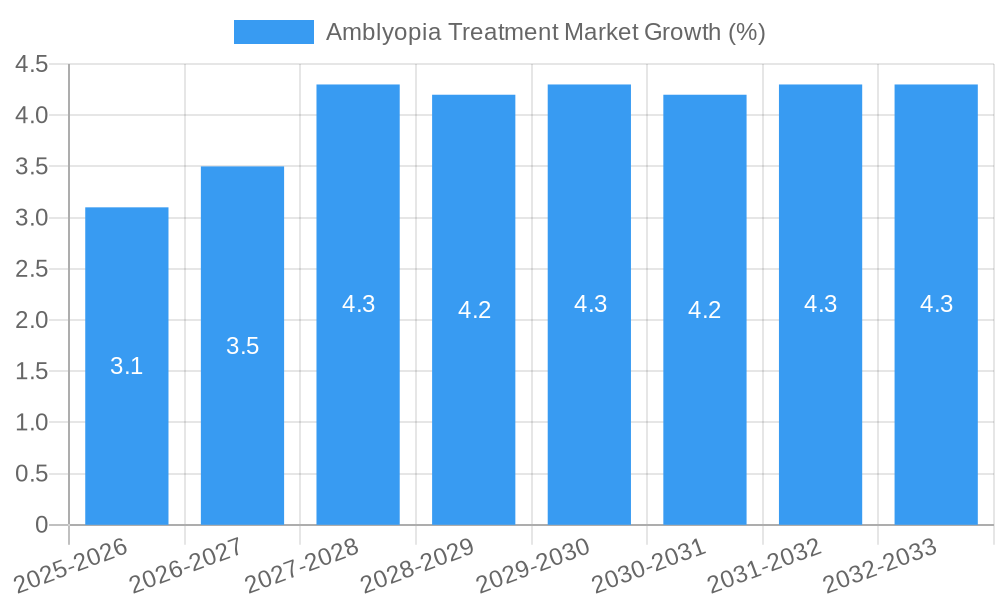
The global amblyopia treatment market, valued at $72.5 million in 2025, is projected to experience steady growth, driven by increasing awareness of the condition and advancements in treatment technologies. A compound annual growth rate (CAGR) of 3.90% from 2025 to 2033 indicates a substantial market expansion over the forecast period. Key drivers include the rising prevalence of amblyopia, particularly in children, coupled with the growing adoption of effective therapeutic interventions like vision therapy, patching, and pharmacological treatments. Furthermore, technological advancements in diagnostic tools and personalized treatment approaches are contributing to market growth. However, factors such as the high cost of advanced treatments and the relatively long treatment duration could pose challenges to market expansion. The market is segmented by treatment type (vision therapy, patching, pharmacological interventions, surgical procedures), age group (pediatric, adult), and distribution channel (hospitals, ophthalmology clinics, home-based treatments). Competitive landscape analysis reveals key players such as Bausch + Lomb, CooperVision, and Santen Pharmaceuticals, constantly innovating to offer advanced and effective solutions. The market's growth is expected to be geographically diverse, with regions such as North America and Europe leading due to high healthcare expenditure and technological advancements. However, emerging economies are also expected to show significant growth potential due to increasing healthcare awareness and rising disposable incomes. This makes amblyopia treatment a promising sector with significant investment potential, driven by both medical advancements and growing market demand.
The market's steady growth is likely influenced by several factors including improved healthcare infrastructure in developing nations, increased insurance coverage for vision-related treatments, and the rising prevalence of premature births which increase the risk of amblyopia. The competitive landscape fosters innovation, leading to improved treatment efficacy and patient outcomes. Future growth will depend on the successful development and market penetration of new treatments, improved access to care, and targeted public health campaigns to increase early diagnosis and treatment. The market is likely to witness a rise in digital therapeutics and telemedicine solutions, offering accessible and convenient treatment options. This technological shift can be leveraged to improve patient compliance and overall outcomes. A sustained focus on research and development activities is crucial for the long-term growth and advancement of this crucial sector aimed at improving visual acuity in affected individuals.
Amblyopia Treatment Market Report: 2019-2033
This comprehensive report provides a detailed analysis of the Amblyopia Treatment Market, offering invaluable insights for stakeholders, investors, and industry professionals. Covering the period from 2019 to 2033, with a focus on the base year 2025 and forecast period 2025-2033, this report meticulously examines market size, growth drivers, competitive dynamics, and future trends. The market is projected to reach xx Million by 2033, exhibiting a robust CAGR of xx% during the forecast period.
Amblyopia Treatment Market Structure & Competitive Landscape
The Amblyopia Treatment Market is characterized by a moderately concentrated landscape with several key players vying for market share. While a few dominant players hold significant market share, the market also presents opportunities for smaller, specialized companies. The market structure is influenced by factors such as regulatory approvals, technological advancements, and the rising prevalence of amblyopia. The Herfindahl-Hirschman Index (HHI) for 2025 is estimated to be xx, indicating a moderately concentrated market. Innovation drives competition, with companies continuously developing advanced treatment methods. Regulatory approvals from agencies like the FDA significantly impact market entry and product acceptance. Substitute treatments, such as corrective lenses and surgeries, also affect market dynamics. The market comprises various end-users, including ophthalmologists, optometrists, and hospitals. The recent years have witnessed several mergers and acquisitions (M&A), with xx deals recorded between 2019 and 2024, totaling an estimated value of xx Million.
- Market Concentration: Moderately concentrated, with an estimated HHI of xx in 2025.
- Innovation Drivers: Continuous development of advanced treatment methods, including VR and software-based therapies.
- Regulatory Impacts: Stringent regulatory approvals significantly influence market entry and product acceptance.
- Product Substitutes: Corrective lenses and surgical interventions compete with amblyopia treatment methods.
- End-User Segmentation: Ophthalmologists, optometrists, hospitals, and clinics form the major end-user segments.
- M&A Trends: xx M&A deals recorded between 2019 and 2024, totaling an estimated value of xx Million.
Amblyopia Treatment Market Trends & Opportunities
The Amblyopia Treatment Market is experiencing significant growth driven by several key trends. The increasing prevalence of amblyopia, particularly in children, is a primary driver. Technological advancements, such as the development of virtual reality (VR) and gamified therapies, are revolutionizing treatment methods, offering more engaging and effective solutions. Consumer preference for less invasive and more convenient treatment options is fueling the demand for innovative therapies. Competitive dynamics are characterized by intense R&D efforts, strategic partnerships, and product innovation. The market penetration rate for advanced therapies is expected to increase significantly from xx% in 2025 to xx% by 2033. The overall market size is projected to grow from xx Million in 2025 to xx Million by 2033, demonstrating a significant CAGR of xx%. The shift toward personalized medicine and the growing adoption of telehealth further contribute to market growth.
Dominant Markets & Segments in Amblyopia Treatment Market
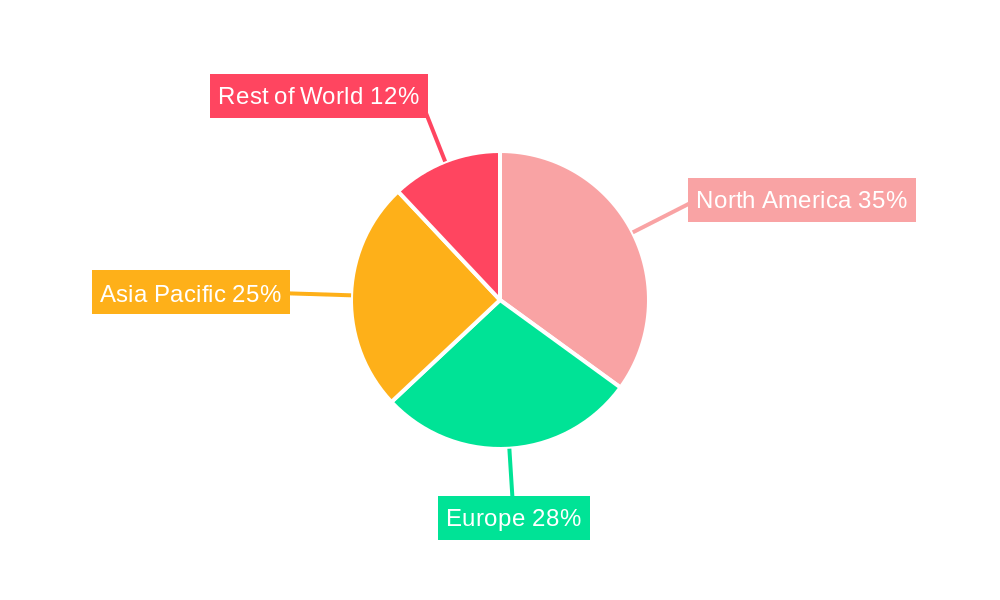
The North American region is currently the dominant market for amblyopia treatment, driven by several factors. Strong healthcare infrastructure, high disposable incomes, and increased awareness of amblyopia among healthcare professionals and the public contribute to this dominance. However, the Asia-Pacific region is exhibiting the fastest growth rate, fueled by rapid economic development and growing healthcare expenditure.
Key Growth Drivers in North America:
- Robust healthcare infrastructure and advanced medical facilities.
- High level of awareness among healthcare professionals and the public.
- Significant investments in R&D and technological advancements.
- Favorable regulatory environment and supportive government policies.
Key Growth Drivers in Asia-Pacific:
- Rapid economic growth and increasing disposable incomes.
- Growing healthcare expenditure and investments in healthcare infrastructure.
- High prevalence of amblyopia, particularly in developing countries.
- Rising adoption of technologically advanced treatments.
A detailed analysis of market dominance in individual countries is included in the full report.
Amblyopia Treatment Market Product Analysis
The Amblyopia Treatment Market offers a diverse range of products, including eye patches, glasses with specialized lenses (like Frensel prisms), vision therapy software, and virtual reality (VR) based applications. Recent innovations have focused on improving adherence and effectiveness through gamification and personalized treatment plans. The market is witnessing a shift towards less invasive, user-friendly, and technology-driven solutions. The success of these products hinges on their efficacy, ease of use, affordability, and overall patient experience. The competitive advantage lies in providing superior treatment outcomes, enhancing patient compliance, and offering convenient access to care.
Key Drivers, Barriers & Challenges in Amblyopia Treatment Market
Key Drivers:
- Increasing prevalence of amblyopia, particularly in children.
- Technological advancements leading to more effective and engaging treatment options.
- Growing awareness among healthcare professionals and the general public about amblyopia.
- Increased healthcare expenditure and investments in ophthalmic care.
Key Challenges:
- High cost of advanced treatments, limiting access for some patients.
- Regulatory hurdles and stringent approval processes for new therapies.
- Lack of awareness and early diagnosis in certain regions, leading to delayed treatment.
- Potential side effects and complications associated with certain treatments. The market is estimated to experience a xx% reduction in growth due to these challenges over the next decade.
Growth Drivers in the Amblyopia Treatment Market
The Amblyopia Treatment Market is propelled by technological advancements, improved diagnostics, and growing awareness. The development of innovative treatment methods, such as VR and gamified therapies, increases treatment adherence and efficacy. Increased healthcare spending fuels the adoption of advanced treatments. Favorable regulatory frameworks facilitate market access for new therapies.
Challenges Impacting Amblyopia Treatment Market Growth
Challenges include high treatment costs, regulatory complexities, and competition from established therapies. The cost of VR and other advanced technologies limits access for many patients. Stringent regulatory processes can delay product approvals and market entry. Competition from traditional treatments like eye patches presents challenges. These factors combine to potentially hinder the market's growth rate by xx% in the next five years.
Key Players Shaping the Amblyopia Treatment Market
- Bausch and Lomb Incorporated
- Acorn operating company LLC
- Oculus Pharmaceuticals Ltd
- Santen Pharmaceuticals Co Ltd
- Coopervision
- Frensel prism and lens Co
- Hilco Vision
- Good-Lite
- Vivid Vision Inc
- Krafty Eye patches
- Hoya Vision Care
- Orthopad USA
- *List Not Exhaustive
Significant Amblyopia Treatment Market Industry Milestones
- October 2023: Bynocs launched AmblyGo, a vision therapy software program utilizing 3D anaglyph glasses for amblyopia treatment. This marks a significant step towards gamified and more engaging therapy.
- January 2023: InnoJin Inc., Sumitomo Corporation, and ImaCreate Co. Ltd partnered to develop a VR amblyopia treatment app for children. This highlights the growing interest in VR-based solutions for amblyopia.
Future Outlook for Amblyopia Treatment Market
The Amblyopia Treatment Market exhibits strong future growth potential, driven by ongoing technological advancements, rising prevalence of amblyopia, and increasing healthcare expenditure. The adoption of personalized medicine and telehealth will further accelerate market growth. Strategic partnerships and collaborations are expected to lead to innovative products and therapies, creating significant opportunities for market expansion. The market is projected to achieve substantial growth over the forecast period, offering promising prospects for industry players.
Amblyopia Treatment Market Segmentation
-
1. Type
- 1.1. Strabismic Amblyopia
- 1.2. Refractive Ambylopia
- 1.3. Deprivation Amblyopia
-
2. Treatment Products
- 2.1. Eye Patches
- 2.2. Atropine Drops
- 2.3. Glasses
- 2.4. Video Games
Amblyopia Treatment Market Segmentation By Geography
-
1. North America
- 1.1. United States
- 1.2. Canada
- 1.3. Mexico
-
2. Europe
- 2.1. Germany
- 2.2. United Kingdom
- 2.3. France
- 2.4. Italy
- 2.5. Spain
- 2.6. Rest of Europe
-
3. Asia Pacific
- 3.1. China
- 3.2. Japan
- 3.3. India
- 3.4. Australia
- 3.5. South Korea
- 3.6. Rest of Asia Pacific
-
4. Middle East and Africa
- 4.1. GCC
- 4.2. South Africa
- 4.3. Rest of Middle East and Africa
-
5. South America
- 5.1. Brazil
- 5.2. Argentina
- 5.3. Rest of South America
Amblyopia Treatment Market REPORT HIGHLIGHTS
| Aspects | Details |
|---|---|
| Study Period | 2019-2033 |
| Base Year | 2024 |
| Estimated Year | 2025 |
| Forecast Period | 2025-2033 |
| Historical Period | 2019-2024 |
| Growth Rate | CAGR of 3.90% from 2019-2033 |
| Segmentation |
|
Table of Contents
- 1. Introduction
- 1.1. Research Scope
- 1.2. Market Segmentation
- 1.3. Research Methodology
- 1.4. Definitions and Assumptions
- 2. Executive Summary
- 2.1. Introduction
- 3. Market Dynamics
- 3.1. Introduction
- 3.2. Market Drivers
- 3.2.1. Rising Prevalence of Amblyopia; Increasing Technological Advancements for the Treatment of Amblyopia
- 3.3. Market Restrains
- 3.3.1. Rising Prevalence of Amblyopia; Increasing Technological Advancements for the Treatment of Amblyopia
- 3.4. Market Trends
- 3.4.1. The Strabismic Amblyopia Segment is Expected to Hold a Significant Market Share in the Amblyopia Treatment Market
- 4. Market Factor Analysis
- 4.1. Porters Five Forces
- 4.2. Supply/Value Chain
- 4.3. PESTEL analysis
- 4.4. Market Entropy
- 4.5. Patent/Trademark Analysis
- 5. Global Amblyopia Treatment Market Analysis, Insights and Forecast, 2019-2031
- 5.1. Market Analysis, Insights and Forecast - by Type
- 5.1.1. Strabismic Amblyopia
- 5.1.2. Refractive Ambylopia
- 5.1.3. Deprivation Amblyopia
- 5.2. Market Analysis, Insights and Forecast - by Treatment Products
- 5.2.1. Eye Patches
- 5.2.2. Atropine Drops
- 5.2.3. Glasses
- 5.2.4. Video Games
- 5.3. Market Analysis, Insights and Forecast - by Region
- 5.3.1. North America
- 5.3.2. Europe
- 5.3.3. Asia Pacific
- 5.3.4. Middle East and Africa
- 5.3.5. South America
- 5.1. Market Analysis, Insights and Forecast - by Type
- 6. North America Amblyopia Treatment Market Analysis, Insights and Forecast, 2019-2031
- 6.1. Market Analysis, Insights and Forecast - by Type
- 6.1.1. Strabismic Amblyopia
- 6.1.2. Refractive Ambylopia
- 6.1.3. Deprivation Amblyopia
- 6.2. Market Analysis, Insights and Forecast - by Treatment Products
- 6.2.1. Eye Patches
- 6.2.2. Atropine Drops
- 6.2.3. Glasses
- 6.2.4. Video Games
- 6.1. Market Analysis, Insights and Forecast - by Type
- 7. Europe Amblyopia Treatment Market Analysis, Insights and Forecast, 2019-2031
- 7.1. Market Analysis, Insights and Forecast - by Type
- 7.1.1. Strabismic Amblyopia
- 7.1.2. Refractive Ambylopia
- 7.1.3. Deprivation Amblyopia
- 7.2. Market Analysis, Insights and Forecast - by Treatment Products
- 7.2.1. Eye Patches
- 7.2.2. Atropine Drops
- 7.2.3. Glasses
- 7.2.4. Video Games
- 7.1. Market Analysis, Insights and Forecast - by Type
- 8. Asia Pacific Amblyopia Treatment Market Analysis, Insights and Forecast, 2019-2031
- 8.1. Market Analysis, Insights and Forecast - by Type
- 8.1.1. Strabismic Amblyopia
- 8.1.2. Refractive Ambylopia
- 8.1.3. Deprivation Amblyopia
- 8.2. Market Analysis, Insights and Forecast - by Treatment Products
- 8.2.1. Eye Patches
- 8.2.2. Atropine Drops
- 8.2.3. Glasses
- 8.2.4. Video Games
- 8.1. Market Analysis, Insights and Forecast - by Type
- 9. Middle East and Africa Amblyopia Treatment Market Analysis, Insights and Forecast, 2019-2031
- 9.1. Market Analysis, Insights and Forecast - by Type
- 9.1.1. Strabismic Amblyopia
- 9.1.2. Refractive Ambylopia
- 9.1.3. Deprivation Amblyopia
- 9.2. Market Analysis, Insights and Forecast - by Treatment Products
- 9.2.1. Eye Patches
- 9.2.2. Atropine Drops
- 9.2.3. Glasses
- 9.2.4. Video Games
- 9.1. Market Analysis, Insights and Forecast - by Type
- 10. South America Amblyopia Treatment Market Analysis, Insights and Forecast, 2019-2031
- 10.1. Market Analysis, Insights and Forecast - by Type
- 10.1.1. Strabismic Amblyopia
- 10.1.2. Refractive Ambylopia
- 10.1.3. Deprivation Amblyopia
- 10.2. Market Analysis, Insights and Forecast - by Treatment Products
- 10.2.1. Eye Patches
- 10.2.2. Atropine Drops
- 10.2.3. Glasses
- 10.2.4. Video Games
- 10.1. Market Analysis, Insights and Forecast - by Type
- 11. Competitive Analysis
- 11.1. Global Market Share Analysis 2024
- 11.2. Company Profiles
- 11.2.1 Bausch and Lomb Incorporated
- 11.2.1.1. Overview
- 11.2.1.2. Products
- 11.2.1.3. SWOT Analysis
- 11.2.1.4. Recent Developments
- 11.2.1.5. Financials (Based on Availability)
- 11.2.2 Acorn operating company LLC
- 11.2.2.1. Overview
- 11.2.2.2. Products
- 11.2.2.3. SWOT Analysis
- 11.2.2.4. Recent Developments
- 11.2.2.5. Financials (Based on Availability)
- 11.2.3 Oculus Pharmaceuticals Ltd
- 11.2.3.1. Overview
- 11.2.3.2. Products
- 11.2.3.3. SWOT Analysis
- 11.2.3.4. Recent Developments
- 11.2.3.5. Financials (Based on Availability)
- 11.2.4 Santen Pharmaceuticals Co Ltd
- 11.2.4.1. Overview
- 11.2.4.2. Products
- 11.2.4.3. SWOT Analysis
- 11.2.4.4. Recent Developments
- 11.2.4.5. Financials (Based on Availability)
- 11.2.5 Coopervision
- 11.2.5.1. Overview
- 11.2.5.2. Products
- 11.2.5.3. SWOT Analysis
- 11.2.5.4. Recent Developments
- 11.2.5.5. Financials (Based on Availability)
- 11.2.6 Frensel prism and lens Co
- 11.2.6.1. Overview
- 11.2.6.2. Products
- 11.2.6.3. SWOT Analysis
- 11.2.6.4. Recent Developments
- 11.2.6.5. Financials (Based on Availability)
- 11.2.7 Hilco Vision
- 11.2.7.1. Overview
- 11.2.7.2. Products
- 11.2.7.3. SWOT Analysis
- 11.2.7.4. Recent Developments
- 11.2.7.5. Financials (Based on Availability)
- 11.2.8 Good-Lite
- 11.2.8.1. Overview
- 11.2.8.2. Products
- 11.2.8.3. SWOT Analysis
- 11.2.8.4. Recent Developments
- 11.2.8.5. Financials (Based on Availability)
- 11.2.9 Vivid Vision Inc
- 11.2.9.1. Overview
- 11.2.9.2. Products
- 11.2.9.3. SWOT Analysis
- 11.2.9.4. Recent Developments
- 11.2.9.5. Financials (Based on Availability)
- 11.2.10 Krafty Eye patches
- 11.2.10.1. Overview
- 11.2.10.2. Products
- 11.2.10.3. SWOT Analysis
- 11.2.10.4. Recent Developments
- 11.2.10.5. Financials (Based on Availability)
- 11.2.11 Hoya Vision Care
- 11.2.11.1. Overview
- 11.2.11.2. Products
- 11.2.11.3. SWOT Analysis
- 11.2.11.4. Recent Developments
- 11.2.11.5. Financials (Based on Availability)
- 11.2.12 Orthopad USA*List Not Exhaustive
- 11.2.12.1. Overview
- 11.2.12.2. Products
- 11.2.12.3. SWOT Analysis
- 11.2.12.4. Recent Developments
- 11.2.12.5. Financials (Based on Availability)
- 11.2.1 Bausch and Lomb Incorporated
List of Figures
- Figure 1: Global Amblyopia Treatment Market Revenue Breakdown (Million, %) by Region 2024 & 2032
- Figure 2: Global Amblyopia Treatment Market Volume Breakdown (Million, %) by Region 2024 & 2032
- Figure 3: North America Amblyopia Treatment Market Revenue (Million), by Type 2024 & 2032
- Figure 4: North America Amblyopia Treatment Market Volume (Million), by Type 2024 & 2032
- Figure 5: North America Amblyopia Treatment Market Revenue Share (%), by Type 2024 & 2032
- Figure 6: North America Amblyopia Treatment Market Volume Share (%), by Type 2024 & 2032
- Figure 7: North America Amblyopia Treatment Market Revenue (Million), by Treatment Products 2024 & 2032
- Figure 8: North America Amblyopia Treatment Market Volume (Million), by Treatment Products 2024 & 2032
- Figure 9: North America Amblyopia Treatment Market Revenue Share (%), by Treatment Products 2024 & 2032
- Figure 10: North America Amblyopia Treatment Market Volume Share (%), by Treatment Products 2024 & 2032
- Figure 11: North America Amblyopia Treatment Market Revenue (Million), by Country 2024 & 2032
- Figure 12: North America Amblyopia Treatment Market Volume (Million), by Country 2024 & 2032
- Figure 13: North America Amblyopia Treatment Market Revenue Share (%), by Country 2024 & 2032
- Figure 14: North America Amblyopia Treatment Market Volume Share (%), by Country 2024 & 2032
- Figure 15: Europe Amblyopia Treatment Market Revenue (Million), by Type 2024 & 2032
- Figure 16: Europe Amblyopia Treatment Market Volume (Million), by Type 2024 & 2032
- Figure 17: Europe Amblyopia Treatment Market Revenue Share (%), by Type 2024 & 2032
- Figure 18: Europe Amblyopia Treatment Market Volume Share (%), by Type 2024 & 2032
- Figure 19: Europe Amblyopia Treatment Market Revenue (Million), by Treatment Products 2024 & 2032
- Figure 20: Europe Amblyopia Treatment Market Volume (Million), by Treatment Products 2024 & 2032
- Figure 21: Europe Amblyopia Treatment Market Revenue Share (%), by Treatment Products 2024 & 2032
- Figure 22: Europe Amblyopia Treatment Market Volume Share (%), by Treatment Products 2024 & 2032
- Figure 23: Europe Amblyopia Treatment Market Revenue (Million), by Country 2024 & 2032
- Figure 24: Europe Amblyopia Treatment Market Volume (Million), by Country 2024 & 2032
- Figure 25: Europe Amblyopia Treatment Market Revenue Share (%), by Country 2024 & 2032
- Figure 26: Europe Amblyopia Treatment Market Volume Share (%), by Country 2024 & 2032
- Figure 27: Asia Pacific Amblyopia Treatment Market Revenue (Million), by Type 2024 & 2032
- Figure 28: Asia Pacific Amblyopia Treatment Market Volume (Million), by Type 2024 & 2032
- Figure 29: Asia Pacific Amblyopia Treatment Market Revenue Share (%), by Type 2024 & 2032
- Figure 30: Asia Pacific Amblyopia Treatment Market Volume Share (%), by Type 2024 & 2032
- Figure 31: Asia Pacific Amblyopia Treatment Market Revenue (Million), by Treatment Products 2024 & 2032
- Figure 32: Asia Pacific Amblyopia Treatment Market Volume (Million), by Treatment Products 2024 & 2032
- Figure 33: Asia Pacific Amblyopia Treatment Market Revenue Share (%), by Treatment Products 2024 & 2032
- Figure 34: Asia Pacific Amblyopia Treatment Market Volume Share (%), by Treatment Products 2024 & 2032
- Figure 35: Asia Pacific Amblyopia Treatment Market Revenue (Million), by Country 2024 & 2032
- Figure 36: Asia Pacific Amblyopia Treatment Market Volume (Million), by Country 2024 & 2032
- Figure 37: Asia Pacific Amblyopia Treatment Market Revenue Share (%), by Country 2024 & 2032
- Figure 38: Asia Pacific Amblyopia Treatment Market Volume Share (%), by Country 2024 & 2032
- Figure 39: Middle East and Africa Amblyopia Treatment Market Revenue (Million), by Type 2024 & 2032
- Figure 40: Middle East and Africa Amblyopia Treatment Market Volume (Million), by Type 2024 & 2032
- Figure 41: Middle East and Africa Amblyopia Treatment Market Revenue Share (%), by Type 2024 & 2032
- Figure 42: Middle East and Africa Amblyopia Treatment Market Volume Share (%), by Type 2024 & 2032
- Figure 43: Middle East and Africa Amblyopia Treatment Market Revenue (Million), by Treatment Products 2024 & 2032
- Figure 44: Middle East and Africa Amblyopia Treatment Market Volume (Million), by Treatment Products 2024 & 2032
- Figure 45: Middle East and Africa Amblyopia Treatment Market Revenue Share (%), by Treatment Products 2024 & 2032
- Figure 46: Middle East and Africa Amblyopia Treatment Market Volume Share (%), by Treatment Products 2024 & 2032
- Figure 47: Middle East and Africa Amblyopia Treatment Market Revenue (Million), by Country 2024 & 2032
- Figure 48: Middle East and Africa Amblyopia Treatment Market Volume (Million), by Country 2024 & 2032
- Figure 49: Middle East and Africa Amblyopia Treatment Market Revenue Share (%), by Country 2024 & 2032
- Figure 50: Middle East and Africa Amblyopia Treatment Market Volume Share (%), by Country 2024 & 2032
- Figure 51: South America Amblyopia Treatment Market Revenue (Million), by Type 2024 & 2032
- Figure 52: South America Amblyopia Treatment Market Volume (Million), by Type 2024 & 2032
- Figure 53: South America Amblyopia Treatment Market Revenue Share (%), by Type 2024 & 2032
- Figure 54: South America Amblyopia Treatment Market Volume Share (%), by Type 2024 & 2032
- Figure 55: South America Amblyopia Treatment Market Revenue (Million), by Treatment Products 2024 & 2032
- Figure 56: South America Amblyopia Treatment Market Volume (Million), by Treatment Products 2024 & 2032
- Figure 57: South America Amblyopia Treatment Market Revenue Share (%), by Treatment Products 2024 & 2032
- Figure 58: South America Amblyopia Treatment Market Volume Share (%), by Treatment Products 2024 & 2032
- Figure 59: South America Amblyopia Treatment Market Revenue (Million), by Country 2024 & 2032
- Figure 60: South America Amblyopia Treatment Market Volume (Million), by Country 2024 & 2032
- Figure 61: South America Amblyopia Treatment Market Revenue Share (%), by Country 2024 & 2032
- Figure 62: South America Amblyopia Treatment Market Volume Share (%), by Country 2024 & 2032
List of Tables
- Table 1: Global Amblyopia Treatment Market Revenue Million Forecast, by Region 2019 & 2032
- Table 2: Global Amblyopia Treatment Market Volume Million Forecast, by Region 2019 & 2032
- Table 3: Global Amblyopia Treatment Market Revenue Million Forecast, by Type 2019 & 2032
- Table 4: Global Amblyopia Treatment Market Volume Million Forecast, by Type 2019 & 2032
- Table 5: Global Amblyopia Treatment Market Revenue Million Forecast, by Treatment Products 2019 & 2032
- Table 6: Global Amblyopia Treatment Market Volume Million Forecast, by Treatment Products 2019 & 2032
- Table 7: Global Amblyopia Treatment Market Revenue Million Forecast, by Region 2019 & 2032
- Table 8: Global Amblyopia Treatment Market Volume Million Forecast, by Region 2019 & 2032
- Table 9: Global Amblyopia Treatment Market Revenue Million Forecast, by Type 2019 & 2032
- Table 10: Global Amblyopia Treatment Market Volume Million Forecast, by Type 2019 & 2032
- Table 11: Global Amblyopia Treatment Market Revenue Million Forecast, by Treatment Products 2019 & 2032
- Table 12: Global Amblyopia Treatment Market Volume Million Forecast, by Treatment Products 2019 & 2032
- Table 13: Global Amblyopia Treatment Market Revenue Million Forecast, by Country 2019 & 2032
- Table 14: Global Amblyopia Treatment Market Volume Million Forecast, by Country 2019 & 2032
- Table 15: United States Amblyopia Treatment Market Revenue (Million) Forecast, by Application 2019 & 2032
- Table 16: United States Amblyopia Treatment Market Volume (Million) Forecast, by Application 2019 & 2032
- Table 17: Canada Amblyopia Treatment Market Revenue (Million) Forecast, by Application 2019 & 2032
- Table 18: Canada Amblyopia Treatment Market Volume (Million) Forecast, by Application 2019 & 2032
- Table 19: Mexico Amblyopia Treatment Market Revenue (Million) Forecast, by Application 2019 & 2032
- Table 20: Mexico Amblyopia Treatment Market Volume (Million) Forecast, by Application 2019 & 2032
- Table 21: Global Amblyopia Treatment Market Revenue Million Forecast, by Type 2019 & 2032
- Table 22: Global Amblyopia Treatment Market Volume Million Forecast, by Type 2019 & 2032
- Table 23: Global Amblyopia Treatment Market Revenue Million Forecast, by Treatment Products 2019 & 2032
- Table 24: Global Amblyopia Treatment Market Volume Million Forecast, by Treatment Products 2019 & 2032
- Table 25: Global Amblyopia Treatment Market Revenue Million Forecast, by Country 2019 & 2032
- Table 26: Global Amblyopia Treatment Market Volume Million Forecast, by Country 2019 & 2032
- Table 27: Germany Amblyopia Treatment Market Revenue (Million) Forecast, by Application 2019 & 2032
- Table 28: Germany Amblyopia Treatment Market Volume (Million) Forecast, by Application 2019 & 2032
- Table 29: United Kingdom Amblyopia Treatment Market Revenue (Million) Forecast, by Application 2019 & 2032
- Table 30: United Kingdom Amblyopia Treatment Market Volume (Million) Forecast, by Application 2019 & 2032
- Table 31: France Amblyopia Treatment Market Revenue (Million) Forecast, by Application 2019 & 2032
- Table 32: France Amblyopia Treatment Market Volume (Million) Forecast, by Application 2019 & 2032
- Table 33: Italy Amblyopia Treatment Market Revenue (Million) Forecast, by Application 2019 & 2032
- Table 34: Italy Amblyopia Treatment Market Volume (Million) Forecast, by Application 2019 & 2032
- Table 35: Spain Amblyopia Treatment Market Revenue (Million) Forecast, by Application 2019 & 2032
- Table 36: Spain Amblyopia Treatment Market Volume (Million) Forecast, by Application 2019 & 2032
- Table 37: Rest of Europe Amblyopia Treatment Market Revenue (Million) Forecast, by Application 2019 & 2032
- Table 38: Rest of Europe Amblyopia Treatment Market Volume (Million) Forecast, by Application 2019 & 2032
- Table 39: Global Amblyopia Treatment Market Revenue Million Forecast, by Type 2019 & 2032
- Table 40: Global Amblyopia Treatment Market Volume Million Forecast, by Type 2019 & 2032
- Table 41: Global Amblyopia Treatment Market Revenue Million Forecast, by Treatment Products 2019 & 2032
- Table 42: Global Amblyopia Treatment Market Volume Million Forecast, by Treatment Products 2019 & 2032
- Table 43: Global Amblyopia Treatment Market Revenue Million Forecast, by Country 2019 & 2032
- Table 44: Global Amblyopia Treatment Market Volume Million Forecast, by Country 2019 & 2032
- Table 45: China Amblyopia Treatment Market Revenue (Million) Forecast, by Application 2019 & 2032
- Table 46: China Amblyopia Treatment Market Volume (Million) Forecast, by Application 2019 & 2032
- Table 47: Japan Amblyopia Treatment Market Revenue (Million) Forecast, by Application 2019 & 2032
- Table 48: Japan Amblyopia Treatment Market Volume (Million) Forecast, by Application 2019 & 2032
- Table 49: India Amblyopia Treatment Market Revenue (Million) Forecast, by Application 2019 & 2032
- Table 50: India Amblyopia Treatment Market Volume (Million) Forecast, by Application 2019 & 2032
- Table 51: Australia Amblyopia Treatment Market Revenue (Million) Forecast, by Application 2019 & 2032
- Table 52: Australia Amblyopia Treatment Market Volume (Million) Forecast, by Application 2019 & 2032
- Table 53: South Korea Amblyopia Treatment Market Revenue (Million) Forecast, by Application 2019 & 2032
- Table 54: South Korea Amblyopia Treatment Market Volume (Million) Forecast, by Application 2019 & 2032
- Table 55: Rest of Asia Pacific Amblyopia Treatment Market Revenue (Million) Forecast, by Application 2019 & 2032
- Table 56: Rest of Asia Pacific Amblyopia Treatment Market Volume (Million) Forecast, by Application 2019 & 2032
- Table 57: Global Amblyopia Treatment Market Revenue Million Forecast, by Type 2019 & 2032
- Table 58: Global Amblyopia Treatment Market Volume Million Forecast, by Type 2019 & 2032
- Table 59: Global Amblyopia Treatment Market Revenue Million Forecast, by Treatment Products 2019 & 2032
- Table 60: Global Amblyopia Treatment Market Volume Million Forecast, by Treatment Products 2019 & 2032
- Table 61: Global Amblyopia Treatment Market Revenue Million Forecast, by Country 2019 & 2032
- Table 62: Global Amblyopia Treatment Market Volume Million Forecast, by Country 2019 & 2032
- Table 63: GCC Amblyopia Treatment Market Revenue (Million) Forecast, by Application 2019 & 2032
- Table 64: GCC Amblyopia Treatment Market Volume (Million) Forecast, by Application 2019 & 2032
- Table 65: South Africa Amblyopia Treatment Market Revenue (Million) Forecast, by Application 2019 & 2032
- Table 66: South Africa Amblyopia Treatment Market Volume (Million) Forecast, by Application 2019 & 2032
- Table 67: Rest of Middle East and Africa Amblyopia Treatment Market Revenue (Million) Forecast, by Application 2019 & 2032
- Table 68: Rest of Middle East and Africa Amblyopia Treatment Market Volume (Million) Forecast, by Application 2019 & 2032
- Table 69: Global Amblyopia Treatment Market Revenue Million Forecast, by Type 2019 & 2032
- Table 70: Global Amblyopia Treatment Market Volume Million Forecast, by Type 2019 & 2032
- Table 71: Global Amblyopia Treatment Market Revenue Million Forecast, by Treatment Products 2019 & 2032
- Table 72: Global Amblyopia Treatment Market Volume Million Forecast, by Treatment Products 2019 & 2032
- Table 73: Global Amblyopia Treatment Market Revenue Million Forecast, by Country 2019 & 2032
- Table 74: Global Amblyopia Treatment Market Volume Million Forecast, by Country 2019 & 2032
- Table 75: Brazil Amblyopia Treatment Market Revenue (Million) Forecast, by Application 2019 & 2032
- Table 76: Brazil Amblyopia Treatment Market Volume (Million) Forecast, by Application 2019 & 2032
- Table 77: Argentina Amblyopia Treatment Market Revenue (Million) Forecast, by Application 2019 & 2032
- Table 78: Argentina Amblyopia Treatment Market Volume (Million) Forecast, by Application 2019 & 2032
- Table 79: Rest of South America Amblyopia Treatment Market Revenue (Million) Forecast, by Application 2019 & 2032
- Table 80: Rest of South America Amblyopia Treatment Market Volume (Million) Forecast, by Application 2019 & 2032
Frequently Asked Questions
1. What is the projected Compound Annual Growth Rate (CAGR) of the Amblyopia Treatment Market?
The projected CAGR is approximately 3.90%.
2. Which companies are prominent players in the Amblyopia Treatment Market?
Key companies in the market include Bausch and Lomb Incorporated, Acorn operating company LLC, Oculus Pharmaceuticals Ltd, Santen Pharmaceuticals Co Ltd, Coopervision, Frensel prism and lens Co, Hilco Vision, Good-Lite, Vivid Vision Inc, Krafty Eye patches, Hoya Vision Care, Orthopad USA*List Not Exhaustive.
3. What are the main segments of the Amblyopia Treatment Market?
The market segments include Type, Treatment Products.
4. Can you provide details about the market size?
The market size is estimated to be USD 72.5 Million as of 2022.
5. What are some drivers contributing to market growth?
Rising Prevalence of Amblyopia; Increasing Technological Advancements for the Treatment of Amblyopia.
6. What are the notable trends driving market growth?
The Strabismic Amblyopia Segment is Expected to Hold a Significant Market Share in the Amblyopia Treatment Market.
7. Are there any restraints impacting market growth?
Rising Prevalence of Amblyopia; Increasing Technological Advancements for the Treatment of Amblyopia.
8. Can you provide examples of recent developments in the market?
October 2023: Bynocs, a company that offers lazy eye treatment therapies, launched a vision therapy software program (AmblyGo) to treat amblyopia in the form of tailored computer games. The patient plays the games with both eyes open while wearing special 3D anaglyph glasses (with different color lenses) for 30 minutes over 30 sessions.
9. What pricing options are available for accessing the report?
Pricing options include single-user, multi-user, and enterprise licenses priced at USD 4750, USD 5250, and USD 8750 respectively.
10. Is the market size provided in terms of value or volume?
The market size is provided in terms of value, measured in Million and volume, measured in Million.
11. Are there any specific market keywords associated with the report?
Yes, the market keyword associated with the report is "Amblyopia Treatment Market," which aids in identifying and referencing the specific market segment covered.
12. How do I determine which pricing option suits my needs best?
The pricing options vary based on user requirements and access needs. Individual users may opt for single-user licenses, while businesses requiring broader access may choose multi-user or enterprise licenses for cost-effective access to the report.
13. Are there any additional resources or data provided in the Amblyopia Treatment Market report?
While the report offers comprehensive insights, it's advisable to review the specific contents or supplementary materials provided to ascertain if additional resources or data are available.
14. How can I stay updated on further developments or reports in the Amblyopia Treatment Market?
To stay informed about further developments, trends, and reports in the Amblyopia Treatment Market, consider subscribing to industry newsletters, following relevant companies and organizations, or regularly checking reputable industry news sources and publications.
Methodology
Step 1 - Identification of Relevant Samples Size from Population Database


Step 2 - Approaches for Defining Global Market Size (Value, Volume* & Price*)

Note*: In applicable scenarios
Step 3 - Data Sources
Primary Research
- Web Analytics
- Survey Reports
- Research Institute
- Latest Research Reports
- Opinion Leaders
Secondary Research
- Annual Reports
- White Paper
- Latest Press Release
- Industry Association
- Paid Database
- Investor Presentations

Step 4 - Data Triangulation
Involves using different sources of information in order to increase the validity of a study
These sources are likely to be stakeholders in a program - participants, other researchers, program staff, other community members, and so on.
Then we put all data in single framework & apply various statistical tools to find out the dynamic on the market.
During the analysis stage, feedback from the stakeholder groups would be compared to determine areas of agreement as well as areas of divergence
