

Key Insights
The global cell surface markers detection market is experiencing robust growth, driven by the increasing prevalence of chronic diseases, advancements in research and drug discovery, and the rising demand for personalized medicine. The market's compound annual growth rate (CAGR) of 8.20% from 2019 to 2024 suggests a significant expansion, projected to continue over the forecast period (2025-2033). Key segments within the market include flow cytometry, hematology analyzers, and cell imaging systems, with reagents and kits representing a significant portion of the consumables market. Applications span disease diagnosis and identification, research and drug discovery, particularly in oncology and immunology, where understanding cell surface markers is crucial for targeted therapies and disease monitoring. North America and Europe currently hold the largest market share, driven by robust healthcare infrastructure and technological advancements, but the Asia-Pacific region is projected to witness substantial growth due to rising healthcare expenditure and a growing awareness of advanced diagnostic techniques. Competition is fierce, with major players like Becton Dickinson, Thermo Fisher Scientific, and Roche leading the market through continuous innovation in technology and product offerings, while smaller companies focus on niche applications and specialized solutions. The market is further influenced by factors such as increasing government funding for research and development, and the growing adoption of point-of-care diagnostics, enabling faster and more efficient testing.
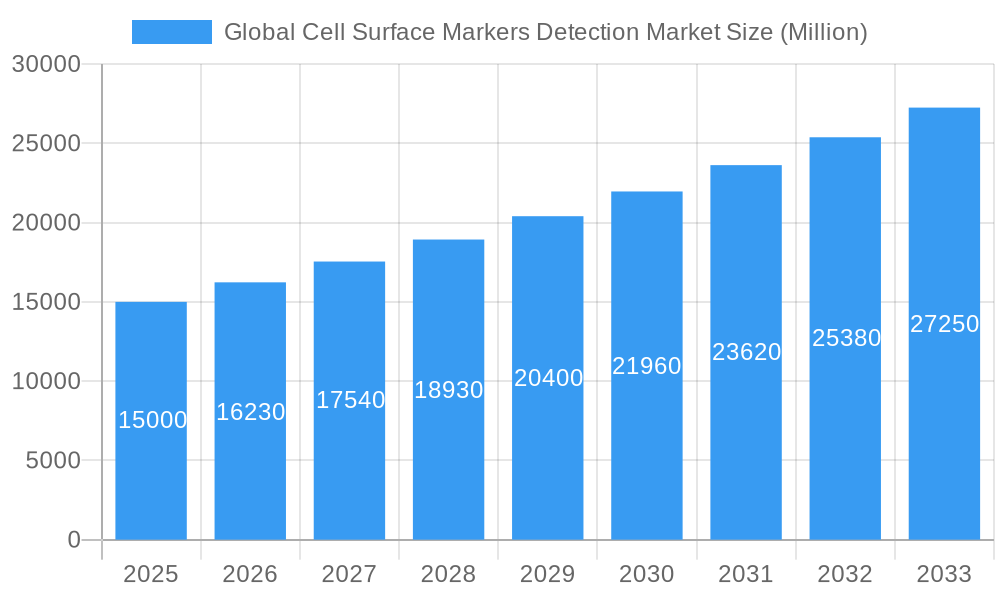
Global Cell Surface Markers Detection Market Market Size (In Billion)
The market's future trajectory hinges on several key factors. Continued technological advancements, such as the development of more sensitive and high-throughput detection systems, will drive further growth. The increasing demand for multiplex assays and automation will streamline workflows and reduce costs, making the technology more accessible. The regulatory landscape, including approvals for novel diagnostic tools, will play a significant role. Finally, the rising focus on data analytics and artificial intelligence in diagnostics will enable more accurate and timely interpretations of cell surface marker data, leading to improved patient outcomes. Strategic partnerships and mergers and acquisitions will continue shaping the competitive landscape, with companies investing in research and development to maintain a competitive edge. The market's potential for expansion is substantial, driven by unmet clinical needs and the continuous development of new therapeutic approaches dependent upon cellular analysis.
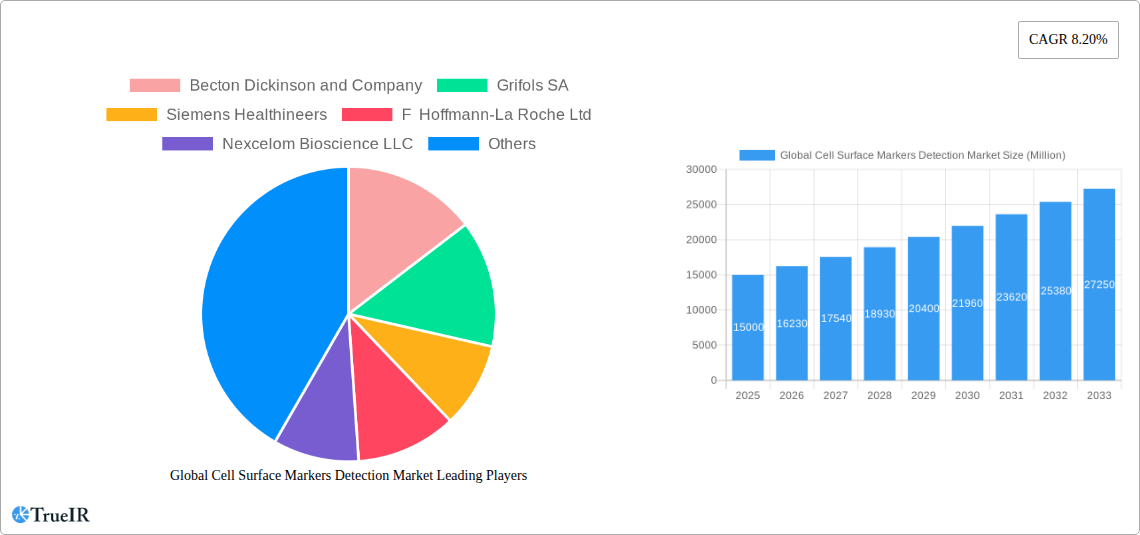
Global Cell Surface Markers Detection Market Company Market Share
Global Cell Surface Markers Detection Market: A Comprehensive Report (2019-2033)
This dynamic report provides a detailed analysis of the Global Cell Surface Markers Detection Market, offering invaluable insights for stakeholders across the life sciences industry. Covering the period from 2019 to 2033, with a focus on 2025, this comprehensive study examines market size, growth drivers, competitive dynamics, and future outlook. Leveraging extensive market research and data analysis, this report is essential for strategic decision-making and investment planning. The market is projected to reach xx Million by 2033.
Global Cell Surface Markers Detection Market Structure & Competitive Landscape
The global cell surface markers detection market exhibits a moderately consolidated structure. Major players, including Becton Dickinson and Company, Grifols SA, Siemens Healthineers, F Hoffmann-La Roche Ltd, and Thermo Fisher Scientific Inc., hold significant market share, driving innovation and shaping market trends. The Herfindahl-Hirschman Index (HHI) for the market is estimated to be around xx, indicating moderate concentration.
- Innovation Drivers: Continuous advancements in flow cytometry, cell imaging systems, and reagent technologies are key innovation drivers. The development of novel markers and sophisticated analytical techniques fuels market growth.
- Regulatory Impacts: Stringent regulatory approvals (e.g., CE marking in Europe, FDA approval in the US) influence market entry and product adoption. Compliance requirements drive costs and impact timelines.
- Product Substitutes: While limited direct substitutes exist, alternative diagnostic methods and research techniques pose indirect competition. The market faces pressure to constantly innovate and enhance cost-effectiveness.
- End-User Segmentation: The market caters to diverse end-users including hospitals and clinics, research institutions, pharmaceutical companies, and biotechnology firms. Each segment presents unique market dynamics and growth opportunities.
- M&A Trends: The market has witnessed a moderate level of mergers and acquisitions (M&A) activity in recent years, with approximately xx deals recorded between 2019 and 2024. These activities reflect strategic consolidation and expansion efforts by key players. Strategic partnerships and collaborations are also increasingly prevalent.
Global Cell Surface Markers Detection Market Market Trends & Opportunities
The global cell surface markers detection market is experiencing robust growth, driven by several factors. The market size is estimated at xx Million in 2025, exhibiting a Compound Annual Growth Rate (CAGR) of xx% during the forecast period (2025-2033). This growth is fueled by rising prevalence of chronic diseases, increasing demand for advanced diagnostics, expanding research activities in immunology and oncology, and continuous technological advancements. Market penetration rates vary significantly across different regions and applications, with developed regions exhibiting higher penetration compared to emerging markets. The market is witnessing a shift towards automated and high-throughput technologies, enabling faster and more efficient analyses. Growing adoption of personalized medicine and point-of-care diagnostics further creates lucrative market opportunities. Competitive dynamics are shaped by product differentiation, technological advancements, strategic partnerships, and geographic expansion.
Dominant Markets & Segments in Global Cell Surface Markers Detection Market
The North American region currently dominates the global cell surface markers detection market, driven by robust healthcare infrastructure, high adoption rates of advanced technologies, and substantial funding for research and development. Europe follows as a significant market, while the Asia-Pacific region shows promising growth potential.
- Leading Product Segment: Flow cytometry currently holds the largest market share among various products due to its versatility and high throughput capabilities.
- Leading Application Segment: Disease diagnosis and identification represents the most significant application segment, owing to the critical role of cell surface markers in various diseases.
Key Growth Drivers (by Region):
- North America: Strong healthcare infrastructure, high research funding, and early adoption of advanced technologies.
- Europe: Significant investments in healthcare R&D, advanced diagnostic capabilities, and regulatory frameworks supporting technological adoption.
- Asia-Pacific: Rapidly growing healthcare sector, increasing prevalence of chronic diseases, and rising disposable incomes driving demand for advanced diagnostics.
Global Cell Surface Markers Detection Market Product Analysis
The market showcases diverse product offerings including flow cytometry systems, hematology analyzers, cell imaging systems, and reagents & kits. Technological advancements focus on improving sensitivity, specificity, automation, and ease of use. Flow cytometry systems continue to dominate due to their high throughput and multiparametric analysis capabilities, while cell imaging systems are gaining traction for their ability to provide detailed visual information about cell surface markers. The market is witnessing a gradual shift towards integrated platforms combining multiple technologies to offer comprehensive solutions.
Key Drivers, Barriers & Challenges in Global Cell Surface Markers Detection Market
Key Drivers: The rising prevalence of chronic diseases, increasing demand for early and accurate diagnosis, advancements in flow cytometry and cell imaging technologies, and rising investments in biomedical research are key drivers propelling market growth.
Key Challenges & Restraints: High costs associated with advanced technologies, stringent regulatory requirements, and the need for skilled personnel can hinder market expansion. Supply chain disruptions and competition from alternative diagnostic methods represent additional challenges. The market faces a xx% reduction in growth due to supply chain issues affecting reagent availability.
Growth Drivers in the Global Cell Surface Markers Detection Market Market
Technological advancements in flow cytometry and cell imaging, coupled with increasing investments in R&D and rising healthcare spending, are driving market growth. Government initiatives promoting advanced diagnostics and supportive regulatory frameworks further contribute to the expanding market.
Challenges Impacting Global Cell Surface Markers Detection Market Growth
Stringent regulatory pathways, the high cost of advanced instruments, and the need for skilled professionals pose significant challenges. Furthermore, competition from alternative diagnostic techniques and the potential for supply chain disruptions can impede market growth.
Key Players Shaping the Global Cell Surface Markers Detection Market Market
- Becton Dickinson and Company
- Grifols SA
- Siemens Healthineers
- F Hoffmann-La Roche Ltd
- Nexcelom Bioscience LLC
- Thermo Fisher Scientific Inc
- Abbott Laboratories
- Agilent Technologies Inc
- IVD Medical Holding Limited (Immucor Inc)
- Sysmex Corporation
- Diasorin SpA (Luminex Corporation)
- Qiagen NV
- Nihon Kohden Corporation
- Bio Rad Laboratories Inc
- Danaher Corporation (Beckman Coulter Inc)
Significant Global Cell Surface Markers Detection Market Industry Milestones
- April 2022: Sysmex Europe launched its Flow Cytometer XF-1600, receiving CE marking, signifying compliance with European IVD regulations. This launch expands the availability of advanced flow cytometry technology in Europe.
- April 2022: CytoSMART Technologies launched the CytoSMART Omni FL, a next-generation live-cell imaging system. This advancement enhances the capabilities of live-cell imaging, offering improved research capabilities in various biological fields.
Future Outlook for Global Cell Surface Markers Detection Market Market
The global cell surface markers detection market is poised for continued growth, driven by technological advancements, increasing healthcare spending, and the growing prevalence of chronic diseases. Strategic partnerships and collaborations among key players are expected to fuel innovation and market expansion. The rising adoption of personalized medicine and point-of-care diagnostics further presents significant opportunities for market growth. The market is expected to maintain a strong CAGR in the coming years.
Global Cell Surface Markers Detection Market Segmentation
-
1. Product
- 1.1. Flow Cytometry
- 1.2. Hematology Analyzers
- 1.3. Cell Imaging Systems
- 1.4. Reagents and Kits
- 1.5. Other Products
-
2. Application
- 2.1. Disease Diagnosis and Identification
- 2.2. Research and Drug Discovery
- 2.3. Other Applications
Global Cell Surface Markers Detection Market Segmentation By Geography
-
1. North America
- 1.1. United States
- 1.2. Canada
- 1.3. Mexico
-
2. Europe
- 2.1. Germany
- 2.2. United Kingdom
- 2.3. France
- 2.4. Italy
- 2.5. Spain
- 2.6. Rest of Europe
-
3. Asia Pacific
- 3.1. China
- 3.2. Japan
- 3.3. India
- 3.4. Australia
- 3.5. South Korea
- 3.6. Rest of Asia Pacific
-
4. Middle East and Africa
- 4.1. GCC
- 4.2. South Africa
- 4.3. Rest of Middle East and Africa
-
5. South America
- 5.1. Brazil
- 5.2. Argentina
- 5.3. Rest of South America
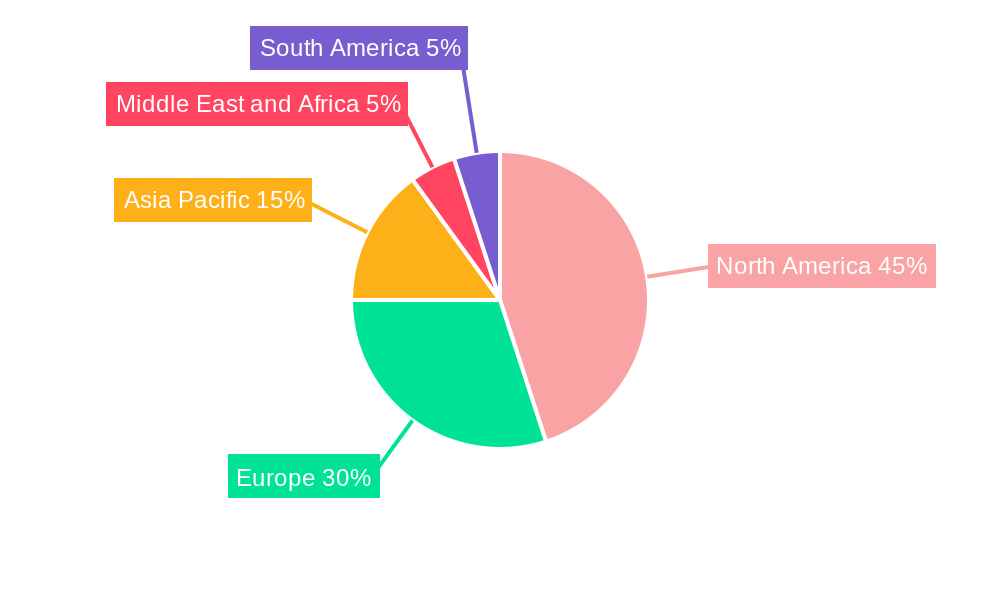
Global Cell Surface Markers Detection Market Regional Market Share
Geographic Coverage of Global Cell Surface Markers Detection Market
Global Cell Surface Markers Detection Market REPORT HIGHLIGHTS
| Aspects | Details |
|---|---|
| Study Period | 2020-2034 |
| Base Year | 2025 |
| Estimated Year | 2026 |
| Forecast Period | 2026-2034 |
| Historical Period | 2020-2025 |
| Growth Rate | CAGR of 8.20% from 2020-2034 |
| Segmentation |
|
Table of Contents
- 1. Introduction
- 1.1. Research Scope
- 1.2. Market Segmentation
- 1.3. Research Objective
- 1.4. Definitions and Assumptions
- 2. Executive Summary
- 2.1. Market Snapshot
- 3. Market Dynamics
- 3.1. Market Drivers
- 3.2. Market Restrains
- 3.3. Market Trends
- 3.4. Market Opportunities
- 4. Market Factor Analysis
- 4.1. Porters Five Forces
- 4.1.1. Bargaining Power of Suppliers
- 4.1.2. Bargaining Power of Buyers
- 4.1.3. Threat of New Entrants
- 4.1.4. Threat of Substitutes
- 4.1.5. Competitive Rivalry
- 4.2. PESTEL analysis
- 4.3. BCG Analysis
- 4.3.1. Stars (High Growth, High Market Share)
- 4.3.2. Cash Cows (Low Growth, High Market Share)
- 4.3.3. Question Mark (High Growth, Low Market Share)
- 4.3.4. Dogs (Low Growth, Low Market Share)
- 4.4. Ansoff Matrix Analysis
- 4.5. Supply Chain Analysis
- 4.6. Regulatory Landscape
- 4.7. Current Market Potential and Opportunity Assessment (TAM–SAM–SOM Framework)
- 4.8. TIR Analyst Note
- 4.1. Porters Five Forces
- 5. Market Analysis, Insights and Forecast 2021-2033
- 5.1. Market Analysis, Insights and Forecast - by Product
- 5.1.1. Flow Cytometry
- 5.1.2. Hematology Analyzers
- 5.1.3. Cell Imaging Systems
- 5.1.4. Reagents and Kits
- 5.1.5. Other Products
- 5.2. Market Analysis, Insights and Forecast - by Application
- 5.2.1. Disease Diagnosis and Identification
- 5.2.2. Research and Drug Discovery
- 5.2.3. Other Applications
- 5.3. Market Analysis, Insights and Forecast - by Region
- 5.3.1. North America
- 5.3.2. Europe
- 5.3.3. Asia Pacific
- 5.3.4. Middle East and Africa
- 5.3.5. South America
- 5.1. Market Analysis, Insights and Forecast - by Product
- 6. Global Cell Surface Markers Detection Market Analysis, Insights and Forecast, 2021-2033
- 6.1. Market Analysis, Insights and Forecast - by Product
- 6.1.1. Flow Cytometry
- 6.1.2. Hematology Analyzers
- 6.1.3. Cell Imaging Systems
- 6.1.4. Reagents and Kits
- 6.1.5. Other Products
- 6.2. Market Analysis, Insights and Forecast - by Application
- 6.2.1. Disease Diagnosis and Identification
- 6.2.2. Research and Drug Discovery
- 6.2.3. Other Applications
- 6.1. Market Analysis, Insights and Forecast - by Product
- 7. North America Global Cell Surface Markers Detection Market Analysis, Insights and Forecast, 2020-2032
- 7.1. Market Analysis, Insights and Forecast - by Product
- 7.1.1. Flow Cytometry
- 7.1.2. Hematology Analyzers
- 7.1.3. Cell Imaging Systems
- 7.1.4. Reagents and Kits
- 7.1.5. Other Products
- 7.2. Market Analysis, Insights and Forecast - by Application
- 7.2.1. Disease Diagnosis and Identification
- 7.2.2. Research and Drug Discovery
- 7.2.3. Other Applications
- 7.1. Market Analysis, Insights and Forecast - by Product
- 8. Europe Global Cell Surface Markers Detection Market Analysis, Insights and Forecast, 2020-2032
- 8.1. Market Analysis, Insights and Forecast - by Product
- 8.1.1. Flow Cytometry
- 8.1.2. Hematology Analyzers
- 8.1.3. Cell Imaging Systems
- 8.1.4. Reagents and Kits
- 8.1.5. Other Products
- 8.2. Market Analysis, Insights and Forecast - by Application
- 8.2.1. Disease Diagnosis and Identification
- 8.2.2. Research and Drug Discovery
- 8.2.3. Other Applications
- 8.1. Market Analysis, Insights and Forecast - by Product
- 9. Asia Pacific Global Cell Surface Markers Detection Market Analysis, Insights and Forecast, 2020-2032
- 9.1. Market Analysis, Insights and Forecast - by Product
- 9.1.1. Flow Cytometry
- 9.1.2. Hematology Analyzers
- 9.1.3. Cell Imaging Systems
- 9.1.4. Reagents and Kits
- 9.1.5. Other Products
- 9.2. Market Analysis, Insights and Forecast - by Application
- 9.2.1. Disease Diagnosis and Identification
- 9.2.2. Research and Drug Discovery
- 9.2.3. Other Applications
- 9.1. Market Analysis, Insights and Forecast - by Product
- 10. Middle East and Africa Global Cell Surface Markers Detection Market Analysis, Insights and Forecast, 2020-2032
- 10.1. Market Analysis, Insights and Forecast - by Product
- 10.1.1. Flow Cytometry
- 10.1.2. Hematology Analyzers
- 10.1.3. Cell Imaging Systems
- 10.1.4. Reagents and Kits
- 10.1.5. Other Products
- 10.2. Market Analysis, Insights and Forecast - by Application
- 10.2.1. Disease Diagnosis and Identification
- 10.2.2. Research and Drug Discovery
- 10.2.3. Other Applications
- 10.1. Market Analysis, Insights and Forecast - by Product
- 11. South America Global Cell Surface Markers Detection Market Analysis, Insights and Forecast, 2020-2032
- 11.1. Market Analysis, Insights and Forecast - by Product
- 11.1.1. Flow Cytometry
- 11.1.2. Hematology Analyzers
- 11.1.3. Cell Imaging Systems
- 11.1.4. Reagents and Kits
- 11.1.5. Other Products
- 11.2. Market Analysis, Insights and Forecast - by Application
- 11.2.1. Disease Diagnosis and Identification
- 11.2.2. Research and Drug Discovery
- 11.2.3. Other Applications
- 11.1. Market Analysis, Insights and Forecast - by Product
- 12. Competitive Analysis
- 12.1. Company Profiles
- 12.1.1 Becton Dickinson and Company
- 12.1.1.1. Company Overview
- 12.1.1.2. Products
- 12.1.1.3. Company Financials
- 12.1.1.4. SWOT Analysis
- 12.1.2 Grifols SA
- 12.1.2.1. Company Overview
- 12.1.2.2. Products
- 12.1.2.3. Company Financials
- 12.1.2.4. SWOT Analysis
- 12.1.3 Siemens Healthineers
- 12.1.3.1. Company Overview
- 12.1.3.2. Products
- 12.1.3.3. Company Financials
- 12.1.3.4. SWOT Analysis
- 12.1.4 F Hoffmann-La Roche Ltd
- 12.1.4.1. Company Overview
- 12.1.4.2. Products
- 12.1.4.3. Company Financials
- 12.1.4.4. SWOT Analysis
- 12.1.5 Nexcelom Bioscience LLC
- 12.1.5.1. Company Overview
- 12.1.5.2. Products
- 12.1.5.3. Company Financials
- 12.1.5.4. SWOT Analysis
- 12.1.6 Thermo Fisher Scientific Inc
- 12.1.6.1. Company Overview
- 12.1.6.2. Products
- 12.1.6.3. Company Financials
- 12.1.6.4. SWOT Analysis
- 12.1.7 Abbott Laboratories
- 12.1.7.1. Company Overview
- 12.1.7.2. Products
- 12.1.7.3. Company Financials
- 12.1.7.4. SWOT Analysis
- 12.1.8 Agilent Technologies Inc
- 12.1.8.1. Company Overview
- 12.1.8.2. Products
- 12.1.8.3. Company Financials
- 12.1.8.4. SWOT Analysis
- 12.1.9 IVD Medical Holding Limited (Immucor Inc )
- 12.1.9.1. Company Overview
- 12.1.9.2. Products
- 12.1.9.3. Company Financials
- 12.1.9.4. SWOT Analysis
- 12.1.10 Sysmex Corporation
- 12.1.10.1. Company Overview
- 12.1.10.2. Products
- 12.1.10.3. Company Financials
- 12.1.10.4. SWOT Analysis
- 12.1.11 Diasorin SpA (Luminex Corporation)
- 12.1.11.1. Company Overview
- 12.1.11.2. Products
- 12.1.11.3. Company Financials
- 12.1.11.4. SWOT Analysis
- 12.1.12 Qiagen NV
- 12.1.12.1. Company Overview
- 12.1.12.2. Products
- 12.1.12.3. Company Financials
- 12.1.12.4. SWOT Analysis
- 12.1.13 Nihon Kohden Corporation
- 12.1.13.1. Company Overview
- 12.1.13.2. Products
- 12.1.13.3. Company Financials
- 12.1.13.4. SWOT Analysis
- 12.1.14 Bio Rad Laboratories Inc
- 12.1.14.1. Company Overview
- 12.1.14.2. Products
- 12.1.14.3. Company Financials
- 12.1.14.4. SWOT Analysis
- 12.1.15 Danaher Corporation (Beckman Coulter Inc )
- 12.1.15.1. Company Overview
- 12.1.15.2. Products
- 12.1.15.3. Company Financials
- 12.1.15.4. SWOT Analysis
- 12.1.1 Becton Dickinson and Company
- 12.2. Market Entropy
- 12.2.1 Company's Key Areas Served
- 12.2.2 Recent Developments
- 12.3. Company Market Share Analysis 2025
- 12.3.1 Top 5 Companies Market Share Analysis
- 12.3.2 Top 3 Companies Market Share Analysis
- 12.4. List of Potential Customers
- 13. Research Methodology
List of Figures
- Figure 1: Global Global Cell Surface Markers Detection Market Revenue Breakdown (Million, %) by Region 2025 & 2033
- Figure 2: Global Global Cell Surface Markers Detection Market Volume Breakdown (K Unit, %) by Region 2025 & 2033
- Figure 3: North America Global Cell Surface Markers Detection Market Revenue (Million), by Product 2025 & 2033
- Figure 4: North America Global Cell Surface Markers Detection Market Volume (K Unit), by Product 2025 & 2033
- Figure 5: North America Global Cell Surface Markers Detection Market Revenue Share (%), by Product 2025 & 2033
- Figure 6: North America Global Cell Surface Markers Detection Market Volume Share (%), by Product 2025 & 2033
- Figure 7: North America Global Cell Surface Markers Detection Market Revenue (Million), by Application 2025 & 2033
- Figure 8: North America Global Cell Surface Markers Detection Market Volume (K Unit), by Application 2025 & 2033
- Figure 9: North America Global Cell Surface Markers Detection Market Revenue Share (%), by Application 2025 & 2033
- Figure 10: North America Global Cell Surface Markers Detection Market Volume Share (%), by Application 2025 & 2033
- Figure 11: North America Global Cell Surface Markers Detection Market Revenue (Million), by Country 2025 & 2033
- Figure 12: North America Global Cell Surface Markers Detection Market Volume (K Unit), by Country 2025 & 2033
- Figure 13: North America Global Cell Surface Markers Detection Market Revenue Share (%), by Country 2025 & 2033
- Figure 14: North America Global Cell Surface Markers Detection Market Volume Share (%), by Country 2025 & 2033
- Figure 15: Europe Global Cell Surface Markers Detection Market Revenue (Million), by Product 2025 & 2033
- Figure 16: Europe Global Cell Surface Markers Detection Market Volume (K Unit), by Product 2025 & 2033
- Figure 17: Europe Global Cell Surface Markers Detection Market Revenue Share (%), by Product 2025 & 2033
- Figure 18: Europe Global Cell Surface Markers Detection Market Volume Share (%), by Product 2025 & 2033
- Figure 19: Europe Global Cell Surface Markers Detection Market Revenue (Million), by Application 2025 & 2033
- Figure 20: Europe Global Cell Surface Markers Detection Market Volume (K Unit), by Application 2025 & 2033
- Figure 21: Europe Global Cell Surface Markers Detection Market Revenue Share (%), by Application 2025 & 2033
- Figure 22: Europe Global Cell Surface Markers Detection Market Volume Share (%), by Application 2025 & 2033
- Figure 23: Europe Global Cell Surface Markers Detection Market Revenue (Million), by Country 2025 & 2033
- Figure 24: Europe Global Cell Surface Markers Detection Market Volume (K Unit), by Country 2025 & 2033
- Figure 25: Europe Global Cell Surface Markers Detection Market Revenue Share (%), by Country 2025 & 2033
- Figure 26: Europe Global Cell Surface Markers Detection Market Volume Share (%), by Country 2025 & 2033
- Figure 27: Asia Pacific Global Cell Surface Markers Detection Market Revenue (Million), by Product 2025 & 2033
- Figure 28: Asia Pacific Global Cell Surface Markers Detection Market Volume (K Unit), by Product 2025 & 2033
- Figure 29: Asia Pacific Global Cell Surface Markers Detection Market Revenue Share (%), by Product 2025 & 2033
- Figure 30: Asia Pacific Global Cell Surface Markers Detection Market Volume Share (%), by Product 2025 & 2033
- Figure 31: Asia Pacific Global Cell Surface Markers Detection Market Revenue (Million), by Application 2025 & 2033
- Figure 32: Asia Pacific Global Cell Surface Markers Detection Market Volume (K Unit), by Application 2025 & 2033
- Figure 33: Asia Pacific Global Cell Surface Markers Detection Market Revenue Share (%), by Application 2025 & 2033
- Figure 34: Asia Pacific Global Cell Surface Markers Detection Market Volume Share (%), by Application 2025 & 2033
- Figure 35: Asia Pacific Global Cell Surface Markers Detection Market Revenue (Million), by Country 2025 & 2033
- Figure 36: Asia Pacific Global Cell Surface Markers Detection Market Volume (K Unit), by Country 2025 & 2033
- Figure 37: Asia Pacific Global Cell Surface Markers Detection Market Revenue Share (%), by Country 2025 & 2033
- Figure 38: Asia Pacific Global Cell Surface Markers Detection Market Volume Share (%), by Country 2025 & 2033
- Figure 39: Middle East and Africa Global Cell Surface Markers Detection Market Revenue (Million), by Product 2025 & 2033
- Figure 40: Middle East and Africa Global Cell Surface Markers Detection Market Volume (K Unit), by Product 2025 & 2033
- Figure 41: Middle East and Africa Global Cell Surface Markers Detection Market Revenue Share (%), by Product 2025 & 2033
- Figure 42: Middle East and Africa Global Cell Surface Markers Detection Market Volume Share (%), by Product 2025 & 2033
- Figure 43: Middle East and Africa Global Cell Surface Markers Detection Market Revenue (Million), by Application 2025 & 2033
- Figure 44: Middle East and Africa Global Cell Surface Markers Detection Market Volume (K Unit), by Application 2025 & 2033
- Figure 45: Middle East and Africa Global Cell Surface Markers Detection Market Revenue Share (%), by Application 2025 & 2033
- Figure 46: Middle East and Africa Global Cell Surface Markers Detection Market Volume Share (%), by Application 2025 & 2033
- Figure 47: Middle East and Africa Global Cell Surface Markers Detection Market Revenue (Million), by Country 2025 & 2033
- Figure 48: Middle East and Africa Global Cell Surface Markers Detection Market Volume (K Unit), by Country 2025 & 2033
- Figure 49: Middle East and Africa Global Cell Surface Markers Detection Market Revenue Share (%), by Country 2025 & 2033
- Figure 50: Middle East and Africa Global Cell Surface Markers Detection Market Volume Share (%), by Country 2025 & 2033
- Figure 51: South America Global Cell Surface Markers Detection Market Revenue (Million), by Product 2025 & 2033
- Figure 52: South America Global Cell Surface Markers Detection Market Volume (K Unit), by Product 2025 & 2033
- Figure 53: South America Global Cell Surface Markers Detection Market Revenue Share (%), by Product 2025 & 2033
- Figure 54: South America Global Cell Surface Markers Detection Market Volume Share (%), by Product 2025 & 2033
- Figure 55: South America Global Cell Surface Markers Detection Market Revenue (Million), by Application 2025 & 2033
- Figure 56: South America Global Cell Surface Markers Detection Market Volume (K Unit), by Application 2025 & 2033
- Figure 57: South America Global Cell Surface Markers Detection Market Revenue Share (%), by Application 2025 & 2033
- Figure 58: South America Global Cell Surface Markers Detection Market Volume Share (%), by Application 2025 & 2033
- Figure 59: South America Global Cell Surface Markers Detection Market Revenue (Million), by Country 2025 & 2033
- Figure 60: South America Global Cell Surface Markers Detection Market Volume (K Unit), by Country 2025 & 2033
- Figure 61: South America Global Cell Surface Markers Detection Market Revenue Share (%), by Country 2025 & 2033
- Figure 62: South America Global Cell Surface Markers Detection Market Volume Share (%), by Country 2025 & 2033
List of Tables
- Table 1: Global Cell Surface Markers Detection Market Revenue Million Forecast, by Product 2020 & 2033
- Table 2: Global Cell Surface Markers Detection Market Volume K Unit Forecast, by Product 2020 & 2033
- Table 3: Global Cell Surface Markers Detection Market Revenue Million Forecast, by Application 2020 & 2033
- Table 4: Global Cell Surface Markers Detection Market Volume K Unit Forecast, by Application 2020 & 2033
- Table 5: Global Cell Surface Markers Detection Market Revenue Million Forecast, by Region 2020 & 2033
- Table 6: Global Cell Surface Markers Detection Market Volume K Unit Forecast, by Region 2020 & 2033
- Table 7: Global Cell Surface Markers Detection Market Revenue Million Forecast, by Product 2020 & 2033
- Table 8: Global Cell Surface Markers Detection Market Volume K Unit Forecast, by Product 2020 & 2033
- Table 9: Global Cell Surface Markers Detection Market Revenue Million Forecast, by Application 2020 & 2033
- Table 10: Global Cell Surface Markers Detection Market Volume K Unit Forecast, by Application 2020 & 2033
- Table 11: Global Cell Surface Markers Detection Market Revenue Million Forecast, by Country 2020 & 2033
- Table 12: Global Cell Surface Markers Detection Market Volume K Unit Forecast, by Country 2020 & 2033
- Table 13: United States Global Cell Surface Markers Detection Market Revenue (Million) Forecast, by Application 2020 & 2033
- Table 14: United States Global Cell Surface Markers Detection Market Volume (K Unit) Forecast, by Application 2020 & 2033
- Table 15: Canada Global Cell Surface Markers Detection Market Revenue (Million) Forecast, by Application 2020 & 2033
- Table 16: Canada Global Cell Surface Markers Detection Market Volume (K Unit) Forecast, by Application 2020 & 2033
- Table 17: Mexico Global Cell Surface Markers Detection Market Revenue (Million) Forecast, by Application 2020 & 2033
- Table 18: Mexico Global Cell Surface Markers Detection Market Volume (K Unit) Forecast, by Application 2020 & 2033
- Table 19: Global Cell Surface Markers Detection Market Revenue Million Forecast, by Product 2020 & 2033
- Table 20: Global Cell Surface Markers Detection Market Volume K Unit Forecast, by Product 2020 & 2033
- Table 21: Global Cell Surface Markers Detection Market Revenue Million Forecast, by Application 2020 & 2033
- Table 22: Global Cell Surface Markers Detection Market Volume K Unit Forecast, by Application 2020 & 2033
- Table 23: Global Cell Surface Markers Detection Market Revenue Million Forecast, by Country 2020 & 2033
- Table 24: Global Cell Surface Markers Detection Market Volume K Unit Forecast, by Country 2020 & 2033
- Table 25: Germany Global Cell Surface Markers Detection Market Revenue (Million) Forecast, by Application 2020 & 2033
- Table 26: Germany Global Cell Surface Markers Detection Market Volume (K Unit) Forecast, by Application 2020 & 2033
- Table 27: United Kingdom Global Cell Surface Markers Detection Market Revenue (Million) Forecast, by Application 2020 & 2033
- Table 28: United Kingdom Global Cell Surface Markers Detection Market Volume (K Unit) Forecast, by Application 2020 & 2033
- Table 29: France Global Cell Surface Markers Detection Market Revenue (Million) Forecast, by Application 2020 & 2033
- Table 30: France Global Cell Surface Markers Detection Market Volume (K Unit) Forecast, by Application 2020 & 2033
- Table 31: Italy Global Cell Surface Markers Detection Market Revenue (Million) Forecast, by Application 2020 & 2033
- Table 32: Italy Global Cell Surface Markers Detection Market Volume (K Unit) Forecast, by Application 2020 & 2033
- Table 33: Spain Global Cell Surface Markers Detection Market Revenue (Million) Forecast, by Application 2020 & 2033
- Table 34: Spain Global Cell Surface Markers Detection Market Volume (K Unit) Forecast, by Application 2020 & 2033
- Table 35: Rest of Europe Global Cell Surface Markers Detection Market Revenue (Million) Forecast, by Application 2020 & 2033
- Table 36: Rest of Europe Global Cell Surface Markers Detection Market Volume (K Unit) Forecast, by Application 2020 & 2033
- Table 37: Global Cell Surface Markers Detection Market Revenue Million Forecast, by Product 2020 & 2033
- Table 38: Global Cell Surface Markers Detection Market Volume K Unit Forecast, by Product 2020 & 2033
- Table 39: Global Cell Surface Markers Detection Market Revenue Million Forecast, by Application 2020 & 2033
- Table 40: Global Cell Surface Markers Detection Market Volume K Unit Forecast, by Application 2020 & 2033
- Table 41: Global Cell Surface Markers Detection Market Revenue Million Forecast, by Country 2020 & 2033
- Table 42: Global Cell Surface Markers Detection Market Volume K Unit Forecast, by Country 2020 & 2033
- Table 43: China Global Cell Surface Markers Detection Market Revenue (Million) Forecast, by Application 2020 & 2033
- Table 44: China Global Cell Surface Markers Detection Market Volume (K Unit) Forecast, by Application 2020 & 2033
- Table 45: Japan Global Cell Surface Markers Detection Market Revenue (Million) Forecast, by Application 2020 & 2033
- Table 46: Japan Global Cell Surface Markers Detection Market Volume (K Unit) Forecast, by Application 2020 & 2033
- Table 47: India Global Cell Surface Markers Detection Market Revenue (Million) Forecast, by Application 2020 & 2033
- Table 48: India Global Cell Surface Markers Detection Market Volume (K Unit) Forecast, by Application 2020 & 2033
- Table 49: Australia Global Cell Surface Markers Detection Market Revenue (Million) Forecast, by Application 2020 & 2033
- Table 50: Australia Global Cell Surface Markers Detection Market Volume (K Unit) Forecast, by Application 2020 & 2033
- Table 51: South Korea Global Cell Surface Markers Detection Market Revenue (Million) Forecast, by Application 2020 & 2033
- Table 52: South Korea Global Cell Surface Markers Detection Market Volume (K Unit) Forecast, by Application 2020 & 2033
- Table 53: Rest of Asia Pacific Global Cell Surface Markers Detection Market Revenue (Million) Forecast, by Application 2020 & 2033
- Table 54: Rest of Asia Pacific Global Cell Surface Markers Detection Market Volume (K Unit) Forecast, by Application 2020 & 2033
- Table 55: Global Cell Surface Markers Detection Market Revenue Million Forecast, by Product 2020 & 2033
- Table 56: Global Cell Surface Markers Detection Market Volume K Unit Forecast, by Product 2020 & 2033
- Table 57: Global Cell Surface Markers Detection Market Revenue Million Forecast, by Application 2020 & 2033
- Table 58: Global Cell Surface Markers Detection Market Volume K Unit Forecast, by Application 2020 & 2033
- Table 59: Global Cell Surface Markers Detection Market Revenue Million Forecast, by Country 2020 & 2033
- Table 60: Global Cell Surface Markers Detection Market Volume K Unit Forecast, by Country 2020 & 2033
- Table 61: GCC Global Cell Surface Markers Detection Market Revenue (Million) Forecast, by Application 2020 & 2033
- Table 62: GCC Global Cell Surface Markers Detection Market Volume (K Unit) Forecast, by Application 2020 & 2033
- Table 63: South Africa Global Cell Surface Markers Detection Market Revenue (Million) Forecast, by Application 2020 & 2033
- Table 64: South Africa Global Cell Surface Markers Detection Market Volume (K Unit) Forecast, by Application 2020 & 2033
- Table 65: Rest of Middle East and Africa Global Cell Surface Markers Detection Market Revenue (Million) Forecast, by Application 2020 & 2033
- Table 66: Rest of Middle East and Africa Global Cell Surface Markers Detection Market Volume (K Unit) Forecast, by Application 2020 & 2033
- Table 67: Global Cell Surface Markers Detection Market Revenue Million Forecast, by Product 2020 & 2033
- Table 68: Global Cell Surface Markers Detection Market Volume K Unit Forecast, by Product 2020 & 2033
- Table 69: Global Cell Surface Markers Detection Market Revenue Million Forecast, by Application 2020 & 2033
- Table 70: Global Cell Surface Markers Detection Market Volume K Unit Forecast, by Application 2020 & 2033
- Table 71: Global Cell Surface Markers Detection Market Revenue Million Forecast, by Country 2020 & 2033
- Table 72: Global Cell Surface Markers Detection Market Volume K Unit Forecast, by Country 2020 & 2033
- Table 73: Brazil Global Cell Surface Markers Detection Market Revenue (Million) Forecast, by Application 2020 & 2033
- Table 74: Brazil Global Cell Surface Markers Detection Market Volume (K Unit) Forecast, by Application 2020 & 2033
- Table 75: Argentina Global Cell Surface Markers Detection Market Revenue (Million) Forecast, by Application 2020 & 2033
- Table 76: Argentina Global Cell Surface Markers Detection Market Volume (K Unit) Forecast, by Application 2020 & 2033
- Table 77: Rest of South America Global Cell Surface Markers Detection Market Revenue (Million) Forecast, by Application 2020 & 2033
- Table 78: Rest of South America Global Cell Surface Markers Detection Market Volume (K Unit) Forecast, by Application 2020 & 2033
Frequently Asked Questions
1. What is the projected Compound Annual Growth Rate (CAGR) of the Global Cell Surface Markers Detection Market?
The projected CAGR is approximately 8.20%.
2. Which companies are prominent players in the Global Cell Surface Markers Detection Market?
Key companies in the market include Becton Dickinson and Company, Grifols SA, Siemens Healthineers, F Hoffmann-La Roche Ltd, Nexcelom Bioscience LLC, Thermo Fisher Scientific Inc, Abbott Laboratories, Agilent Technologies Inc, IVD Medical Holding Limited (Immucor Inc ), Sysmex Corporation, Diasorin SpA (Luminex Corporation), Qiagen NV, Nihon Kohden Corporation, Bio Rad Laboratories Inc, Danaher Corporation (Beckman Coulter Inc ).
3. What are the main segments of the Global Cell Surface Markers Detection Market?
The market segments include Product, Application.
4. Can you provide details about the market size?
The market size is estimated to be USD XX Million as of 2022.
5. What are some drivers contributing to market growth?
Increased Use of Cell Surface Markers Detection in Diagnostics; Technological Advances Related to Increased Throughput and Automation; Increasing Demand for Precision Medicine.
6. What are the notable trends driving market growth?
Flow Cytometry Segment is Expected to Show a Significant Growth Over the Forecast Period..
7. Are there any restraints impacting market growth?
High Cost of Instruments; Complexity of Techniques.
8. Can you provide examples of recent developments in the market?
April 2022: Sysmex Europe, a provider of automated workflow solutions in the disciplines of hematology, urinalysis, and hemostasis, has reported the launch of its Flow Cytometer XF-1600, which has received CE marking, indicating its compliance with the European IVD Regulation and IVD use.
9. What pricing options are available for accessing the report?
Pricing options include single-user, multi-user, and enterprise licenses priced at USD 4750, USD 5250, and USD 8750 respectively.
10. Is the market size provided in terms of value or volume?
The market size is provided in terms of value, measured in Million and volume, measured in K Unit.
11. Are there any specific market keywords associated with the report?
Yes, the market keyword associated with the report is "Global Cell Surface Markers Detection Market," which aids in identifying and referencing the specific market segment covered.
12. How do I determine which pricing option suits my needs best?
The pricing options vary based on user requirements and access needs. Individual users may opt for single-user licenses, while businesses requiring broader access may choose multi-user or enterprise licenses for cost-effective access to the report.
13. Are there any additional resources or data provided in the Global Cell Surface Markers Detection Market report?
While the report offers comprehensive insights, it's advisable to review the specific contents or supplementary materials provided to ascertain if additional resources or data are available.
14. How can I stay updated on further developments or reports in the Global Cell Surface Markers Detection Market?
To stay informed about further developments, trends, and reports in the Global Cell Surface Markers Detection Market, consider subscribing to industry newsletters, following relevant companies and organizations, or regularly checking reputable industry news sources and publications.
Methodology
Step 1 - Identification of Relevant Samples Size from Population Database


Step 2 - Approaches for Defining Global Market Size (Value, Volume* & Price*)

Note*: In applicable scenarios
Step 3 - Data Sources
Primary Research
- Web Analytics
- Survey Reports
- Research Institute
- Latest Research Reports
- Opinion Leaders
Secondary Research
- Annual Reports
- White Paper
- Latest Press Release
- Industry Association
- Paid Database
- Investor Presentations

Step 4 - Data Triangulation
Involves using different sources of information in order to increase the validity of a study
These sources are likely to be stakeholders in a program - participants, other researchers, program staff, other community members, and so on.
Then we put all data in single framework & apply various statistical tools to find out the dynamic on the market.
During the analysis stage, feedback from the stakeholder groups would be compared to determine areas of agreement as well as areas of divergence