

Key Insights
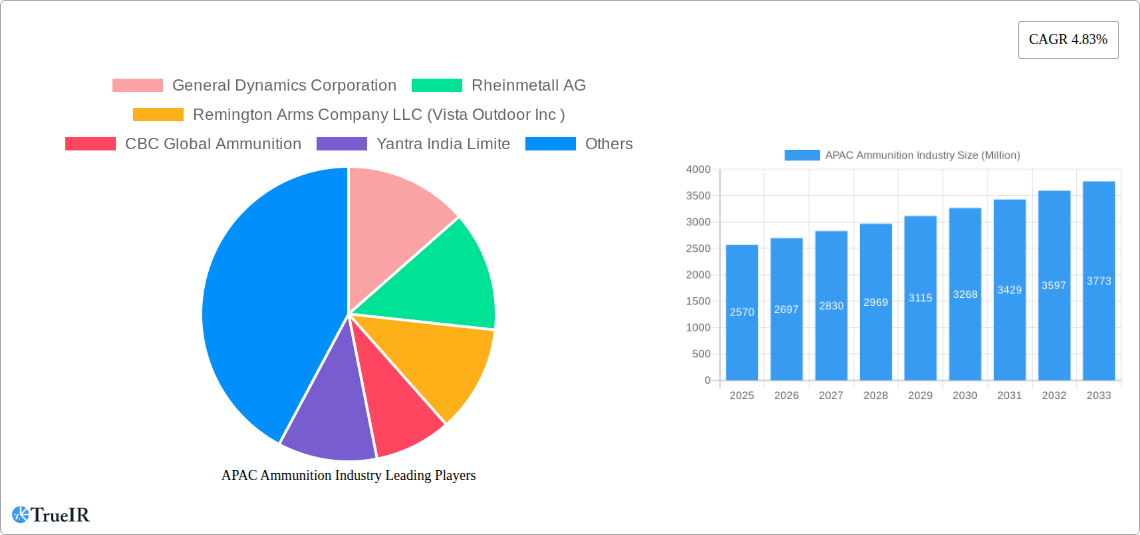
The Asia-Pacific (APAC) ammunition market, valued at $2.57 billion in 2025, is projected to experience robust growth, driven by escalating geopolitical tensions, increasing defense budgets across several nations, and a rising demand for both civilian and military applications. The market's Compound Annual Growth Rate (CAGR) of 4.83% from 2025 to 2033 indicates a steady expansion, fueled by modernization of armed forces, counter-terrorism efforts, and growing internal security concerns. Significant growth is anticipated from countries like India and China, which are major consumers and producers of ammunition. The increasing adoption of advanced ammunition technologies, such as smart munitions and guided projectiles, further contributes to market expansion. Segmentation by caliber (small, medium, large) reveals a diverse market, with each segment experiencing unique growth trajectories influenced by specific application needs. Similarly, the end-user segmentation (civilian/law enforcement, military) reflects varying demand drivers, with military spending playing a crucial role in overall market growth. The presence of established players like General Dynamics, Rheinmetall, and local manufacturers like Yantra India and Poongson Corporation, ensures a competitive landscape driving innovation and price optimization.
However, regulatory constraints on ammunition production and sales, coupled with fluctuating raw material prices, pose challenges to market expansion. Stringent export controls and international arms trade regulations can also impact market dynamics. Despite these constraints, the long-term outlook for the APAC ammunition market remains positive, supported by consistent military modernization programs, rising internal security concerns, and a growing civilian market for hunting and sport shooting. The ongoing geopolitical instability in the region is also expected to drive demand for ammunition in the forecast period. The market's future trajectory will depend on the interplay of these factors, influencing investment strategies and technological advancements within the industry.
APAC Ammunition Industry: A Comprehensive Market Report (2019-2033)
This dynamic report provides a detailed analysis of the Asia-Pacific (APAC) ammunition industry, offering invaluable insights for stakeholders, investors, and industry professionals. With a comprehensive study period spanning 2019-2033 (base year 2025, forecast period 2025-2033), this report leverages extensive data and analysis to illuminate market trends, opportunities, and challenges. The report covers a market valued at $XX Million in 2025, projected to reach $XX Million by 2033, exhibiting a CAGR of XX%.
APAC Ammunition Industry Market Structure & Competitive Landscape
The APAC ammunition market is characterized by a moderately concentrated landscape, with key players such as General Dynamics Corporation, Rheinmetall AG, and BAE Systems PLC holding significant market share. However, the presence of numerous regional players, particularly in India and China, introduces a competitive dynamic. Innovation is driven by the demand for advanced munitions, including guided projectiles and smart ammunition, fueled by escalating geopolitical tensions and modernization efforts across the region. Stringent regulatory frameworks concerning ammunition manufacturing, storage, and transportation significantly impact market operations. Product substitutes, such as directed energy weapons, are emerging but currently hold a limited market share. End-user segmentation is heavily weighted towards military applications, although the civilian and law enforcement sectors contribute a substantial portion of the market. Mergers and acquisitions (M&A) activity has been relatively low in recent years, with a total M&A volume estimated at $XX Million over the past five years. Concentration ratios indicate a moderately concentrated market, with the top three players holding approximately XX% market share.
APAC Ammunition Industry Market Trends & Opportunities
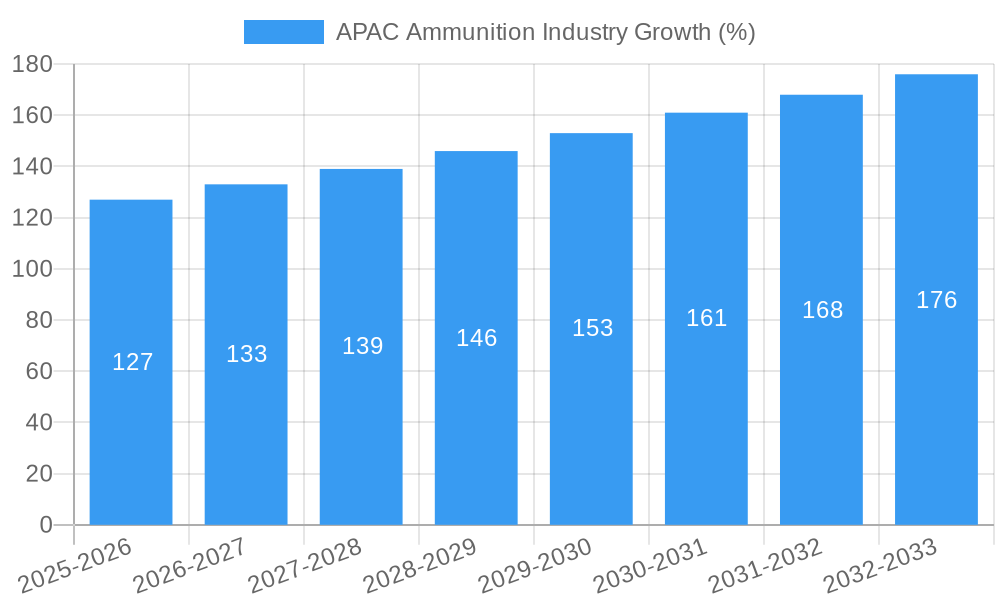
The APAC ammunition market exhibits strong growth potential, driven by increasing defense budgets, modernization of armed forces, and regional geopolitical instability. The market size is projected to experience substantial growth, with a CAGR of XX% between 2025 and 2033. Technological advancements, including the development of precision-guided munitions and smart ammunition, are reshaping the industry landscape. Consumer preferences, particularly within the military segment, are increasingly focused on enhanced accuracy, lethality, and reduced collateral damage. Competitive dynamics are marked by ongoing investments in R&D, strategic partnerships, and capacity expansion by major players. Market penetration rates for advanced ammunition systems are expected to increase significantly over the forecast period, driven by adoption by key military forces in the region.
Dominant Markets & Segments in APAC Ammunition Industry
By Type: The large-caliber ammunition segment currently dominates the market, driven by substantial military demand for artillery shells and other heavy weaponry. However, the small-caliber segment is anticipated to experience faster growth in the forecast period, propelled by the increasing adoption of small arms in both military and civilian contexts. Medium caliber ammunition maintains a stable market share.
By End User: The military segment commands the largest share, reflecting the substantial defense expenditure across the APAC region. The civilian and law enforcement segments are experiencing steady growth, driven by increasing security concerns and sporting activities.
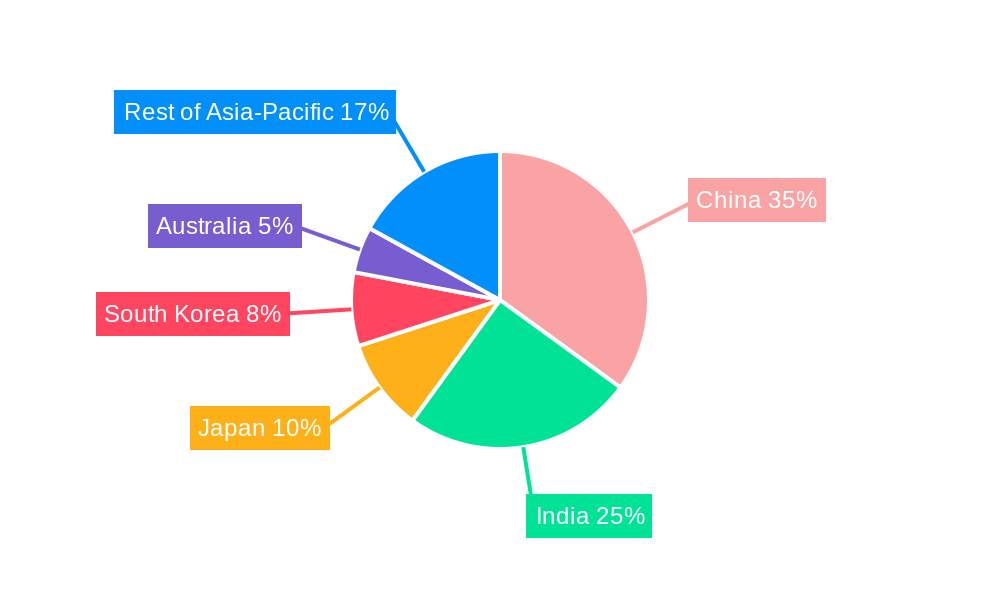
By Country: China and India are the leading markets, accounting for approximately XX% and XX% of total market share respectively, due to their large defense budgets and indigenous manufacturing capabilities. Japan, South Korea and Australia represent substantial regional markets, while the "Rest of Asia-Pacific" region shows promising growth potential. Key growth drivers for these leading markets include modernization of military forces, growing security concerns, and supportive government policies.
APAC Ammunition Industry Product Analysis
Technological advancements are continuously shaping the APAC ammunition industry. Innovations focus on enhanced accuracy, reduced collateral damage, and increased lethality through guided munitions, smart ammunition, and improved propellant technologies. These advancements cater to the rising demand for precise and effective weaponry, particularly in asymmetric warfare scenarios. The competitive advantages are primarily derived from superior technological capabilities, cost-effectiveness, and efficient supply chains.
Key Drivers, Barriers & Challenges in APAP Ammunition Industry
Key Drivers: Increased defense spending, modernization of armed forces, regional geopolitical tensions, and technological advancements in ammunition design and manufacturing are the key drivers accelerating market expansion.
Challenges: Stringent regulatory frameworks, supply chain disruptions, and intense competition among established and emerging players pose significant challenges to industry growth. The potential impact of these challenges is quantified by estimating a potential XX% reduction in market growth if these issues are not adequately addressed.
Growth Drivers in the APAC Ammunition Industry Market
Technological innovation, particularly in the development of precision-guided munitions and smart ammunition, coupled with rising defense budgets and modernization efforts across the region, are significant catalysts for industry growth. Supportive government policies and a growing demand for enhanced security are further boosting the market.
Challenges Impacting APAC Ammunition Industry Growth
Strict regulations governing ammunition manufacturing, storage, and transportation, alongside potential supply chain disruptions and fierce competition, impede market expansion. The potential impact of these challenges can result in a delayed market growth by approximately XX% if not effectively managed.
Key Players Shaping the APAC Ammunition Industry Market
- General Dynamics Corporation
- Rheinmetall AG
- Remington Arms Company LLC (Vista Outdoor Inc)
- CBC Global Ammunition
- Yantra India Limited
- BAE Systems PLC
- Winchester Ammunition (Olin Corporation)
- Munitions India Limited
- Singapore Technologies Engineering Ltd
- Poongson Corporation
- Hanwha Corporation
- KNDS NV
Significant APAC Ammunition Industry Milestones
February 2024: China unveils the ASN-301 loitering munition, showcasing advancements in precision-guided weaponry and potentially impacting the market share of similar technologies.
February 2023: India's MoD selects five domestic manufacturers for 2,000 155mm TGMs, boosting domestic production and potentially impacting import levels.
Future Outlook for APAC Ammunition Industry Market
The APAC ammunition market is poised for sustained growth, driven by continuous technological innovation, increasing defense spending, and ongoing geopolitical developments. Strategic opportunities lie in developing advanced ammunition systems, establishing robust supply chains, and navigating regulatory complexities. The market's significant potential warrants close monitoring and strategic planning by industry participants.
APAC Ammunition Industry Segmentation
- 1. Production Analysis
- 2. Consumption Analysis
- 3. Import Market Analysis (Value & Volume)
- 4. Export Market Analysis (Value & Volume)
- 5. Price Trend Analysis
APAC Ammunition Industry Segmentation By Geography
-
1. North America
- 1.1. United States
- 1.2. Canada
- 1.3. Mexico
-
2. South America
- 2.1. Brazil
- 2.2. Argentina
- 2.3. Rest of South America
-
3. Europe
- 3.1. United Kingdom
- 3.2. Germany
- 3.3. France
- 3.4. Italy
- 3.5. Spain
- 3.6. Russia
- 3.7. Benelux
- 3.8. Nordics
- 3.9. Rest of Europe
-
4. Middle East & Africa
- 4.1. Turkey
- 4.2. Israel
- 4.3. GCC
- 4.4. North Africa
- 4.5. South Africa
- 4.6. Rest of Middle East & Africa
-
5. Asia Pacific
- 5.1. China
- 5.2. India
- 5.3. Japan
- 5.4. South Korea
- 5.5. ASEAN
- 5.6. Oceania
- 5.7. Rest of Asia Pacific
APAC Ammunition Industry REPORT HIGHLIGHTS
| Aspects | Details |
|---|---|
| Study Period | 2019-2033 |
| Base Year | 2024 |
| Estimated Year | 2025 |
| Forecast Period | 2025-2033 |
| Historical Period | 2019-2024 |
| Growth Rate | CAGR of 4.83% from 2019-2033 |
| Segmentation |
|
Table of Contents
- 1. Introduction
- 1.1. Research Scope
- 1.2. Market Segmentation
- 1.3. Research Methodology
- 1.4. Definitions and Assumptions
- 2. Executive Summary
- 2.1. Introduction
- 3. Market Dynamics
- 3.1. Introduction
- 3.2. Market Drivers
- 3.2.1. ; Increasing Number Of Air Passengers; Use Of Portable Electronic Devices
- 3.3. Market Restrains
- 3.3.1. ; High Cost Of Connectivity Equipments
- 3.4. Market Trends
- 3.4.1. Military Segment is Expected to Dominate the Market During the Forecast Period
- 4. Market Factor Analysis
- 4.1. Porters Five Forces
- 4.2. Supply/Value Chain
- 4.3. PESTEL analysis
- 4.4. Market Entropy
- 4.5. Patent/Trademark Analysis
- 5. Global APAC Ammunition Industry Analysis, Insights and Forecast, 2019-2031
- 5.1. Market Analysis, Insights and Forecast - by Production Analysis
- 5.2. Market Analysis, Insights and Forecast - by Consumption Analysis
- 5.3. Market Analysis, Insights and Forecast - by Import Market Analysis (Value & Volume)
- 5.4. Market Analysis, Insights and Forecast - by Export Market Analysis (Value & Volume)
- 5.5. Market Analysis, Insights and Forecast - by Price Trend Analysis
- 5.6. Market Analysis, Insights and Forecast - by Region
- 5.6.1. North America
- 5.6.2. South America
- 5.6.3. Europe
- 5.6.4. Middle East & Africa
- 5.6.5. Asia Pacific
- 5.1. Market Analysis, Insights and Forecast - by Production Analysis
- 6. North America APAC Ammunition Industry Analysis, Insights and Forecast, 2019-2031
- 6.1. Market Analysis, Insights and Forecast - by Production Analysis
- 6.2. Market Analysis, Insights and Forecast - by Consumption Analysis
- 6.3. Market Analysis, Insights and Forecast - by Import Market Analysis (Value & Volume)
- 6.4. Market Analysis, Insights and Forecast - by Export Market Analysis (Value & Volume)
- 6.5. Market Analysis, Insights and Forecast - by Price Trend Analysis
- 6.1. Market Analysis, Insights and Forecast - by Production Analysis
- 7. South America APAC Ammunition Industry Analysis, Insights and Forecast, 2019-2031
- 7.1. Market Analysis, Insights and Forecast - by Production Analysis
- 7.2. Market Analysis, Insights and Forecast - by Consumption Analysis
- 7.3. Market Analysis, Insights and Forecast - by Import Market Analysis (Value & Volume)
- 7.4. Market Analysis, Insights and Forecast - by Export Market Analysis (Value & Volume)
- 7.5. Market Analysis, Insights and Forecast - by Price Trend Analysis
- 7.1. Market Analysis, Insights and Forecast - by Production Analysis
- 8. Europe APAC Ammunition Industry Analysis, Insights and Forecast, 2019-2031
- 8.1. Market Analysis, Insights and Forecast - by Production Analysis
- 8.2. Market Analysis, Insights and Forecast - by Consumption Analysis
- 8.3. Market Analysis, Insights and Forecast - by Import Market Analysis (Value & Volume)
- 8.4. Market Analysis, Insights and Forecast - by Export Market Analysis (Value & Volume)
- 8.5. Market Analysis, Insights and Forecast - by Price Trend Analysis
- 8.1. Market Analysis, Insights and Forecast - by Production Analysis
- 9. Middle East & Africa APAC Ammunition Industry Analysis, Insights and Forecast, 2019-2031
- 9.1. Market Analysis, Insights and Forecast - by Production Analysis
- 9.2. Market Analysis, Insights and Forecast - by Consumption Analysis
- 9.3. Market Analysis, Insights and Forecast - by Import Market Analysis (Value & Volume)
- 9.4. Market Analysis, Insights and Forecast - by Export Market Analysis (Value & Volume)
- 9.5. Market Analysis, Insights and Forecast - by Price Trend Analysis
- 9.1. Market Analysis, Insights and Forecast - by Production Analysis
- 10. Asia Pacific APAC Ammunition Industry Analysis, Insights and Forecast, 2019-2031
- 10.1. Market Analysis, Insights and Forecast - by Production Analysis
- 10.2. Market Analysis, Insights and Forecast - by Consumption Analysis
- 10.3. Market Analysis, Insights and Forecast - by Import Market Analysis (Value & Volume)
- 10.4. Market Analysis, Insights and Forecast - by Export Market Analysis (Value & Volume)
- 10.5. Market Analysis, Insights and Forecast - by Price Trend Analysis
- 10.1. Market Analysis, Insights and Forecast - by Production Analysis
- 11. United Kingdom APAC Ammunition Industry Analysis, Insights and Forecast, 2019-2031
- 11.1. Market Analysis, Insights and Forecast - By Country/Sub-region
- 11.1.1.
- 12. France APAC Ammunition Industry Analysis, Insights and Forecast, 2019-2031
- 12.1. Market Analysis, Insights and Forecast - By Country/Sub-region
- 12.1.1.
- 13. Germany APAC Ammunition Industry Analysis, Insights and Forecast, 2019-2031
- 13.1. Market Analysis, Insights and Forecast - By Country/Sub-region
- 13.1.1.
- 14. Russia APAC Ammunition Industry Analysis, Insights and Forecast, 2019-2031
- 14.1. Market Analysis, Insights and Forecast - By Country/Sub-region
- 14.1.1.
- 15. Rest of Europe APAC Ammunition Industry Analysis, Insights and Forecast, 2019-2031
- 15.1. Market Analysis, Insights and Forecast - By Country/Sub-region
- 15.1.1.
- 16. Competitive Analysis
- 16.1. Global Market Share Analysis 2024
- 16.2. Company Profiles
- 16.2.1 General Dynamics Corporation
- 16.2.1.1. Overview
- 16.2.1.2. Products
- 16.2.1.3. SWOT Analysis
- 16.2.1.4. Recent Developments
- 16.2.1.5. Financials (Based on Availability)
- 16.2.2 Rheinmetall AG
- 16.2.2.1. Overview
- 16.2.2.2. Products
- 16.2.2.3. SWOT Analysis
- 16.2.2.4. Recent Developments
- 16.2.2.5. Financials (Based on Availability)
- 16.2.3 Remington Arms Company LLC (Vista Outdoor Inc )
- 16.2.3.1. Overview
- 16.2.3.2. Products
- 16.2.3.3. SWOT Analysis
- 16.2.3.4. Recent Developments
- 16.2.3.5. Financials (Based on Availability)
- 16.2.4 CBC Global Ammunition
- 16.2.4.1. Overview
- 16.2.4.2. Products
- 16.2.4.3. SWOT Analysis
- 16.2.4.4. Recent Developments
- 16.2.4.5. Financials (Based on Availability)
- 16.2.5 Yantra India Limite
- 16.2.5.1. Overview
- 16.2.5.2. Products
- 16.2.5.3. SWOT Analysis
- 16.2.5.4. Recent Developments
- 16.2.5.5. Financials (Based on Availability)
- 16.2.6 BAE Systems PLC
- 16.2.6.1. Overview
- 16.2.6.2. Products
- 16.2.6.3. SWOT Analysis
- 16.2.6.4. Recent Developments
- 16.2.6.5. Financials (Based on Availability)
- 16.2.7 Winchester Ammunition (Olin Corporation)
- 16.2.7.1. Overview
- 16.2.7.2. Products
- 16.2.7.3. SWOT Analysis
- 16.2.7.4. Recent Developments
- 16.2.7.5. Financials (Based on Availability)
- 16.2.8 Munitions India Limited
- 16.2.8.1. Overview
- 16.2.8.2. Products
- 16.2.8.3. SWOT Analysis
- 16.2.8.4. Recent Developments
- 16.2.8.5. Financials (Based on Availability)
- 16.2.9 Singapore Technologies Engineering Ltd
- 16.2.9.1. Overview
- 16.2.9.2. Products
- 16.2.9.3. SWOT Analysis
- 16.2.9.4. Recent Developments
- 16.2.9.5. Financials (Based on Availability)
- 16.2.10 Poongson Corporation
- 16.2.10.1. Overview
- 16.2.10.2. Products
- 16.2.10.3. SWOT Analysis
- 16.2.10.4. Recent Developments
- 16.2.10.5. Financials (Based on Availability)
- 16.2.11 Hanwha Corporation
- 16.2.11.1. Overview
- 16.2.11.2. Products
- 16.2.11.3. SWOT Analysis
- 16.2.11.4. Recent Developments
- 16.2.11.5. Financials (Based on Availability)
- 16.2.12 KNDS NV
- 16.2.12.1. Overview
- 16.2.12.2. Products
- 16.2.12.3. SWOT Analysis
- 16.2.12.4. Recent Developments
- 16.2.12.5. Financials (Based on Availability)
- 16.2.1 General Dynamics Corporation
List of Figures
- Figure 1: Global APAC Ammunition Industry Revenue Breakdown (Million, %) by Region 2024 & 2032
- Figure 2: United Kingdom APAC Ammunition Industry Revenue (Million), by Country 2024 & 2032
- Figure 3: United Kingdom APAC Ammunition Industry Revenue Share (%), by Country 2024 & 2032
- Figure 4: France APAC Ammunition Industry Revenue (Million), by Country 2024 & 2032
- Figure 5: France APAC Ammunition Industry Revenue Share (%), by Country 2024 & 2032
- Figure 6: Germany APAC Ammunition Industry Revenue (Million), by Country 2024 & 2032
- Figure 7: Germany APAC Ammunition Industry Revenue Share (%), by Country 2024 & 2032
- Figure 8: Russia APAC Ammunition Industry Revenue (Million), by Country 2024 & 2032
- Figure 9: Russia APAC Ammunition Industry Revenue Share (%), by Country 2024 & 2032
- Figure 10: Rest of Europe APAC Ammunition Industry Revenue (Million), by Country 2024 & 2032
- Figure 11: Rest of Europe APAC Ammunition Industry Revenue Share (%), by Country 2024 & 2032
- Figure 12: North America APAC Ammunition Industry Revenue (Million), by Production Analysis 2024 & 2032
- Figure 13: North America APAC Ammunition Industry Revenue Share (%), by Production Analysis 2024 & 2032
- Figure 14: North America APAC Ammunition Industry Revenue (Million), by Consumption Analysis 2024 & 2032
- Figure 15: North America APAC Ammunition Industry Revenue Share (%), by Consumption Analysis 2024 & 2032
- Figure 16: North America APAC Ammunition Industry Revenue (Million), by Import Market Analysis (Value & Volume) 2024 & 2032
- Figure 17: North America APAC Ammunition Industry Revenue Share (%), by Import Market Analysis (Value & Volume) 2024 & 2032
- Figure 18: North America APAC Ammunition Industry Revenue (Million), by Export Market Analysis (Value & Volume) 2024 & 2032
- Figure 19: North America APAC Ammunition Industry Revenue Share (%), by Export Market Analysis (Value & Volume) 2024 & 2032
- Figure 20: North America APAC Ammunition Industry Revenue (Million), by Price Trend Analysis 2024 & 2032
- Figure 21: North America APAC Ammunition Industry Revenue Share (%), by Price Trend Analysis 2024 & 2032
- Figure 22: North America APAC Ammunition Industry Revenue (Million), by Country 2024 & 2032
- Figure 23: North America APAC Ammunition Industry Revenue Share (%), by Country 2024 & 2032
- Figure 24: South America APAC Ammunition Industry Revenue (Million), by Production Analysis 2024 & 2032
- Figure 25: South America APAC Ammunition Industry Revenue Share (%), by Production Analysis 2024 & 2032
- Figure 26: South America APAC Ammunition Industry Revenue (Million), by Consumption Analysis 2024 & 2032
- Figure 27: South America APAC Ammunition Industry Revenue Share (%), by Consumption Analysis 2024 & 2032
- Figure 28: South America APAC Ammunition Industry Revenue (Million), by Import Market Analysis (Value & Volume) 2024 & 2032
- Figure 29: South America APAC Ammunition Industry Revenue Share (%), by Import Market Analysis (Value & Volume) 2024 & 2032
- Figure 30: South America APAC Ammunition Industry Revenue (Million), by Export Market Analysis (Value & Volume) 2024 & 2032
- Figure 31: South America APAC Ammunition Industry Revenue Share (%), by Export Market Analysis (Value & Volume) 2024 & 2032
- Figure 32: South America APAC Ammunition Industry Revenue (Million), by Price Trend Analysis 2024 & 2032
- Figure 33: South America APAC Ammunition Industry Revenue Share (%), by Price Trend Analysis 2024 & 2032
- Figure 34: South America APAC Ammunition Industry Revenue (Million), by Country 2024 & 2032
- Figure 35: South America APAC Ammunition Industry Revenue Share (%), by Country 2024 & 2032
- Figure 36: Europe APAC Ammunition Industry Revenue (Million), by Production Analysis 2024 & 2032
- Figure 37: Europe APAC Ammunition Industry Revenue Share (%), by Production Analysis 2024 & 2032
- Figure 38: Europe APAC Ammunition Industry Revenue (Million), by Consumption Analysis 2024 & 2032
- Figure 39: Europe APAC Ammunition Industry Revenue Share (%), by Consumption Analysis 2024 & 2032
- Figure 40: Europe APAC Ammunition Industry Revenue (Million), by Import Market Analysis (Value & Volume) 2024 & 2032
- Figure 41: Europe APAC Ammunition Industry Revenue Share (%), by Import Market Analysis (Value & Volume) 2024 & 2032
- Figure 42: Europe APAC Ammunition Industry Revenue (Million), by Export Market Analysis (Value & Volume) 2024 & 2032
- Figure 43: Europe APAC Ammunition Industry Revenue Share (%), by Export Market Analysis (Value & Volume) 2024 & 2032
- Figure 44: Europe APAC Ammunition Industry Revenue (Million), by Price Trend Analysis 2024 & 2032
- Figure 45: Europe APAC Ammunition Industry Revenue Share (%), by Price Trend Analysis 2024 & 2032
- Figure 46: Europe APAC Ammunition Industry Revenue (Million), by Country 2024 & 2032
- Figure 47: Europe APAC Ammunition Industry Revenue Share (%), by Country 2024 & 2032
- Figure 48: Middle East & Africa APAC Ammunition Industry Revenue (Million), by Production Analysis 2024 & 2032
- Figure 49: Middle East & Africa APAC Ammunition Industry Revenue Share (%), by Production Analysis 2024 & 2032
- Figure 50: Middle East & Africa APAC Ammunition Industry Revenue (Million), by Consumption Analysis 2024 & 2032
- Figure 51: Middle East & Africa APAC Ammunition Industry Revenue Share (%), by Consumption Analysis 2024 & 2032
- Figure 52: Middle East & Africa APAC Ammunition Industry Revenue (Million), by Import Market Analysis (Value & Volume) 2024 & 2032
- Figure 53: Middle East & Africa APAC Ammunition Industry Revenue Share (%), by Import Market Analysis (Value & Volume) 2024 & 2032
- Figure 54: Middle East & Africa APAC Ammunition Industry Revenue (Million), by Export Market Analysis (Value & Volume) 2024 & 2032
- Figure 55: Middle East & Africa APAC Ammunition Industry Revenue Share (%), by Export Market Analysis (Value & Volume) 2024 & 2032
- Figure 56: Middle East & Africa APAC Ammunition Industry Revenue (Million), by Price Trend Analysis 2024 & 2032
- Figure 57: Middle East & Africa APAC Ammunition Industry Revenue Share (%), by Price Trend Analysis 2024 & 2032
- Figure 58: Middle East & Africa APAC Ammunition Industry Revenue (Million), by Country 2024 & 2032
- Figure 59: Middle East & Africa APAC Ammunition Industry Revenue Share (%), by Country 2024 & 2032
- Figure 60: Asia Pacific APAC Ammunition Industry Revenue (Million), by Production Analysis 2024 & 2032
- Figure 61: Asia Pacific APAC Ammunition Industry Revenue Share (%), by Production Analysis 2024 & 2032
- Figure 62: Asia Pacific APAC Ammunition Industry Revenue (Million), by Consumption Analysis 2024 & 2032
- Figure 63: Asia Pacific APAC Ammunition Industry Revenue Share (%), by Consumption Analysis 2024 & 2032
- Figure 64: Asia Pacific APAC Ammunition Industry Revenue (Million), by Import Market Analysis (Value & Volume) 2024 & 2032
- Figure 65: Asia Pacific APAC Ammunition Industry Revenue Share (%), by Import Market Analysis (Value & Volume) 2024 & 2032
- Figure 66: Asia Pacific APAC Ammunition Industry Revenue (Million), by Export Market Analysis (Value & Volume) 2024 & 2032
- Figure 67: Asia Pacific APAC Ammunition Industry Revenue Share (%), by Export Market Analysis (Value & Volume) 2024 & 2032
- Figure 68: Asia Pacific APAC Ammunition Industry Revenue (Million), by Price Trend Analysis 2024 & 2032
- Figure 69: Asia Pacific APAC Ammunition Industry Revenue Share (%), by Price Trend Analysis 2024 & 2032
- Figure 70: Asia Pacific APAC Ammunition Industry Revenue (Million), by Country 2024 & 2032
- Figure 71: Asia Pacific APAC Ammunition Industry Revenue Share (%), by Country 2024 & 2032
List of Tables
- Table 1: Global APAC Ammunition Industry Revenue Million Forecast, by Region 2019 & 2032
- Table 2: Global APAC Ammunition Industry Revenue Million Forecast, by Production Analysis 2019 & 2032
- Table 3: Global APAC Ammunition Industry Revenue Million Forecast, by Consumption Analysis 2019 & 2032
- Table 4: Global APAC Ammunition Industry Revenue Million Forecast, by Import Market Analysis (Value & Volume) 2019 & 2032
- Table 5: Global APAC Ammunition Industry Revenue Million Forecast, by Export Market Analysis (Value & Volume) 2019 & 2032
- Table 6: Global APAC Ammunition Industry Revenue Million Forecast, by Price Trend Analysis 2019 & 2032
- Table 7: Global APAC Ammunition Industry Revenue Million Forecast, by Region 2019 & 2032
- Table 8: Global APAC Ammunition Industry Revenue Million Forecast, by Country 2019 & 2032
- Table 9: APAC Ammunition Industry Revenue (Million) Forecast, by Application 2019 & 2032
- Table 10: Global APAC Ammunition Industry Revenue Million Forecast, by Country 2019 & 2032
- Table 11: APAC Ammunition Industry Revenue (Million) Forecast, by Application 2019 & 2032
- Table 12: Global APAC Ammunition Industry Revenue Million Forecast, by Country 2019 & 2032
- Table 13: APAC Ammunition Industry Revenue (Million) Forecast, by Application 2019 & 2032
- Table 14: Global APAC Ammunition Industry Revenue Million Forecast, by Country 2019 & 2032
- Table 15: APAC Ammunition Industry Revenue (Million) Forecast, by Application 2019 & 2032
- Table 16: Global APAC Ammunition Industry Revenue Million Forecast, by Country 2019 & 2032
- Table 17: APAC Ammunition Industry Revenue (Million) Forecast, by Application 2019 & 2032
- Table 18: Global APAC Ammunition Industry Revenue Million Forecast, by Production Analysis 2019 & 2032
- Table 19: Global APAC Ammunition Industry Revenue Million Forecast, by Consumption Analysis 2019 & 2032
- Table 20: Global APAC Ammunition Industry Revenue Million Forecast, by Import Market Analysis (Value & Volume) 2019 & 2032
- Table 21: Global APAC Ammunition Industry Revenue Million Forecast, by Export Market Analysis (Value & Volume) 2019 & 2032
- Table 22: Global APAC Ammunition Industry Revenue Million Forecast, by Price Trend Analysis 2019 & 2032
- Table 23: Global APAC Ammunition Industry Revenue Million Forecast, by Country 2019 & 2032
- Table 24: United States APAC Ammunition Industry Revenue (Million) Forecast, by Application 2019 & 2032
- Table 25: Canada APAC Ammunition Industry Revenue (Million) Forecast, by Application 2019 & 2032
- Table 26: Mexico APAC Ammunition Industry Revenue (Million) Forecast, by Application 2019 & 2032
- Table 27: Global APAC Ammunition Industry Revenue Million Forecast, by Production Analysis 2019 & 2032
- Table 28: Global APAC Ammunition Industry Revenue Million Forecast, by Consumption Analysis 2019 & 2032
- Table 29: Global APAC Ammunition Industry Revenue Million Forecast, by Import Market Analysis (Value & Volume) 2019 & 2032
- Table 30: Global APAC Ammunition Industry Revenue Million Forecast, by Export Market Analysis (Value & Volume) 2019 & 2032
- Table 31: Global APAC Ammunition Industry Revenue Million Forecast, by Price Trend Analysis 2019 & 2032
- Table 32: Global APAC Ammunition Industry Revenue Million Forecast, by Country 2019 & 2032
- Table 33: Brazil APAC Ammunition Industry Revenue (Million) Forecast, by Application 2019 & 2032
- Table 34: Argentina APAC Ammunition Industry Revenue (Million) Forecast, by Application 2019 & 2032
- Table 35: Rest of South America APAC Ammunition Industry Revenue (Million) Forecast, by Application 2019 & 2032
- Table 36: Global APAC Ammunition Industry Revenue Million Forecast, by Production Analysis 2019 & 2032
- Table 37: Global APAC Ammunition Industry Revenue Million Forecast, by Consumption Analysis 2019 & 2032
- Table 38: Global APAC Ammunition Industry Revenue Million Forecast, by Import Market Analysis (Value & Volume) 2019 & 2032
- Table 39: Global APAC Ammunition Industry Revenue Million Forecast, by Export Market Analysis (Value & Volume) 2019 & 2032
- Table 40: Global APAC Ammunition Industry Revenue Million Forecast, by Price Trend Analysis 2019 & 2032
- Table 41: Global APAC Ammunition Industry Revenue Million Forecast, by Country 2019 & 2032
- Table 42: United Kingdom APAC Ammunition Industry Revenue (Million) Forecast, by Application 2019 & 2032
- Table 43: Germany APAC Ammunition Industry Revenue (Million) Forecast, by Application 2019 & 2032
- Table 44: France APAC Ammunition Industry Revenue (Million) Forecast, by Application 2019 & 2032
- Table 45: Italy APAC Ammunition Industry Revenue (Million) Forecast, by Application 2019 & 2032
- Table 46: Spain APAC Ammunition Industry Revenue (Million) Forecast, by Application 2019 & 2032
- Table 47: Russia APAC Ammunition Industry Revenue (Million) Forecast, by Application 2019 & 2032
- Table 48: Benelux APAC Ammunition Industry Revenue (Million) Forecast, by Application 2019 & 2032
- Table 49: Nordics APAC Ammunition Industry Revenue (Million) Forecast, by Application 2019 & 2032
- Table 50: Rest of Europe APAC Ammunition Industry Revenue (Million) Forecast, by Application 2019 & 2032
- Table 51: Global APAC Ammunition Industry Revenue Million Forecast, by Production Analysis 2019 & 2032
- Table 52: Global APAC Ammunition Industry Revenue Million Forecast, by Consumption Analysis 2019 & 2032
- Table 53: Global APAC Ammunition Industry Revenue Million Forecast, by Import Market Analysis (Value & Volume) 2019 & 2032
- Table 54: Global APAC Ammunition Industry Revenue Million Forecast, by Export Market Analysis (Value & Volume) 2019 & 2032
- Table 55: Global APAC Ammunition Industry Revenue Million Forecast, by Price Trend Analysis 2019 & 2032
- Table 56: Global APAC Ammunition Industry Revenue Million Forecast, by Country 2019 & 2032
- Table 57: Turkey APAC Ammunition Industry Revenue (Million) Forecast, by Application 2019 & 2032
- Table 58: Israel APAC Ammunition Industry Revenue (Million) Forecast, by Application 2019 & 2032
- Table 59: GCC APAC Ammunition Industry Revenue (Million) Forecast, by Application 2019 & 2032
- Table 60: North Africa APAC Ammunition Industry Revenue (Million) Forecast, by Application 2019 & 2032
- Table 61: South Africa APAC Ammunition Industry Revenue (Million) Forecast, by Application 2019 & 2032
- Table 62: Rest of Middle East & Africa APAC Ammunition Industry Revenue (Million) Forecast, by Application 2019 & 2032
- Table 63: Global APAC Ammunition Industry Revenue Million Forecast, by Production Analysis 2019 & 2032
- Table 64: Global APAC Ammunition Industry Revenue Million Forecast, by Consumption Analysis 2019 & 2032
- Table 65: Global APAC Ammunition Industry Revenue Million Forecast, by Import Market Analysis (Value & Volume) 2019 & 2032
- Table 66: Global APAC Ammunition Industry Revenue Million Forecast, by Export Market Analysis (Value & Volume) 2019 & 2032
- Table 67: Global APAC Ammunition Industry Revenue Million Forecast, by Price Trend Analysis 2019 & 2032
- Table 68: Global APAC Ammunition Industry Revenue Million Forecast, by Country 2019 & 2032
- Table 69: China APAC Ammunition Industry Revenue (Million) Forecast, by Application 2019 & 2032
- Table 70: India APAC Ammunition Industry Revenue (Million) Forecast, by Application 2019 & 2032
- Table 71: Japan APAC Ammunition Industry Revenue (Million) Forecast, by Application 2019 & 2032
- Table 72: South Korea APAC Ammunition Industry Revenue (Million) Forecast, by Application 2019 & 2032
- Table 73: ASEAN APAC Ammunition Industry Revenue (Million) Forecast, by Application 2019 & 2032
- Table 74: Oceania APAC Ammunition Industry Revenue (Million) Forecast, by Application 2019 & 2032
- Table 75: Rest of Asia Pacific APAC Ammunition Industry Revenue (Million) Forecast, by Application 2019 & 2032
Frequently Asked Questions
1. What is the projected Compound Annual Growth Rate (CAGR) of the APAC Ammunition Industry?
The projected CAGR is approximately 4.83%.
2. Which companies are prominent players in the APAC Ammunition Industry?
Key companies in the market include General Dynamics Corporation, Rheinmetall AG, Remington Arms Company LLC (Vista Outdoor Inc ), CBC Global Ammunition, Yantra India Limite, BAE Systems PLC, Winchester Ammunition (Olin Corporation), Munitions India Limited, Singapore Technologies Engineering Ltd, Poongson Corporation, Hanwha Corporation, KNDS NV.
3. What are the main segments of the APAC Ammunition Industry?
The market segments include Production Analysis, Consumption Analysis, Import Market Analysis (Value & Volume), Export Market Analysis (Value & Volume), Price Trend Analysis.
4. Can you provide details about the market size?
The market size is estimated to be USD 2.57 Million as of 2022.
5. What are some drivers contributing to market growth?
; Increasing Number Of Air Passengers; Use Of Portable Electronic Devices.
6. What are the notable trends driving market growth?
Military Segment is Expected to Dominate the Market During the Forecast Period.
7. Are there any restraints impacting market growth?
; High Cost Of Connectivity Equipments.
8. Can you provide examples of recent developments in the market?
February 2024: China showcased its newly developed ASN-301 loitering munition in Saudi Arabia. Designed to infiltrate adversary airspace, the ASN-301's main function is to loiter until it picks up a radar signal. Upon detection, the ASN-301 targets the signal and precisely strikes. Equipped with a warhead containing 7,000 fragments, the munition is activated by a proximity laser fuse, ensuring a lethal radius of 20 meters.
9. What pricing options are available for accessing the report?
Pricing options include single-user, multi-user, and enterprise licenses priced at USD 4750, USD 4950, and USD 6800 respectively.
10. Is the market size provided in terms of value or volume?
The market size is provided in terms of value, measured in Million.
11. Are there any specific market keywords associated with the report?
Yes, the market keyword associated with the report is "APAC Ammunition Industry," which aids in identifying and referencing the specific market segment covered.
12. How do I determine which pricing option suits my needs best?
The pricing options vary based on user requirements and access needs. Individual users may opt for single-user licenses, while businesses requiring broader access may choose multi-user or enterprise licenses for cost-effective access to the report.
13. Are there any additional resources or data provided in the APAC Ammunition Industry report?
While the report offers comprehensive insights, it's advisable to review the specific contents or supplementary materials provided to ascertain if additional resources or data are available.
14. How can I stay updated on further developments or reports in the APAC Ammunition Industry?
To stay informed about further developments, trends, and reports in the APAC Ammunition Industry, consider subscribing to industry newsletters, following relevant companies and organizations, or regularly checking reputable industry news sources and publications.
Methodology
Step 1 - Identification of Relevant Samples Size from Population Database


Step 2 - Approaches for Defining Global Market Size (Value, Volume* & Price*)

Note*: In applicable scenarios
Step 3 - Data Sources
Primary Research
- Web Analytics
- Survey Reports
- Research Institute
- Latest Research Reports
- Opinion Leaders
Secondary Research
- Annual Reports
- White Paper
- Latest Press Release
- Industry Association
- Paid Database
- Investor Presentations

Step 4 - Data Triangulation
Involves using different sources of information in order to increase the validity of a study
These sources are likely to be stakeholders in a program - participants, other researchers, program staff, other community members, and so on.
Then we put all data in single framework & apply various statistical tools to find out the dynamic on the market.
During the analysis stage, feedback from the stakeholder groups would be compared to determine areas of agreement as well as areas of divergence
