

Key Insights
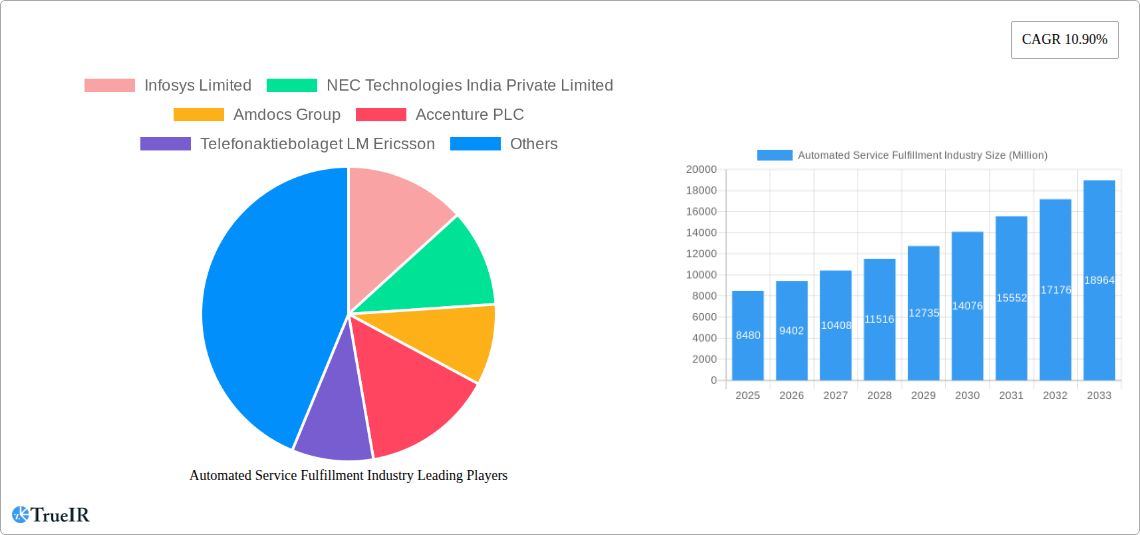
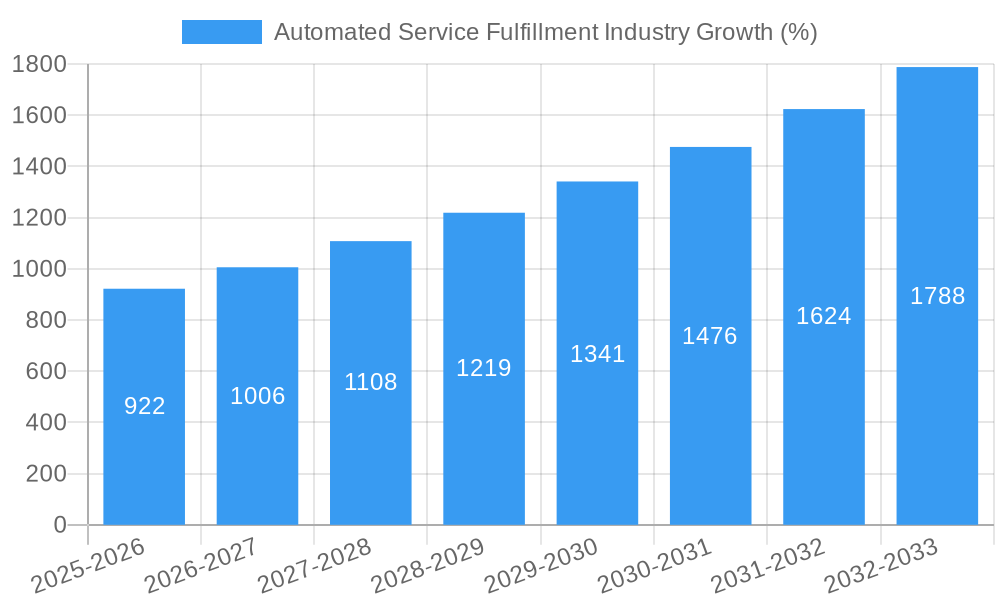
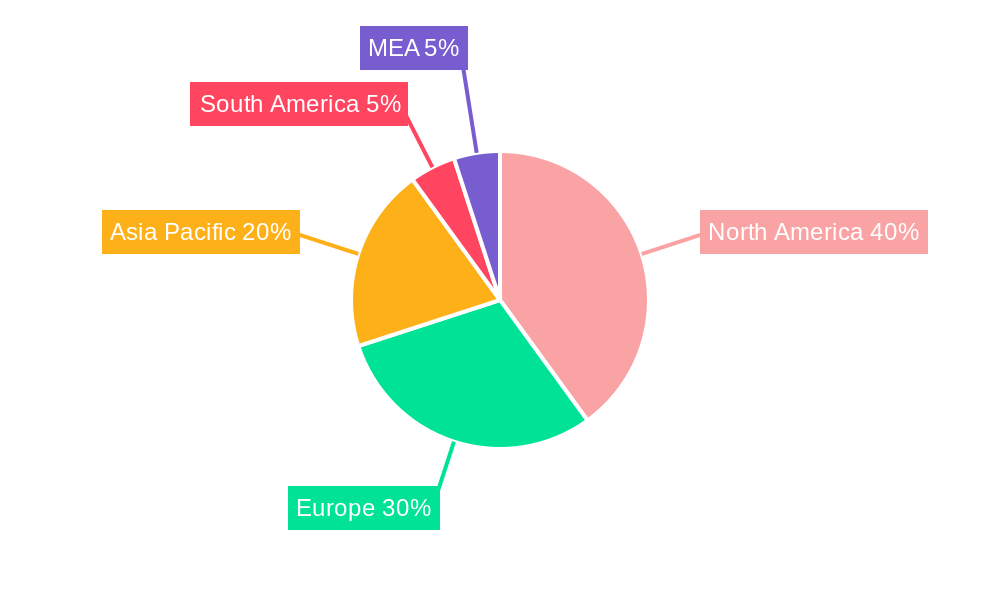
The Automated Service Fulfillment (ASF) market is experiencing robust growth, projected to reach $8.48 billion in 2025 and maintain a Compound Annual Growth Rate (CAGR) of 10.90% from 2025 to 2033. This expansion is driven by the increasing demand for faster, more efficient, and cost-effective service delivery across various industries. Key drivers include the rising adoption of cloud-based solutions, the expanding need for digital transformation initiatives, and the growing prevalence of subscription-based services. Businesses are increasingly seeking automated solutions to streamline their operational processes, improve customer experience, and gain a competitive edge. The shift towards self-service options and the need for 24/7 service availability further fuels market growth. Software-based solutions are currently dominating the market, followed by service-based offerings, reflecting a preference for flexible and scalable solutions. While on-premise deployments still hold a significant share, hosted and cloud-based solutions are rapidly gaining traction due to their cost-effectiveness and accessibility. Geographic expansion is also a significant factor, with North America and Europe currently leading the market, while the Asia-Pacific region is poised for significant growth due to increasing digitalization and technological advancements. However, the market faces challenges, including the high initial investment costs associated with implementing ASF systems and the need for specialized skills to manage and maintain these complex solutions. The competitive landscape is dynamic, with a mix of established players and emerging technology providers vying for market share.
The continued growth of the ASF market is expected to be fueled by several factors. The increasing complexity of service offerings and the need for sophisticated orchestration capabilities are creating opportunities for advanced ASF solutions. Furthermore, the integration of Artificial Intelligence (AI) and Machine Learning (ML) technologies is expected to significantly enhance the capabilities of ASF systems, leading to more intelligent and personalized service experiences. As organizations prioritize operational efficiency and customer satisfaction, the demand for sophisticated ASF solutions will likely continue to rise. The competitive landscape is expected to remain dynamic, with ongoing innovation and consolidation among market players. Companies are focusing on strategic partnerships and acquisitions to expand their product portfolios and enhance their market presence. The long-term outlook for the ASF market remains positive, with considerable opportunities for growth in diverse sectors and geographical regions.
Automated Service Fulfillment Industry Market Report: 2019-2033
This comprehensive report provides an in-depth analysis of the Automated Service Fulfillment industry, projecting a market valuation exceeding $XX Million by 2033. The report covers market structure, competitive landscape, key trends, dominant segments, and future outlook, offering invaluable insights for businesses, investors, and stakeholders. Leveraging data from the historical period (2019-2024), base year (2025), and forecast period (2025-2033), this report is your essential guide to navigating the dynamic world of automated service fulfillment.
Automated Service Fulfillment Industry Market Structure & Competitive Landscape
The Automated Service Fulfillment industry is characterized by a moderately concentrated market structure, with a few major players holding significant market share. The Herfindahl-Hirschman Index (HHI) is estimated at xx, indicating a moderately consolidated market. Key innovation drivers include advancements in AI, machine learning, and robotics, leading to more efficient and flexible fulfillment solutions. Regulatory impacts, such as data privacy regulations and labor laws, significantly influence operational costs and strategies. Product substitutes, like traditional manual fulfillment processes, face increasing pressure due to cost and efficiency advantages offered by automation. The end-user segmentation is broad, encompassing e-commerce businesses, retailers, logistics providers, and manufacturers. M&A activity in the sector has been moderate, with approximately xx deals recorded between 2019 and 2024, primarily driven by companies seeking to expand their service offerings and technological capabilities.
- Market Concentration: HHI estimated at xx
- Innovation Drivers: AI, Machine Learning, Robotics
- Regulatory Impacts: Data privacy, labor laws
- Product Substitutes: Manual Fulfillment Processes
- End-User Segmentation: E-commerce, Retail, Logistics, Manufacturing
- M&A Activity: Approximately xx deals (2019-2024)
Automated Service Fulfillment Industry Market Trends & Opportunities
The global Automated Service Fulfillment market is experiencing robust growth, with a projected CAGR of xx% during the forecast period (2025-2033). This expansion is driven by several key trends, including the explosive growth of e-commerce, the increasing demand for faster and more efficient delivery, and the rising adoption of automation technologies across various industries. The market penetration rate for automated fulfillment solutions is expected to increase from xx% in 2025 to xx% by 2033. Technological advancements, such as the integration of cloud computing and IoT, are further fueling market growth. Consumer preferences for seamless and timely delivery are creating strong demand for advanced fulfillment solutions. The competitive landscape is becoming increasingly dynamic, with established players and new entrants vying for market share through innovation, strategic partnerships, and acquisitions.
Dominant Markets & Segments in Automated Service Fulfillment Industry
The North American region currently holds the largest market share in the automated service fulfillment industry, driven by factors such as strong e-commerce growth and advanced technological infrastructure. However, the Asia-Pacific region is projected to witness the fastest growth rate during the forecast period due to rising disposable incomes, expanding e-commerce penetration, and supportive government policies.
- By Type: The Software segment dominates, projected to reach $XX Million by 2033.
- By Service Order Management: Services segment holds significant market share due to increasing demand for managed services.
- By Deployment Mode: Hosted solutions are gaining traction due to scalability and cost-effectiveness, projected to reach $XX Million by 2033.
Key Growth Drivers:
- North America: Advanced technological infrastructure, high e-commerce penetration.
- Asia-Pacific: Rising disposable incomes, expanding e-commerce, supportive government policies.
Automated Service Fulfillment Industry Product Analysis
The automated service fulfillment industry showcases a range of innovative products, including sophisticated warehouse management systems (WMS), robotic process automation (RPA) tools, and advanced automated guided vehicles (AGVs). These solutions offer significant competitive advantages by improving efficiency, reducing operational costs, and enhancing delivery speed and accuracy. The market is witnessing a trend toward integrated solutions that combine various technologies to create highly optimized fulfillment processes. The success of these products hinges on their seamless integration with existing systems, user-friendliness, and scalability.
Key Drivers, Barriers & Challenges in Automated Service Fulfillment Industry
Key Drivers:
The market is propelled by the escalating demand for faster and more efficient order fulfillment driven by e-commerce expansion. Technological advancements, like AI-powered automation and improved robotics, enhance efficiency and accuracy. Favorable government policies promoting automation and technological innovation are further boosting industry growth.
Challenges:
High initial investment costs for implementation of automation systems pose a barrier for smaller businesses. Supply chain disruptions can significantly affect operational efficiency, leading to delays and increased costs. Regulatory complexities, concerning data privacy and labor regulations, add to the challenges faced by companies in this sector. Intense competition and pressure to constantly innovate can also affect profitability. These challenges are estimated to impact market growth by approximately xx% during the forecast period.
Growth Drivers in the Automated Service Fulfillment Industry Market
Several factors contribute to the growth of the automated service fulfillment industry. The surge in e-commerce and omnichannel retailing significantly increases demand for efficient order fulfillment. Technological advancements, such as AI and machine learning, enhance automation capabilities and improve overall efficiency. Government initiatives supporting automation and digital transformation further fuel industry growth. These factors are collectively estimated to drive market growth by xx% annually.
Challenges Impacting Automated Service Fulfillment Industry Growth
Significant challenges hinder the growth of the automated service fulfillment industry. High implementation costs and integration complexities often deter small and medium-sized businesses from adopting automation. Supply chain vulnerabilities and disruptions can negatively impact operational efficiency and delivery timelines. Stringent regulatory frameworks related to data privacy and worker safety add complexity and increase operational costs. These factors contribute to a projected xx% reduction in market growth potential during the forecast period.
Key Players Shaping the Automated Service Fulfillment Industry Market
- Infosys Limited
- NEC Technologies India Private Limited
- Amdocs Group
- Accenture PLC
- Telefonaktiebolaget LM Ericsson
- Cisco Systems Inc
- TATA Communications Ltd
- Hewlett Packard Enterprise Development LP
- TIBCO Software Inc
- Suntech S A
- Comarch SA
Significant Automated Service Fulfillment Industry Milestones
- September 2023: Amazon India launched multi-channel fulfillment (MCF), expanding its reach and impacting smaller retailers.
- February 2023: AutoStore introduced a pay-per-pick service, lowering the barrier to entry for smaller businesses adopting automation.
Future Outlook for Automated Service Fulfillment Industry Market
The future of the automated service fulfillment industry is bright, driven by continued growth in e-commerce, technological advancements, and supportive government policies. Strategic partnerships and acquisitions will likely shape the competitive landscape. The increasing demand for efficient and sustainable fulfillment solutions will further drive market expansion, opening significant opportunities for companies in the sector. The market is expected to witness sustained growth, driven by innovative solutions and a rising demand for efficient and reliable order fulfillment.
Automated Service Fulfillment Industry Segmentation
-
1. Type
-
1.1. Software
- 1.1.1. Network Management
- 1.1.2. Inventory Management
- 1.1.3. Service Order Management
- 1.2. Services
-
1.1. Software
-
2. Deployment Mode
- 2.1. On-Premise
- 2.2. Hosted
Automated Service Fulfillment Industry Segmentation By Geography
- 1. North America
- 2. Europe
- 3. Asia Pacific
- 4. Rest of the World
Automated Service Fulfillment Industry REPORT HIGHLIGHTS
| Aspects | Details |
|---|---|
| Study Period | 2019-2033 |
| Base Year | 2024 |
| Estimated Year | 2025 |
| Forecast Period | 2025-2033 |
| Historical Period | 2019-2024 |
| Growth Rate | CAGR of 10.90% from 2019-2033 |
| Segmentation |
|
Table of Contents
- 1. Introduction
- 1.1. Research Scope
- 1.2. Market Segmentation
- 1.3. Research Methodology
- 1.4. Definitions and Assumptions
- 2. Executive Summary
- 2.1. Introduction
- 3. Market Dynamics
- 3.1. Introduction
- 3.2. Market Drivers
- 3.2.1 Increasing Network Automation and Increasing Demand for Automated
- 3.2.2 Real-time Services; Rapid Adoption of Virtualized Network Functions into Usable Components for Customer Service Creation
- 3.3. Market Restrains
- 3.3.1. Lack in Awareness
- 3.4. Market Trends
- 3.4.1. Software Segment is Analyzed to Hold Significant Market Share
- 4. Market Factor Analysis
- 4.1. Porters Five Forces
- 4.2. Supply/Value Chain
- 4.3. PESTEL analysis
- 4.4. Market Entropy
- 4.5. Patent/Trademark Analysis
- 5. Global Automated Service Fulfillment Industry Analysis, Insights and Forecast, 2019-2031
- 5.1. Market Analysis, Insights and Forecast - by Type
- 5.1.1. Software
- 5.1.1.1. Network Management
- 5.1.1.2. Inventory Management
- 5.1.1.3. Service Order Management
- 5.1.2. Services
- 5.1.1. Software
- 5.2. Market Analysis, Insights and Forecast - by Deployment Mode
- 5.2.1. On-Premise
- 5.2.2. Hosted
- 5.3. Market Analysis, Insights and Forecast - by Region
- 5.3.1. North America
- 5.3.2. Europe
- 5.3.3. Asia Pacific
- 5.3.4. Rest of the World
- 5.1. Market Analysis, Insights and Forecast - by Type
- 6. North America Automated Service Fulfillment Industry Analysis, Insights and Forecast, 2019-2031
- 6.1. Market Analysis, Insights and Forecast - by Type
- 6.1.1. Software
- 6.1.1.1. Network Management
- 6.1.1.2. Inventory Management
- 6.1.1.3. Service Order Management
- 6.1.2. Services
- 6.1.1. Software
- 6.2. Market Analysis, Insights and Forecast - by Deployment Mode
- 6.2.1. On-Premise
- 6.2.2. Hosted
- 6.1. Market Analysis, Insights and Forecast - by Type
- 7. Europe Automated Service Fulfillment Industry Analysis, Insights and Forecast, 2019-2031
- 7.1. Market Analysis, Insights and Forecast - by Type
- 7.1.1. Software
- 7.1.1.1. Network Management
- 7.1.1.2. Inventory Management
- 7.1.1.3. Service Order Management
- 7.1.2. Services
- 7.1.1. Software
- 7.2. Market Analysis, Insights and Forecast - by Deployment Mode
- 7.2.1. On-Premise
- 7.2.2. Hosted
- 7.1. Market Analysis, Insights and Forecast - by Type
- 8. Asia Pacific Automated Service Fulfillment Industry Analysis, Insights and Forecast, 2019-2031
- 8.1. Market Analysis, Insights and Forecast - by Type
- 8.1.1. Software
- 8.1.1.1. Network Management
- 8.1.1.2. Inventory Management
- 8.1.1.3. Service Order Management
- 8.1.2. Services
- 8.1.1. Software
- 8.2. Market Analysis, Insights and Forecast - by Deployment Mode
- 8.2.1. On-Premise
- 8.2.2. Hosted
- 8.1. Market Analysis, Insights and Forecast - by Type
- 9. Rest of the World Automated Service Fulfillment Industry Analysis, Insights and Forecast, 2019-2031
- 9.1. Market Analysis, Insights and Forecast - by Type
- 9.1.1. Software
- 9.1.1.1. Network Management
- 9.1.1.2. Inventory Management
- 9.1.1.3. Service Order Management
- 9.1.2. Services
- 9.1.1. Software
- 9.2. Market Analysis, Insights and Forecast - by Deployment Mode
- 9.2.1. On-Premise
- 9.2.2. Hosted
- 9.1. Market Analysis, Insights and Forecast - by Type
- 10. North America Automated Service Fulfillment Industry Analysis, Insights and Forecast, 2019-2031
- 10.1. Market Analysis, Insights and Forecast - By Country/Sub-region
- 10.1.1 United States
- 10.1.2 Canada
- 10.1.3 Mexico
- 11. Europe Automated Service Fulfillment Industry Analysis, Insights and Forecast, 2019-2031
- 11.1. Market Analysis, Insights and Forecast - By Country/Sub-region
- 11.1.1 Germany
- 11.1.2 United Kingdom
- 11.1.3 France
- 11.1.4 Spain
- 11.1.5 Italy
- 11.1.6 Spain
- 11.1.7 Belgium
- 11.1.8 Netherland
- 11.1.9 Nordics
- 11.1.10 Rest of Europe
- 12. Asia Pacific Automated Service Fulfillment Industry Analysis, Insights and Forecast, 2019-2031
- 12.1. Market Analysis, Insights and Forecast - By Country/Sub-region
- 12.1.1 China
- 12.1.2 Japan
- 12.1.3 India
- 12.1.4 South Korea
- 12.1.5 Southeast Asia
- 12.1.6 Australia
- 12.1.7 Indonesia
- 12.1.8 Phillipes
- 12.1.9 Singapore
- 12.1.10 Thailandc
- 12.1.11 Rest of Asia Pacific
- 13. South America Automated Service Fulfillment Industry Analysis, Insights and Forecast, 2019-2031
- 13.1. Market Analysis, Insights and Forecast - By Country/Sub-region
- 13.1.1 Brazil
- 13.1.2 Argentina
- 13.1.3 Peru
- 13.1.4 Chile
- 13.1.5 Colombia
- 13.1.6 Ecuador
- 13.1.7 Venezuela
- 13.1.8 Rest of South America
- 14. North America Automated Service Fulfillment Industry Analysis, Insights and Forecast, 2019-2031
- 14.1. Market Analysis, Insights and Forecast - By Country/Sub-region
- 14.1.1 United States
- 14.1.2 Canada
- 14.1.3 Mexico
- 15. MEA Automated Service Fulfillment Industry Analysis, Insights and Forecast, 2019-2031
- 15.1. Market Analysis, Insights and Forecast - By Country/Sub-region
- 15.1.1 United Arab Emirates
- 15.1.2 Saudi Arabia
- 15.1.3 South Africa
- 15.1.4 Rest of Middle East and Africa
- 16. Competitive Analysis
- 16.1. Global Market Share Analysis 2024
- 16.2. Company Profiles
- 16.2.1 Infosys Limited
- 16.2.1.1. Overview
- 16.2.1.2. Products
- 16.2.1.3. SWOT Analysis
- 16.2.1.4. Recent Developments
- 16.2.1.5. Financials (Based on Availability)
- 16.2.2 NEC Technologies India Private Limited
- 16.2.2.1. Overview
- 16.2.2.2. Products
- 16.2.2.3. SWOT Analysis
- 16.2.2.4. Recent Developments
- 16.2.2.5. Financials (Based on Availability)
- 16.2.3 Amdocs Group
- 16.2.3.1. Overview
- 16.2.3.2. Products
- 16.2.3.3. SWOT Analysis
- 16.2.3.4. Recent Developments
- 16.2.3.5. Financials (Based on Availability)
- 16.2.4 Accenture PLC
- 16.2.4.1. Overview
- 16.2.4.2. Products
- 16.2.4.3. SWOT Analysis
- 16.2.4.4. Recent Developments
- 16.2.4.5. Financials (Based on Availability)
- 16.2.5 Telefonaktiebolaget LM Ericsson
- 16.2.5.1. Overview
- 16.2.5.2. Products
- 16.2.5.3. SWOT Analysis
- 16.2.5.4. Recent Developments
- 16.2.5.5. Financials (Based on Availability)
- 16.2.6 Cisco Systems Inc
- 16.2.6.1. Overview
- 16.2.6.2. Products
- 16.2.6.3. SWOT Analysis
- 16.2.6.4. Recent Developments
- 16.2.6.5. Financials (Based on Availability)
- 16.2.7 TATA Communications Ltd
- 16.2.7.1. Overview
- 16.2.7.2. Products
- 16.2.7.3. SWOT Analysis
- 16.2.7.4. Recent Developments
- 16.2.7.5. Financials (Based on Availability)
- 16.2.8 Hewlett Packard Enterprise Development LP
- 16.2.8.1. Overview
- 16.2.8.2. Products
- 16.2.8.3. SWOT Analysis
- 16.2.8.4. Recent Developments
- 16.2.8.5. Financials (Based on Availability)
- 16.2.9 TIBCO Software Inc
- 16.2.9.1. Overview
- 16.2.9.2. Products
- 16.2.9.3. SWOT Analysis
- 16.2.9.4. Recent Developments
- 16.2.9.5. Financials (Based on Availability)
- 16.2.10 Suntech S A
- 16.2.10.1. Overview
- 16.2.10.2. Products
- 16.2.10.3. SWOT Analysis
- 16.2.10.4. Recent Developments
- 16.2.10.5. Financials (Based on Availability)
- 16.2.11 Comarch SA
- 16.2.11.1. Overview
- 16.2.11.2. Products
- 16.2.11.3. SWOT Analysis
- 16.2.11.4. Recent Developments
- 16.2.11.5. Financials (Based on Availability)
- 16.2.1 Infosys Limited
List of Figures
- Figure 1: Global Automated Service Fulfillment Industry Revenue Breakdown (Million, %) by Region 2024 & 2032
- Figure 2: North America Automated Service Fulfillment Industry Revenue (Million), by Country 2024 & 2032
- Figure 3: North America Automated Service Fulfillment Industry Revenue Share (%), by Country 2024 & 2032
- Figure 4: Europe Automated Service Fulfillment Industry Revenue (Million), by Country 2024 & 2032
- Figure 5: Europe Automated Service Fulfillment Industry Revenue Share (%), by Country 2024 & 2032
- Figure 6: Asia Pacific Automated Service Fulfillment Industry Revenue (Million), by Country 2024 & 2032
- Figure 7: Asia Pacific Automated Service Fulfillment Industry Revenue Share (%), by Country 2024 & 2032
- Figure 8: South America Automated Service Fulfillment Industry Revenue (Million), by Country 2024 & 2032
- Figure 9: South America Automated Service Fulfillment Industry Revenue Share (%), by Country 2024 & 2032
- Figure 10: North America Automated Service Fulfillment Industry Revenue (Million), by Country 2024 & 2032
- Figure 11: North America Automated Service Fulfillment Industry Revenue Share (%), by Country 2024 & 2032
- Figure 12: MEA Automated Service Fulfillment Industry Revenue (Million), by Country 2024 & 2032
- Figure 13: MEA Automated Service Fulfillment Industry Revenue Share (%), by Country 2024 & 2032
- Figure 14: North America Automated Service Fulfillment Industry Revenue (Million), by Type 2024 & 2032
- Figure 15: North America Automated Service Fulfillment Industry Revenue Share (%), by Type 2024 & 2032
- Figure 16: North America Automated Service Fulfillment Industry Revenue (Million), by Deployment Mode 2024 & 2032
- Figure 17: North America Automated Service Fulfillment Industry Revenue Share (%), by Deployment Mode 2024 & 2032
- Figure 18: North America Automated Service Fulfillment Industry Revenue (Million), by Country 2024 & 2032
- Figure 19: North America Automated Service Fulfillment Industry Revenue Share (%), by Country 2024 & 2032
- Figure 20: Europe Automated Service Fulfillment Industry Revenue (Million), by Type 2024 & 2032
- Figure 21: Europe Automated Service Fulfillment Industry Revenue Share (%), by Type 2024 & 2032
- Figure 22: Europe Automated Service Fulfillment Industry Revenue (Million), by Deployment Mode 2024 & 2032
- Figure 23: Europe Automated Service Fulfillment Industry Revenue Share (%), by Deployment Mode 2024 & 2032
- Figure 24: Europe Automated Service Fulfillment Industry Revenue (Million), by Country 2024 & 2032
- Figure 25: Europe Automated Service Fulfillment Industry Revenue Share (%), by Country 2024 & 2032
- Figure 26: Asia Pacific Automated Service Fulfillment Industry Revenue (Million), by Type 2024 & 2032
- Figure 27: Asia Pacific Automated Service Fulfillment Industry Revenue Share (%), by Type 2024 & 2032
- Figure 28: Asia Pacific Automated Service Fulfillment Industry Revenue (Million), by Deployment Mode 2024 & 2032
- Figure 29: Asia Pacific Automated Service Fulfillment Industry Revenue Share (%), by Deployment Mode 2024 & 2032
- Figure 30: Asia Pacific Automated Service Fulfillment Industry Revenue (Million), by Country 2024 & 2032
- Figure 31: Asia Pacific Automated Service Fulfillment Industry Revenue Share (%), by Country 2024 & 2032
- Figure 32: Rest of the World Automated Service Fulfillment Industry Revenue (Million), by Type 2024 & 2032
- Figure 33: Rest of the World Automated Service Fulfillment Industry Revenue Share (%), by Type 2024 & 2032
- Figure 34: Rest of the World Automated Service Fulfillment Industry Revenue (Million), by Deployment Mode 2024 & 2032
- Figure 35: Rest of the World Automated Service Fulfillment Industry Revenue Share (%), by Deployment Mode 2024 & 2032
- Figure 36: Rest of the World Automated Service Fulfillment Industry Revenue (Million), by Country 2024 & 2032
- Figure 37: Rest of the World Automated Service Fulfillment Industry Revenue Share (%), by Country 2024 & 2032
List of Tables
- Table 1: Global Automated Service Fulfillment Industry Revenue Million Forecast, by Region 2019 & 2032
- Table 2: Global Automated Service Fulfillment Industry Revenue Million Forecast, by Type 2019 & 2032
- Table 3: Global Automated Service Fulfillment Industry Revenue Million Forecast, by Deployment Mode 2019 & 2032
- Table 4: Global Automated Service Fulfillment Industry Revenue Million Forecast, by Region 2019 & 2032
- Table 5: Global Automated Service Fulfillment Industry Revenue Million Forecast, by Country 2019 & 2032
- Table 6: United States Automated Service Fulfillment Industry Revenue (Million) Forecast, by Application 2019 & 2032
- Table 7: Canada Automated Service Fulfillment Industry Revenue (Million) Forecast, by Application 2019 & 2032
- Table 8: Mexico Automated Service Fulfillment Industry Revenue (Million) Forecast, by Application 2019 & 2032
- Table 9: Global Automated Service Fulfillment Industry Revenue Million Forecast, by Country 2019 & 2032
- Table 10: Germany Automated Service Fulfillment Industry Revenue (Million) Forecast, by Application 2019 & 2032
- Table 11: United Kingdom Automated Service Fulfillment Industry Revenue (Million) Forecast, by Application 2019 & 2032
- Table 12: France Automated Service Fulfillment Industry Revenue (Million) Forecast, by Application 2019 & 2032
- Table 13: Spain Automated Service Fulfillment Industry Revenue (Million) Forecast, by Application 2019 & 2032
- Table 14: Italy Automated Service Fulfillment Industry Revenue (Million) Forecast, by Application 2019 & 2032
- Table 15: Spain Automated Service Fulfillment Industry Revenue (Million) Forecast, by Application 2019 & 2032
- Table 16: Belgium Automated Service Fulfillment Industry Revenue (Million) Forecast, by Application 2019 & 2032
- Table 17: Netherland Automated Service Fulfillment Industry Revenue (Million) Forecast, by Application 2019 & 2032
- Table 18: Nordics Automated Service Fulfillment Industry Revenue (Million) Forecast, by Application 2019 & 2032
- Table 19: Rest of Europe Automated Service Fulfillment Industry Revenue (Million) Forecast, by Application 2019 & 2032
- Table 20: Global Automated Service Fulfillment Industry Revenue Million Forecast, by Country 2019 & 2032
- Table 21: China Automated Service Fulfillment Industry Revenue (Million) Forecast, by Application 2019 & 2032
- Table 22: Japan Automated Service Fulfillment Industry Revenue (Million) Forecast, by Application 2019 & 2032
- Table 23: India Automated Service Fulfillment Industry Revenue (Million) Forecast, by Application 2019 & 2032
- Table 24: South Korea Automated Service Fulfillment Industry Revenue (Million) Forecast, by Application 2019 & 2032
- Table 25: Southeast Asia Automated Service Fulfillment Industry Revenue (Million) Forecast, by Application 2019 & 2032
- Table 26: Australia Automated Service Fulfillment Industry Revenue (Million) Forecast, by Application 2019 & 2032
- Table 27: Indonesia Automated Service Fulfillment Industry Revenue (Million) Forecast, by Application 2019 & 2032
- Table 28: Phillipes Automated Service Fulfillment Industry Revenue (Million) Forecast, by Application 2019 & 2032
- Table 29: Singapore Automated Service Fulfillment Industry Revenue (Million) Forecast, by Application 2019 & 2032
- Table 30: Thailandc Automated Service Fulfillment Industry Revenue (Million) Forecast, by Application 2019 & 2032
- Table 31: Rest of Asia Pacific Automated Service Fulfillment Industry Revenue (Million) Forecast, by Application 2019 & 2032
- Table 32: Global Automated Service Fulfillment Industry Revenue Million Forecast, by Country 2019 & 2032
- Table 33: Brazil Automated Service Fulfillment Industry Revenue (Million) Forecast, by Application 2019 & 2032
- Table 34: Argentina Automated Service Fulfillment Industry Revenue (Million) Forecast, by Application 2019 & 2032
- Table 35: Peru Automated Service Fulfillment Industry Revenue (Million) Forecast, by Application 2019 & 2032
- Table 36: Chile Automated Service Fulfillment Industry Revenue (Million) Forecast, by Application 2019 & 2032
- Table 37: Colombia Automated Service Fulfillment Industry Revenue (Million) Forecast, by Application 2019 & 2032
- Table 38: Ecuador Automated Service Fulfillment Industry Revenue (Million) Forecast, by Application 2019 & 2032
- Table 39: Venezuela Automated Service Fulfillment Industry Revenue (Million) Forecast, by Application 2019 & 2032
- Table 40: Rest of South America Automated Service Fulfillment Industry Revenue (Million) Forecast, by Application 2019 & 2032
- Table 41: Global Automated Service Fulfillment Industry Revenue Million Forecast, by Country 2019 & 2032
- Table 42: United States Automated Service Fulfillment Industry Revenue (Million) Forecast, by Application 2019 & 2032
- Table 43: Canada Automated Service Fulfillment Industry Revenue (Million) Forecast, by Application 2019 & 2032
- Table 44: Mexico Automated Service Fulfillment Industry Revenue (Million) Forecast, by Application 2019 & 2032
- Table 45: Global Automated Service Fulfillment Industry Revenue Million Forecast, by Country 2019 & 2032
- Table 46: United Arab Emirates Automated Service Fulfillment Industry Revenue (Million) Forecast, by Application 2019 & 2032
- Table 47: Saudi Arabia Automated Service Fulfillment Industry Revenue (Million) Forecast, by Application 2019 & 2032
- Table 48: South Africa Automated Service Fulfillment Industry Revenue (Million) Forecast, by Application 2019 & 2032
- Table 49: Rest of Middle East and Africa Automated Service Fulfillment Industry Revenue (Million) Forecast, by Application 2019 & 2032
- Table 50: Global Automated Service Fulfillment Industry Revenue Million Forecast, by Type 2019 & 2032
- Table 51: Global Automated Service Fulfillment Industry Revenue Million Forecast, by Deployment Mode 2019 & 2032
- Table 52: Global Automated Service Fulfillment Industry Revenue Million Forecast, by Country 2019 & 2032
- Table 53: Global Automated Service Fulfillment Industry Revenue Million Forecast, by Type 2019 & 2032
- Table 54: Global Automated Service Fulfillment Industry Revenue Million Forecast, by Deployment Mode 2019 & 2032
- Table 55: Global Automated Service Fulfillment Industry Revenue Million Forecast, by Country 2019 & 2032
- Table 56: Global Automated Service Fulfillment Industry Revenue Million Forecast, by Type 2019 & 2032
- Table 57: Global Automated Service Fulfillment Industry Revenue Million Forecast, by Deployment Mode 2019 & 2032
- Table 58: Global Automated Service Fulfillment Industry Revenue Million Forecast, by Country 2019 & 2032
- Table 59: Global Automated Service Fulfillment Industry Revenue Million Forecast, by Type 2019 & 2032
- Table 60: Global Automated Service Fulfillment Industry Revenue Million Forecast, by Deployment Mode 2019 & 2032
- Table 61: Global Automated Service Fulfillment Industry Revenue Million Forecast, by Country 2019 & 2032
Frequently Asked Questions
1. What is the projected Compound Annual Growth Rate (CAGR) of the Automated Service Fulfillment Industry?
The projected CAGR is approximately 10.90%.
2. Which companies are prominent players in the Automated Service Fulfillment Industry?
Key companies in the market include Infosys Limited, NEC Technologies India Private Limited, Amdocs Group, Accenture PLC, Telefonaktiebolaget LM Ericsson, Cisco Systems Inc, TATA Communications Ltd, Hewlett Packard Enterprise Development LP, TIBCO Software Inc , Suntech S A, Comarch SA.
3. What are the main segments of the Automated Service Fulfillment Industry?
The market segments include Type, Deployment Mode.
4. Can you provide details about the market size?
The market size is estimated to be USD 8.48 Million as of 2022.
5. What are some drivers contributing to market growth?
Increasing Network Automation and Increasing Demand for Automated. Real-time Services; Rapid Adoption of Virtualized Network Functions into Usable Components for Customer Service Creation.
6. What are the notable trends driving market growth?
Software Segment is Analyzed to Hold Significant Market Share.
7. Are there any restraints impacting market growth?
Lack in Awareness.
8. Can you provide examples of recent developments in the market?
September 2023 - Amazon India launched multi-channel fulfillment (MCF) for sellers, including retailers and D2C brands, to help them handle customer orders from various channels. The MCF will allow sellers to utilize Amazon’s pan-India presence, fulfillment centers, and logistics network to take orders received on various channels, including their own websites.
9. What pricing options are available for accessing the report?
Pricing options include single-user, multi-user, and enterprise licenses priced at USD 4750, USD 5250, and USD 8750 respectively.
10. Is the market size provided in terms of value or volume?
The market size is provided in terms of value, measured in Million.
11. Are there any specific market keywords associated with the report?
Yes, the market keyword associated with the report is "Automated Service Fulfillment Industry," which aids in identifying and referencing the specific market segment covered.
12. How do I determine which pricing option suits my needs best?
The pricing options vary based on user requirements and access needs. Individual users may opt for single-user licenses, while businesses requiring broader access may choose multi-user or enterprise licenses for cost-effective access to the report.
13. Are there any additional resources or data provided in the Automated Service Fulfillment Industry report?
While the report offers comprehensive insights, it's advisable to review the specific contents or supplementary materials provided to ascertain if additional resources or data are available.
14. How can I stay updated on further developments or reports in the Automated Service Fulfillment Industry?
To stay informed about further developments, trends, and reports in the Automated Service Fulfillment Industry, consider subscribing to industry newsletters, following relevant companies and organizations, or regularly checking reputable industry news sources and publications.
Methodology
Step 1 - Identification of Relevant Samples Size from Population Database


Step 2 - Approaches for Defining Global Market Size (Value, Volume* & Price*)

Note*: In applicable scenarios
Step 3 - Data Sources
Primary Research
- Web Analytics
- Survey Reports
- Research Institute
- Latest Research Reports
- Opinion Leaders
Secondary Research
- Annual Reports
- White Paper
- Latest Press Release
- Industry Association
- Paid Database
- Investor Presentations

Step 4 - Data Triangulation
Involves using different sources of information in order to increase the validity of a study
These sources are likely to be stakeholders in a program - participants, other researchers, program staff, other community members, and so on.
Then we put all data in single framework & apply various statistical tools to find out the dynamic on the market.
During the analysis stage, feedback from the stakeholder groups would be compared to determine areas of agreement as well as areas of divergence
