

Key Insights
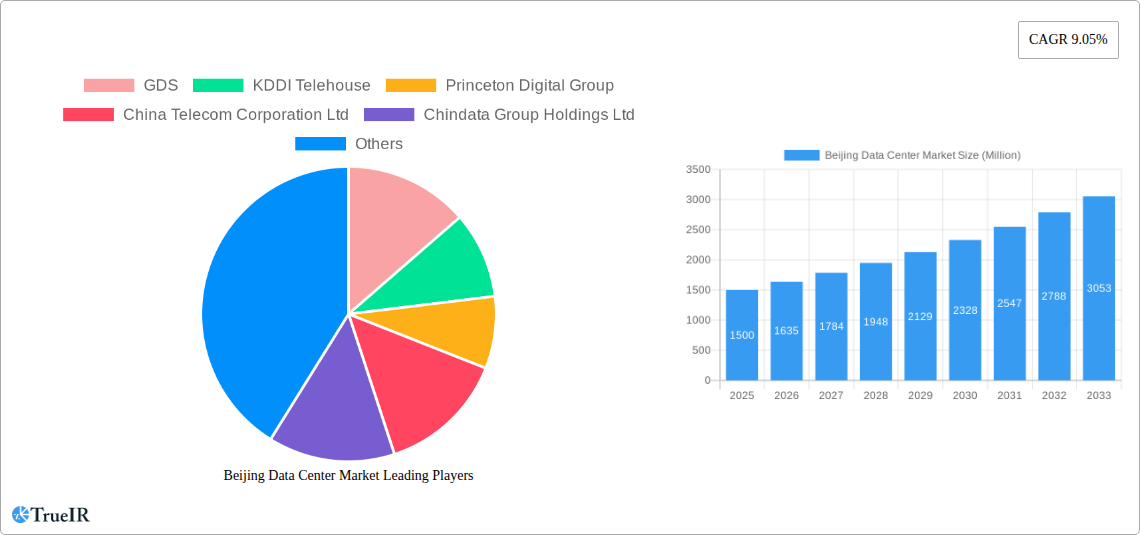
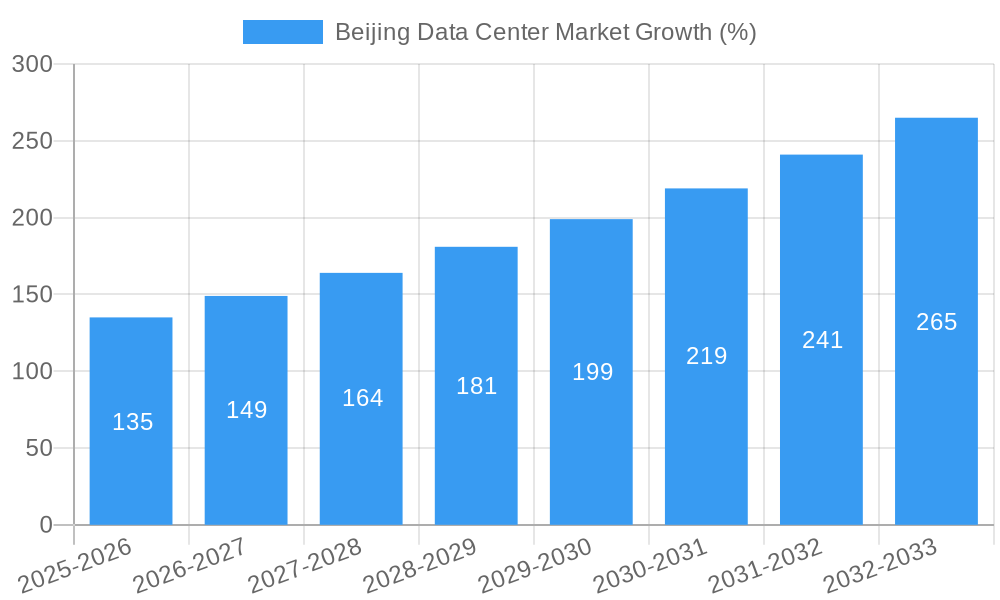
The Beijing data center market is experiencing robust growth, driven by increasing cloud adoption, burgeoning e-commerce activity, and the government's digital transformation initiatives. The market's Compound Annual Growth Rate (CAGR) of 9.05% from 2019 to 2024 suggests a significant expansion, which is projected to continue throughout the forecast period (2025-2033). This growth is fueled by the rising demand for colocation services, particularly from hyperscale providers seeking large-scale infrastructure in a strategically important location like Beijing. Key market segments include hyperscale colocation, cloud & IT services, and the rapidly expanding e-commerce sector. While specific regional breakdowns within China are not provided, it is reasonable to assume that Beijing, as a major economic and technological hub, commands a substantial share of the overall Chinese data center market. The market's growth is further facilitated by substantial investments in infrastructure and technological advancements. However, potential restraints could include regulatory hurdles, energy costs, and competition for skilled labor. The ongoing development of 5G networks and the increasing adoption of artificial intelligence and big data analytics will further stimulate market expansion in the coming years.
The competitive landscape involves a mix of global giants and domestic players. Companies such as GDS, KDDI Telehouse, Princeton Digital Group, China Telecom Corporation Ltd, and Chindata Group Holdings Ltd are prominent participants, vying for market share by offering diverse services, competitive pricing, and strategic partnerships. The market segmentation by Tier type (Tier 1, Tier 2, Tier 3), absorption rate (utilized, non-utilized), colocation type (retail, wholesale, hyperscale), and data center size (small, medium, large, massive, mega) offers a nuanced understanding of market dynamics. Future growth will likely be influenced by factors such as government policies promoting digital infrastructure, improvements in energy efficiency, and advancements in data center technology, particularly in areas like edge computing and sustainable data center design. Analyzing these segments and competitive dynamics is crucial for companies seeking to effectively penetrate and thrive within this evolving market.
This dynamic report provides a detailed analysis of the Beijing data center market, offering invaluable insights for investors, industry professionals, and strategic decision-makers. Leveraging a comprehensive study period (2019-2033), with a base year of 2025 and a forecast period spanning 2025-2033, this report offers a robust understanding of past performance, current trends, and future projections. The market is segmented by Tier Type (Tier 1, Tier 2, Tier 3), Absorption (Utilized, Non-Utilized), Colocation Type (Retail, Wholesale, Hyperscale), End-User (Cloud & IT, Telecom, Media & Entertainment, Government, BFSI, Manufacturing, E-Commerce, Other End-User), and DC Size (Small, Medium, Large, Massive, Mega). Key players analyzed include GDS, KDDI Telehouse, Princeton Digital Group, China Telecom Corporation Ltd, and Chindata Group Holdings Ltd.
Beijing Data Center Market Market Structure & Competitive Landscape
The Beijing data center market exhibits a moderately concentrated structure, with a few dominant players and a growing number of smaller, specialized providers. The market's concentration ratio (CR4) is estimated at xx% in 2025, indicating moderate dominance by the top four players. Innovation in areas like AI-powered resource management and edge computing significantly influences market dynamics. Regulatory changes impacting data sovereignty and cybersecurity compliance pose ongoing challenges. Product substitutes, such as cloud-based services, present a competitive threat, although data center colocation remains crucial for specific needs such as low-latency requirements.
- End-User Segmentation: The Cloud & IT sector is currently the largest end-user segment, accounting for approximately xx Million USD of market revenue in 2025, followed by the Telecom and Government sectors.
- M&A Trends: The historical period (2019-2024) witnessed xx M&A transactions in the Beijing data center market, with a total value of approximately xx Million USD. These transactions reflect consolidation within the industry and expansion of service portfolios. Future M&A activity is anticipated to accelerate, driven by a desire for economies of scale and access to advanced technologies.
Beijing Data Center Market Market Trends & Opportunities
The Beijing data center market is experiencing robust growth, driven by increasing data volumes, the expansion of cloud computing services, and government initiatives supporting digital transformation. The market size is projected to reach xx Million USD by 2033, exhibiting a CAGR of xx% during the forecast period (2025-2033). This expansion is fuelled by technological advancements such as 5G deployment and the increasing adoption of IoT devices. Consumer preference for enhanced digital experiences is accelerating the demand for high-speed, reliable data center services. Competitive dynamics are characterized by investments in infrastructure, strategic partnerships, and innovation in service offerings. Market penetration rates for hyperscale colocation are increasing rapidly, reflecting the demand from large-scale cloud providers.
Dominant Markets & Segments in Beijing Data Center Market
- Leading Segment: The Utilized segment dominates the market, accounting for xx% of total absorption in 2025. The rapid growth of the Cloud & IT sector is driving this dominance. Large and Mega-sized data centers are showing significant growth.
- Key Growth Drivers:
- Robust Government Support: Government initiatives focused on digital infrastructure development are creating a favorable environment for data center investment.
- Expanding Cloud Computing Adoption: The increasing reliance on cloud-based services is creating substantial demand for colocation services.
- Rising Data Volumes: The exponential growth in data is necessitating more data center capacity in Beijing.
Within the Tier Type, Tier 3 facilities demonstrate the highest growth rates in the forecast period, mainly due to cost-effectiveness and scalability. Within the Colocation Type, Wholesale colocation is gaining significant traction due to the increasing requirements of large enterprises and cloud providers.
Beijing Data Center Market Product Analysis
The Beijing data center market is witnessing significant product innovation, with a focus on energy efficiency, enhanced security features, and improved connectivity. Advancements in cooling technologies, power management systems, and network infrastructure are key drivers of product differentiation. The market favors data center solutions that offer high scalability, flexibility, and resilience to meet the demands of diverse customer requirements. The integration of AI and machine learning in data center management is also emerging as a key differentiator.
Key Drivers, Barriers & Challenges in Beijing Data Center Market
Key Drivers: The growth of e-commerce, the expansion of digital government services, and China's strategic focus on technological innovation are driving substantial demand. Increasing investment in 5G infrastructure further fuels growth.
Key Challenges: Regulatory complexities surrounding data privacy and security, coupled with potential supply chain disruptions and stiff competition, pose significant challenges. Power constraints and rising energy costs also create headwinds for data center expansion.
Growth Drivers in the Beijing Data Center Market Market
Technological advancements like AI and edge computing, economic factors such as increased government investment in digital infrastructure, and supportive regulatory policies concerning data centers are all major catalysts of the Beijing data center market's growth.
Challenges Impacting Beijing Data Center Market Growth
Regulatory hurdles surrounding data security, the increasing cost of energy, and competition from established players pose significant challenges to the growth of the Beijing data center market. Supply chain disruptions can also affect the timely delivery of critical infrastructure components.
Key Players Shaping the Beijing Data Center Market Market
- GDS
- KDDI Telehouse
- Princeton Digital Group
- China Telecom Corporation Ltd
- Chindata Group Holdings Ltd
Significant Beijing Data Center Market Industry Milestones
- July 2022: Kappel announced data center development plans in Beijing following its acquisition of Huailai Data Centre.
- February 2023: CapitaLand Investment Limited launched CapitaLand China Data Centre Partners (CDCP) to invest in data centers across China, including Beijing.
Future Outlook for Beijing Data Center Market Market
The Beijing data center market is poised for sustained growth, driven by the ongoing digital transformation across various sectors and the increasing demand for cloud services. Strategic partnerships, investments in sustainable technologies, and the continued focus on infrastructure development will present significant opportunities. The market's future is bright, underpinned by a supportive policy environment and the country's commitment to technological advancement.
Beijing Data Center Market Segmentation
-
1. DC Size
- 1.1. Small
- 1.2. Medium
- 1.3. Large
- 1.4. Massive
- 1.5. Mega
-
2. Tier Type
- 2.1. Tier 1 & 2
- 2.2. Tier 3
- 2.3. Tier 4
-
3. Absorption
-
3.1. Utilized
-
3.1.1. Colocation Type
- 3.1.1.1. Retail
- 3.1.1.2. Wholesale
- 3.1.1.3. Hyperscale
-
3.1.2. End-User
- 3.1.2.1. Cloud & IT
- 3.1.2.2. Telecom
- 3.1.2.3. Media & Entertainment
- 3.1.2.4. Government
- 3.1.2.5. BFSI
- 3.1.2.6. Manufacturing
- 3.1.2.7. E-Commerce
- 3.1.2.8. Other End-User
-
3.1.1. Colocation Type
- 3.2. Non-Utilized
-
3.1. Utilized
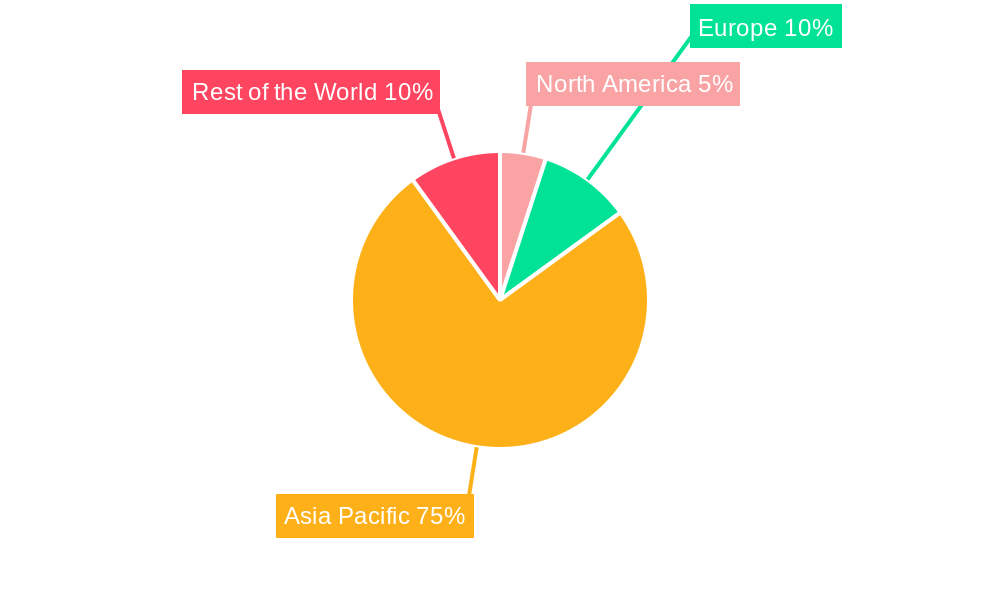
Beijing Data Center Market Segmentation By Geography
-
1. North America
- 1.1. United States
- 1.2. Canada
- 1.3. Mexico
-
2. South America
- 2.1. Brazil
- 2.2. Argentina
- 2.3. Rest of South America
-
3. Europe
- 3.1. United Kingdom
- 3.2. Germany
- 3.3. France
- 3.4. Italy
- 3.5. Spain
- 3.6. Russia
- 3.7. Benelux
- 3.8. Nordics
- 3.9. Rest of Europe
-
4. Middle East & Africa
- 4.1. Turkey
- 4.2. Israel
- 4.3. GCC
- 4.4. North Africa
- 4.5. South Africa
- 4.6. Rest of Middle East & Africa
-
5. Asia Pacific
- 5.1. China
- 5.2. India
- 5.3. Japan
- 5.4. South Korea
- 5.5. ASEAN
- 5.6. Oceania
- 5.7. Rest of Asia Pacific
Beijing Data Center Market REPORT HIGHLIGHTS
| Aspects | Details |
|---|---|
| Study Period | 2019-2033 |
| Base Year | 2024 |
| Estimated Year | 2025 |
| Forecast Period | 2025-2033 |
| Historical Period | 2019-2024 |
| Growth Rate | CAGR of 9.05% from 2019-2033 |
| Segmentation |
|
Table of Contents
- 1. Introduction
- 1.1. Research Scope
- 1.2. Market Segmentation
- 1.3. Research Methodology
- 1.4. Definitions and Assumptions
- 2. Executive Summary
- 2.1. Introduction
- 3. Market Dynamics
- 3.1. Introduction
- 3.2. Market Drivers
- 3.2.1. The country's Investments in Space Technology and Defence; Adoption of Big Data and Imagery Analytics
- 3.3. Market Restrains
- 3.3.1. High Cost of Satellite Imaging Data Acquisition and Processing; High-resolution Images Offered by Other Imaging Technologies
- 3.4. Market Trends
- 3.4.1. Large data centers are anticipated to grow in the region during the forecast period.
- 4. Market Factor Analysis
- 4.1. Porters Five Forces
- 4.2. Supply/Value Chain
- 4.3. PESTEL analysis
- 4.4. Market Entropy
- 4.5. Patent/Trademark Analysis
- 5. Global Beijing Data Center Market Analysis, Insights and Forecast, 2019-2031
- 5.1. Market Analysis, Insights and Forecast - by DC Size
- 5.1.1. Small
- 5.1.2. Medium
- 5.1.3. Large
- 5.1.4. Massive
- 5.1.5. Mega
- 5.2. Market Analysis, Insights and Forecast - by Tier Type
- 5.2.1. Tier 1 & 2
- 5.2.2. Tier 3
- 5.2.3. Tier 4
- 5.3. Market Analysis, Insights and Forecast - by Absorption
- 5.3.1. Utilized
- 5.3.1.1. Colocation Type
- 5.3.1.1.1. Retail
- 5.3.1.1.2. Wholesale
- 5.3.1.1.3. Hyperscale
- 5.3.1.2. End-User
- 5.3.1.2.1. Cloud & IT
- 5.3.1.2.2. Telecom
- 5.3.1.2.3. Media & Entertainment
- 5.3.1.2.4. Government
- 5.3.1.2.5. BFSI
- 5.3.1.2.6. Manufacturing
- 5.3.1.2.7. E-Commerce
- 5.3.1.2.8. Other End-User
- 5.3.1.1. Colocation Type
- 5.3.2. Non-Utilized
- 5.3.1. Utilized
- 5.4. Market Analysis, Insights and Forecast - by Region
- 5.4.1. North America
- 5.4.2. South America
- 5.4.3. Europe
- 5.4.4. Middle East & Africa
- 5.4.5. Asia Pacific
- 5.1. Market Analysis, Insights and Forecast - by DC Size
- 6. North America Beijing Data Center Market Analysis, Insights and Forecast, 2019-2031
- 6.1. Market Analysis, Insights and Forecast - by DC Size
- 6.1.1. Small
- 6.1.2. Medium
- 6.1.3. Large
- 6.1.4. Massive
- 6.1.5. Mega
- 6.2. Market Analysis, Insights and Forecast - by Tier Type
- 6.2.1. Tier 1 & 2
- 6.2.2. Tier 3
- 6.2.3. Tier 4
- 6.3. Market Analysis, Insights and Forecast - by Absorption
- 6.3.1. Utilized
- 6.3.1.1. Colocation Type
- 6.3.1.1.1. Retail
- 6.3.1.1.2. Wholesale
- 6.3.1.1.3. Hyperscale
- 6.3.1.2. End-User
- 6.3.1.2.1. Cloud & IT
- 6.3.1.2.2. Telecom
- 6.3.1.2.3. Media & Entertainment
- 6.3.1.2.4. Government
- 6.3.1.2.5. BFSI
- 6.3.1.2.6. Manufacturing
- 6.3.1.2.7. E-Commerce
- 6.3.1.2.8. Other End-User
- 6.3.1.1. Colocation Type
- 6.3.2. Non-Utilized
- 6.3.1. Utilized
- 6.1. Market Analysis, Insights and Forecast - by DC Size
- 7. South America Beijing Data Center Market Analysis, Insights and Forecast, 2019-2031
- 7.1. Market Analysis, Insights and Forecast - by DC Size
- 7.1.1. Small
- 7.1.2. Medium
- 7.1.3. Large
- 7.1.4. Massive
- 7.1.5. Mega
- 7.2. Market Analysis, Insights and Forecast - by Tier Type
- 7.2.1. Tier 1 & 2
- 7.2.2. Tier 3
- 7.2.3. Tier 4
- 7.3. Market Analysis, Insights and Forecast - by Absorption
- 7.3.1. Utilized
- 7.3.1.1. Colocation Type
- 7.3.1.1.1. Retail
- 7.3.1.1.2. Wholesale
- 7.3.1.1.3. Hyperscale
- 7.3.1.2. End-User
- 7.3.1.2.1. Cloud & IT
- 7.3.1.2.2. Telecom
- 7.3.1.2.3. Media & Entertainment
- 7.3.1.2.4. Government
- 7.3.1.2.5. BFSI
- 7.3.1.2.6. Manufacturing
- 7.3.1.2.7. E-Commerce
- 7.3.1.2.8. Other End-User
- 7.3.1.1. Colocation Type
- 7.3.2. Non-Utilized
- 7.3.1. Utilized
- 7.1. Market Analysis, Insights and Forecast - by DC Size
- 8. Europe Beijing Data Center Market Analysis, Insights and Forecast, 2019-2031
- 8.1. Market Analysis, Insights and Forecast - by DC Size
- 8.1.1. Small
- 8.1.2. Medium
- 8.1.3. Large
- 8.1.4. Massive
- 8.1.5. Mega
- 8.2. Market Analysis, Insights and Forecast - by Tier Type
- 8.2.1. Tier 1 & 2
- 8.2.2. Tier 3
- 8.2.3. Tier 4
- 8.3. Market Analysis, Insights and Forecast - by Absorption
- 8.3.1. Utilized
- 8.3.1.1. Colocation Type
- 8.3.1.1.1. Retail
- 8.3.1.1.2. Wholesale
- 8.3.1.1.3. Hyperscale
- 8.3.1.2. End-User
- 8.3.1.2.1. Cloud & IT
- 8.3.1.2.2. Telecom
- 8.3.1.2.3. Media & Entertainment
- 8.3.1.2.4. Government
- 8.3.1.2.5. BFSI
- 8.3.1.2.6. Manufacturing
- 8.3.1.2.7. E-Commerce
- 8.3.1.2.8. Other End-User
- 8.3.1.1. Colocation Type
- 8.3.2. Non-Utilized
- 8.3.1. Utilized
- 8.1. Market Analysis, Insights and Forecast - by DC Size
- 9. Middle East & Africa Beijing Data Center Market Analysis, Insights and Forecast, 2019-2031
- 9.1. Market Analysis, Insights and Forecast - by DC Size
- 9.1.1. Small
- 9.1.2. Medium
- 9.1.3. Large
- 9.1.4. Massive
- 9.1.5. Mega
- 9.2. Market Analysis, Insights and Forecast - by Tier Type
- 9.2.1. Tier 1 & 2
- 9.2.2. Tier 3
- 9.2.3. Tier 4
- 9.3. Market Analysis, Insights and Forecast - by Absorption
- 9.3.1. Utilized
- 9.3.1.1. Colocation Type
- 9.3.1.1.1. Retail
- 9.3.1.1.2. Wholesale
- 9.3.1.1.3. Hyperscale
- 9.3.1.2. End-User
- 9.3.1.2.1. Cloud & IT
- 9.3.1.2.2. Telecom
- 9.3.1.2.3. Media & Entertainment
- 9.3.1.2.4. Government
- 9.3.1.2.5. BFSI
- 9.3.1.2.6. Manufacturing
- 9.3.1.2.7. E-Commerce
- 9.3.1.2.8. Other End-User
- 9.3.1.1. Colocation Type
- 9.3.2. Non-Utilized
- 9.3.1. Utilized
- 9.1. Market Analysis, Insights and Forecast - by DC Size
- 10. Asia Pacific Beijing Data Center Market Analysis, Insights and Forecast, 2019-2031
- 10.1. Market Analysis, Insights and Forecast - by DC Size
- 10.1.1. Small
- 10.1.2. Medium
- 10.1.3. Large
- 10.1.4. Massive
- 10.1.5. Mega
- 10.2. Market Analysis, Insights and Forecast - by Tier Type
- 10.2.1. Tier 1 & 2
- 10.2.2. Tier 3
- 10.2.3. Tier 4
- 10.3. Market Analysis, Insights and Forecast - by Absorption
- 10.3.1. Utilized
- 10.3.1.1. Colocation Type
- 10.3.1.1.1. Retail
- 10.3.1.1.2. Wholesale
- 10.3.1.1.3. Hyperscale
- 10.3.1.2. End-User
- 10.3.1.2.1. Cloud & IT
- 10.3.1.2.2. Telecom
- 10.3.1.2.3. Media & Entertainment
- 10.3.1.2.4. Government
- 10.3.1.2.5. BFSI
- 10.3.1.2.6. Manufacturing
- 10.3.1.2.7. E-Commerce
- 10.3.1.2.8. Other End-User
- 10.3.1.1. Colocation Type
- 10.3.2. Non-Utilized
- 10.3.1. Utilized
- 10.1. Market Analysis, Insights and Forecast - by DC Size
- 11. North America Beijing Data Center Market Analysis, Insights and Forecast, 2019-2031
- 11.1. Market Analysis, Insights and Forecast - By Country/Sub-region
- 11.1.1.
- 12. Europe Beijing Data Center Market Analysis, Insights and Forecast, 2019-2031
- 12.1. Market Analysis, Insights and Forecast - By Country/Sub-region
- 12.1.1.
- 13. Asia Pacific Beijing Data Center Market Analysis, Insights and Forecast, 2019-2031
- 13.1. Market Analysis, Insights and Forecast - By Country/Sub-region
- 13.1.1.
- 14. Rest of the World Beijing Data Center Market Analysis, Insights and Forecast, 2019-2031
- 14.1. Market Analysis, Insights and Forecast - By Country/Sub-region
- 14.1.1.
- 15. Competitive Analysis
- 15.1. Global Market Share Analysis 2024
- 15.2. Company Profiles
- 15.2.1 GDS
- 15.2.1.1. Overview
- 15.2.1.2. Products
- 15.2.1.3. SWOT Analysis
- 15.2.1.4. Recent Developments
- 15.2.1.5. Financials (Based on Availability)
- 15.2.2 KDDI Telehouse
- 15.2.2.1. Overview
- 15.2.2.2. Products
- 15.2.2.3. SWOT Analysis
- 15.2.2.4. Recent Developments
- 15.2.2.5. Financials (Based on Availability)
- 15.2.3 Princeton Digital Group
- 15.2.3.1. Overview
- 15.2.3.2. Products
- 15.2.3.3. SWOT Analysis
- 15.2.3.4. Recent Developments
- 15.2.3.5. Financials (Based on Availability)
- 15.2.4 China Telecom Corporation Ltd
- 15.2.4.1. Overview
- 15.2.4.2. Products
- 15.2.4.3. SWOT Analysis
- 15.2.4.4. Recent Developments
- 15.2.4.5. Financials (Based on Availability)
- 15.2.5 Chindata Group Holdings Ltd
- 15.2.5.1. Overview
- 15.2.5.2. Products
- 15.2.5.3. SWOT Analysis
- 15.2.5.4. Recent Developments
- 15.2.5.5. Financials (Based on Availability)
- 15.2.1 GDS
List of Figures
- Figure 1: Global Beijing Data Center Market Revenue Breakdown (Million, %) by Region 2024 & 2032
- Figure 2: North America Beijing Data Center Market Revenue (Million), by Country 2024 & 2032
- Figure 3: North America Beijing Data Center Market Revenue Share (%), by Country 2024 & 2032
- Figure 4: Europe Beijing Data Center Market Revenue (Million), by Country 2024 & 2032
- Figure 5: Europe Beijing Data Center Market Revenue Share (%), by Country 2024 & 2032
- Figure 6: Asia Pacific Beijing Data Center Market Revenue (Million), by Country 2024 & 2032
- Figure 7: Asia Pacific Beijing Data Center Market Revenue Share (%), by Country 2024 & 2032
- Figure 8: Rest of the World Beijing Data Center Market Revenue (Million), by Country 2024 & 2032
- Figure 9: Rest of the World Beijing Data Center Market Revenue Share (%), by Country 2024 & 2032
- Figure 10: North America Beijing Data Center Market Revenue (Million), by DC Size 2024 & 2032
- Figure 11: North America Beijing Data Center Market Revenue Share (%), by DC Size 2024 & 2032
- Figure 12: North America Beijing Data Center Market Revenue (Million), by Tier Type 2024 & 2032
- Figure 13: North America Beijing Data Center Market Revenue Share (%), by Tier Type 2024 & 2032
- Figure 14: North America Beijing Data Center Market Revenue (Million), by Absorption 2024 & 2032
- Figure 15: North America Beijing Data Center Market Revenue Share (%), by Absorption 2024 & 2032
- Figure 16: North America Beijing Data Center Market Revenue (Million), by Country 2024 & 2032
- Figure 17: North America Beijing Data Center Market Revenue Share (%), by Country 2024 & 2032
- Figure 18: South America Beijing Data Center Market Revenue (Million), by DC Size 2024 & 2032
- Figure 19: South America Beijing Data Center Market Revenue Share (%), by DC Size 2024 & 2032
- Figure 20: South America Beijing Data Center Market Revenue (Million), by Tier Type 2024 & 2032
- Figure 21: South America Beijing Data Center Market Revenue Share (%), by Tier Type 2024 & 2032
- Figure 22: South America Beijing Data Center Market Revenue (Million), by Absorption 2024 & 2032
- Figure 23: South America Beijing Data Center Market Revenue Share (%), by Absorption 2024 & 2032
- Figure 24: South America Beijing Data Center Market Revenue (Million), by Country 2024 & 2032
- Figure 25: South America Beijing Data Center Market Revenue Share (%), by Country 2024 & 2032
- Figure 26: Europe Beijing Data Center Market Revenue (Million), by DC Size 2024 & 2032
- Figure 27: Europe Beijing Data Center Market Revenue Share (%), by DC Size 2024 & 2032
- Figure 28: Europe Beijing Data Center Market Revenue (Million), by Tier Type 2024 & 2032
- Figure 29: Europe Beijing Data Center Market Revenue Share (%), by Tier Type 2024 & 2032
- Figure 30: Europe Beijing Data Center Market Revenue (Million), by Absorption 2024 & 2032
- Figure 31: Europe Beijing Data Center Market Revenue Share (%), by Absorption 2024 & 2032
- Figure 32: Europe Beijing Data Center Market Revenue (Million), by Country 2024 & 2032
- Figure 33: Europe Beijing Data Center Market Revenue Share (%), by Country 2024 & 2032
- Figure 34: Middle East & Africa Beijing Data Center Market Revenue (Million), by DC Size 2024 & 2032
- Figure 35: Middle East & Africa Beijing Data Center Market Revenue Share (%), by DC Size 2024 & 2032
- Figure 36: Middle East & Africa Beijing Data Center Market Revenue (Million), by Tier Type 2024 & 2032
- Figure 37: Middle East & Africa Beijing Data Center Market Revenue Share (%), by Tier Type 2024 & 2032
- Figure 38: Middle East & Africa Beijing Data Center Market Revenue (Million), by Absorption 2024 & 2032
- Figure 39: Middle East & Africa Beijing Data Center Market Revenue Share (%), by Absorption 2024 & 2032
- Figure 40: Middle East & Africa Beijing Data Center Market Revenue (Million), by Country 2024 & 2032
- Figure 41: Middle East & Africa Beijing Data Center Market Revenue Share (%), by Country 2024 & 2032
- Figure 42: Asia Pacific Beijing Data Center Market Revenue (Million), by DC Size 2024 & 2032
- Figure 43: Asia Pacific Beijing Data Center Market Revenue Share (%), by DC Size 2024 & 2032
- Figure 44: Asia Pacific Beijing Data Center Market Revenue (Million), by Tier Type 2024 & 2032
- Figure 45: Asia Pacific Beijing Data Center Market Revenue Share (%), by Tier Type 2024 & 2032
- Figure 46: Asia Pacific Beijing Data Center Market Revenue (Million), by Absorption 2024 & 2032
- Figure 47: Asia Pacific Beijing Data Center Market Revenue Share (%), by Absorption 2024 & 2032
- Figure 48: Asia Pacific Beijing Data Center Market Revenue (Million), by Country 2024 & 2032
- Figure 49: Asia Pacific Beijing Data Center Market Revenue Share (%), by Country 2024 & 2032
List of Tables
- Table 1: Global Beijing Data Center Market Revenue Million Forecast, by Region 2019 & 2032
- Table 2: Global Beijing Data Center Market Revenue Million Forecast, by DC Size 2019 & 2032
- Table 3: Global Beijing Data Center Market Revenue Million Forecast, by Tier Type 2019 & 2032
- Table 4: Global Beijing Data Center Market Revenue Million Forecast, by Absorption 2019 & 2032
- Table 5: Global Beijing Data Center Market Revenue Million Forecast, by Region 2019 & 2032
- Table 6: Global Beijing Data Center Market Revenue Million Forecast, by Country 2019 & 2032
- Table 7: Beijing Data Center Market Revenue (Million) Forecast, by Application 2019 & 2032
- Table 8: Global Beijing Data Center Market Revenue Million Forecast, by Country 2019 & 2032
- Table 9: Beijing Data Center Market Revenue (Million) Forecast, by Application 2019 & 2032
- Table 10: Global Beijing Data Center Market Revenue Million Forecast, by Country 2019 & 2032
- Table 11: Beijing Data Center Market Revenue (Million) Forecast, by Application 2019 & 2032
- Table 12: Global Beijing Data Center Market Revenue Million Forecast, by Country 2019 & 2032
- Table 13: Beijing Data Center Market Revenue (Million) Forecast, by Application 2019 & 2032
- Table 14: Global Beijing Data Center Market Revenue Million Forecast, by DC Size 2019 & 2032
- Table 15: Global Beijing Data Center Market Revenue Million Forecast, by Tier Type 2019 & 2032
- Table 16: Global Beijing Data Center Market Revenue Million Forecast, by Absorption 2019 & 2032
- Table 17: Global Beijing Data Center Market Revenue Million Forecast, by Country 2019 & 2032
- Table 18: United States Beijing Data Center Market Revenue (Million) Forecast, by Application 2019 & 2032
- Table 19: Canada Beijing Data Center Market Revenue (Million) Forecast, by Application 2019 & 2032
- Table 20: Mexico Beijing Data Center Market Revenue (Million) Forecast, by Application 2019 & 2032
- Table 21: Global Beijing Data Center Market Revenue Million Forecast, by DC Size 2019 & 2032
- Table 22: Global Beijing Data Center Market Revenue Million Forecast, by Tier Type 2019 & 2032
- Table 23: Global Beijing Data Center Market Revenue Million Forecast, by Absorption 2019 & 2032
- Table 24: Global Beijing Data Center Market Revenue Million Forecast, by Country 2019 & 2032
- Table 25: Brazil Beijing Data Center Market Revenue (Million) Forecast, by Application 2019 & 2032
- Table 26: Argentina Beijing Data Center Market Revenue (Million) Forecast, by Application 2019 & 2032
- Table 27: Rest of South America Beijing Data Center Market Revenue (Million) Forecast, by Application 2019 & 2032
- Table 28: Global Beijing Data Center Market Revenue Million Forecast, by DC Size 2019 & 2032
- Table 29: Global Beijing Data Center Market Revenue Million Forecast, by Tier Type 2019 & 2032
- Table 30: Global Beijing Data Center Market Revenue Million Forecast, by Absorption 2019 & 2032
- Table 31: Global Beijing Data Center Market Revenue Million Forecast, by Country 2019 & 2032
- Table 32: United Kingdom Beijing Data Center Market Revenue (Million) Forecast, by Application 2019 & 2032
- Table 33: Germany Beijing Data Center Market Revenue (Million) Forecast, by Application 2019 & 2032
- Table 34: France Beijing Data Center Market Revenue (Million) Forecast, by Application 2019 & 2032
- Table 35: Italy Beijing Data Center Market Revenue (Million) Forecast, by Application 2019 & 2032
- Table 36: Spain Beijing Data Center Market Revenue (Million) Forecast, by Application 2019 & 2032
- Table 37: Russia Beijing Data Center Market Revenue (Million) Forecast, by Application 2019 & 2032
- Table 38: Benelux Beijing Data Center Market Revenue (Million) Forecast, by Application 2019 & 2032
- Table 39: Nordics Beijing Data Center Market Revenue (Million) Forecast, by Application 2019 & 2032
- Table 40: Rest of Europe Beijing Data Center Market Revenue (Million) Forecast, by Application 2019 & 2032
- Table 41: Global Beijing Data Center Market Revenue Million Forecast, by DC Size 2019 & 2032
- Table 42: Global Beijing Data Center Market Revenue Million Forecast, by Tier Type 2019 & 2032
- Table 43: Global Beijing Data Center Market Revenue Million Forecast, by Absorption 2019 & 2032
- Table 44: Global Beijing Data Center Market Revenue Million Forecast, by Country 2019 & 2032
- Table 45: Turkey Beijing Data Center Market Revenue (Million) Forecast, by Application 2019 & 2032
- Table 46: Israel Beijing Data Center Market Revenue (Million) Forecast, by Application 2019 & 2032
- Table 47: GCC Beijing Data Center Market Revenue (Million) Forecast, by Application 2019 & 2032
- Table 48: North Africa Beijing Data Center Market Revenue (Million) Forecast, by Application 2019 & 2032
- Table 49: South Africa Beijing Data Center Market Revenue (Million) Forecast, by Application 2019 & 2032
- Table 50: Rest of Middle East & Africa Beijing Data Center Market Revenue (Million) Forecast, by Application 2019 & 2032
- Table 51: Global Beijing Data Center Market Revenue Million Forecast, by DC Size 2019 & 2032
- Table 52: Global Beijing Data Center Market Revenue Million Forecast, by Tier Type 2019 & 2032
- Table 53: Global Beijing Data Center Market Revenue Million Forecast, by Absorption 2019 & 2032
- Table 54: Global Beijing Data Center Market Revenue Million Forecast, by Country 2019 & 2032
- Table 55: China Beijing Data Center Market Revenue (Million) Forecast, by Application 2019 & 2032
- Table 56: India Beijing Data Center Market Revenue (Million) Forecast, by Application 2019 & 2032
- Table 57: Japan Beijing Data Center Market Revenue (Million) Forecast, by Application 2019 & 2032
- Table 58: South Korea Beijing Data Center Market Revenue (Million) Forecast, by Application 2019 & 2032
- Table 59: ASEAN Beijing Data Center Market Revenue (Million) Forecast, by Application 2019 & 2032
- Table 60: Oceania Beijing Data Center Market Revenue (Million) Forecast, by Application 2019 & 2032
- Table 61: Rest of Asia Pacific Beijing Data Center Market Revenue (Million) Forecast, by Application 2019 & 2032
Frequently Asked Questions
1. What is the projected Compound Annual Growth Rate (CAGR) of the Beijing Data Center Market?
The projected CAGR is approximately 9.05%.
2. Which companies are prominent players in the Beijing Data Center Market?
Key companies in the market include GDS, KDDI Telehouse, Princeton Digital Group, China Telecom Corporation Ltd, Chindata Group Holdings Ltd.
3. What are the main segments of the Beijing Data Center Market?
The market segments include DC Size, Tier Type, Absorption.
4. Can you provide details about the market size?
The market size is estimated to be USD XX Million as of 2022.
5. What are some drivers contributing to market growth?
The country's Investments in Space Technology and Defence; Adoption of Big Data and Imagery Analytics.
6. What are the notable trends driving market growth?
Large data centers are anticipated to grow in the region during the forecast period..
7. Are there any restraints impacting market growth?
High Cost of Satellite Imaging Data Acquisition and Processing; High-resolution Images Offered by Other Imaging Technologies.
8. Can you provide examples of recent developments in the market?
February 2023: CapitaLand Investment Limited (CLI) announced the establishment of a Chinese data center development fund called CapitaLand China Data Centre Partners (CDCP). The fund is anticipated to aid the growth of data centers in Beijing and other regions.
9. What pricing options are available for accessing the report?
Pricing options include single-user, multi-user, and enterprise licenses priced at USD 3800, USD 4500, and USD 5800 respectively.
10. Is the market size provided in terms of value or volume?
The market size is provided in terms of value, measured in Million.
11. Are there any specific market keywords associated with the report?
Yes, the market keyword associated with the report is "Beijing Data Center Market," which aids in identifying and referencing the specific market segment covered.
12. How do I determine which pricing option suits my needs best?
The pricing options vary based on user requirements and access needs. Individual users may opt for single-user licenses, while businesses requiring broader access may choose multi-user or enterprise licenses for cost-effective access to the report.
13. Are there any additional resources or data provided in the Beijing Data Center Market report?
While the report offers comprehensive insights, it's advisable to review the specific contents or supplementary materials provided to ascertain if additional resources or data are available.
14. How can I stay updated on further developments or reports in the Beijing Data Center Market?
To stay informed about further developments, trends, and reports in the Beijing Data Center Market, consider subscribing to industry newsletters, following relevant companies and organizations, or regularly checking reputable industry news sources and publications.
Methodology
Step 1 - Identification of Relevant Samples Size from Population Database


Step 2 - Approaches for Defining Global Market Size (Value, Volume* & Price*)

Note*: In applicable scenarios
Step 3 - Data Sources
Primary Research
- Web Analytics
- Survey Reports
- Research Institute
- Latest Research Reports
- Opinion Leaders
Secondary Research
- Annual Reports
- White Paper
- Latest Press Release
- Industry Association
- Paid Database
- Investor Presentations

Step 4 - Data Triangulation
Involves using different sources of information in order to increase the validity of a study
These sources are likely to be stakeholders in a program - participants, other researchers, program staff, other community members, and so on.
Then we put all data in single framework & apply various statistical tools to find out the dynamic on the market.
During the analysis stage, feedback from the stakeholder groups would be compared to determine areas of agreement as well as areas of divergence
