

Key Insights
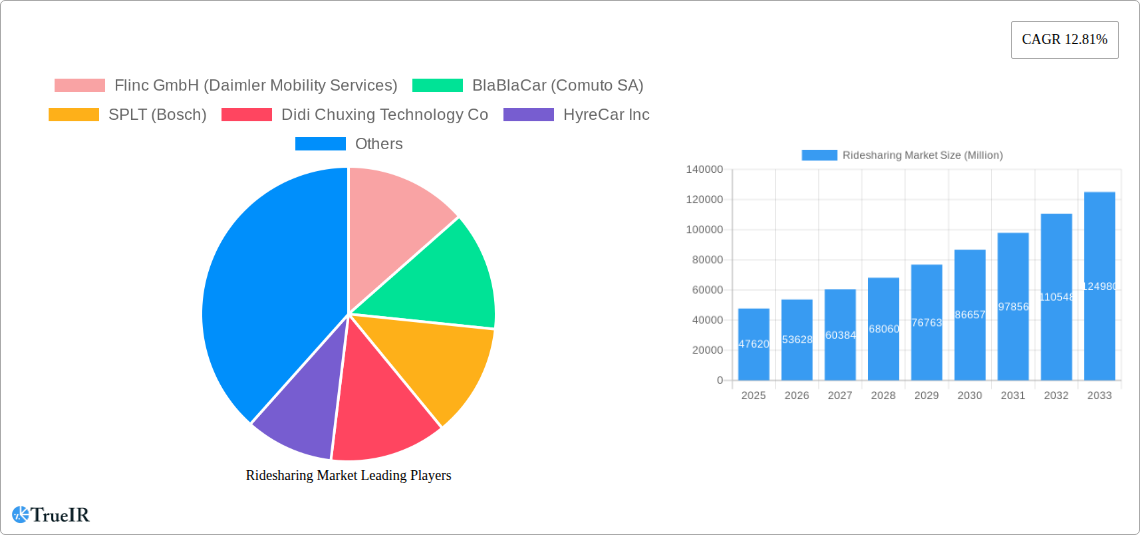
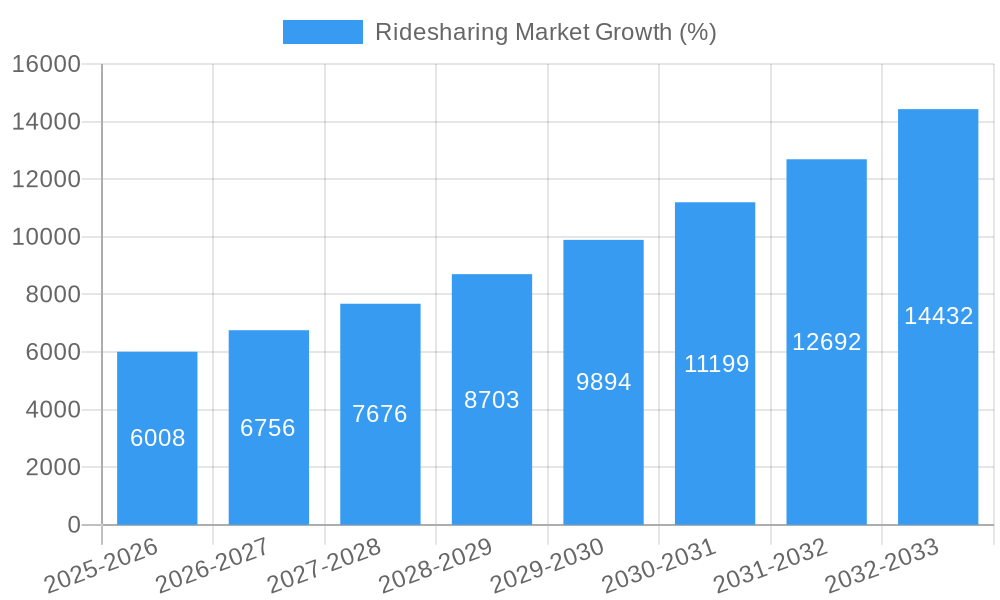
The ridesharing market, valued at $47.62 billion in 2025, is projected to experience robust growth, exhibiting a compound annual growth rate (CAGR) of 12.81% from 2025 to 2033. This expansion is driven by several key factors. Increasing urbanization and traffic congestion in major metropolitan areas are compelling individuals and businesses to seek efficient and cost-effective transportation alternatives. The rising adoption of smartphones and the proliferation of user-friendly ridesharing applications further fuel market growth. Furthermore, environmental concerns and a growing preference for sustainable transportation options are contributing to the increasing popularity of ridesharing services. The market segmentation reveals significant opportunities across various membership types (fixed, dynamic, and corporate ridesharing) and service delivery methods (web-based, app-based, and combined). The competitive landscape is characterized by a mix of established players like Didi Chuxing and emerging companies vying for market share, leading to continuous innovation and improved service offerings. The growth is expected to be particularly strong in regions like Asia-Pacific and North America, driven by high population density, tech adoption rates, and increasing disposable incomes.
However, challenges remain. Regulatory hurdles and varying legal frameworks across different regions pose a significant obstacle to market penetration. Concerns surrounding driver safety and security, as well as pricing fluctuations and competition from public transportation, could potentially constrain growth. Despite these challenges, the long-term outlook for the ridesharing market remains positive, fueled by ongoing technological advancements, evolving consumer preferences, and the continued need for efficient and convenient urban transportation solutions. The market is poised to witness increased consolidation and strategic partnerships as companies strive to enhance their market position and expand their service offerings. The integration of advanced technologies, such as autonomous driving and artificial intelligence, is likely to further reshape the industry landscape in the coming years, creating new opportunities and altering existing dynamics.
Ridesharing Market Report: 2019-2033 Forecast
This comprehensive report provides an in-depth analysis of the global ridesharing market, covering the period from 2019 to 2033. With a focus on market size, segmentation, competitive landscape, and future trends, this report is an invaluable resource for investors, industry professionals, and anyone seeking to understand this dynamic sector. The report leverages extensive data analysis and expert insights to deliver actionable intelligence, enabling informed decision-making in this rapidly evolving market. The estimated market value in 2025 is projected to reach xx Million, with a Compound Annual Growth Rate (CAGR) of xx% from 2025 to 2033.
Ridesharing Market Market Structure & Competitive Landscape
The global ridesharing market is characterized by a blend of established players and emerging disruptors. Market concentration is moderate, with a few dominant players holding significant market share, but numerous smaller companies also contributing. The Herfindahl-Hirschman Index (HHI) in 2024 is estimated at xx, indicating a moderately concentrated market. Innovation is a key driver, with companies continuously developing new technologies and services to enhance user experience and efficiency. Regulatory landscapes vary across geographies, significantly impacting market dynamics. Stringent regulations can create barriers to entry, while supportive policies can foster growth. The emergence of alternative transportation options, such as public transit and bike-sharing, poses a competitive threat.
- Market Concentration: Moderate (HHI in 2024: xx)
- Innovation Drivers: Autonomous vehicles, electric vehicles, integrated mobility platforms.
- Regulatory Impacts: Vary significantly by region, impacting market access and operational costs.
- Product Substitutes: Public transit, ride-pooling services, bike-sharing, scooter-sharing.
- End-User Segmentation: Individuals, businesses (corporate ridesharing), tourists.
- M&A Trends: The market has witnessed xx Million worth of mergers and acquisitions in the past five years, signaling ongoing consolidation.
Ridesharing Market Market Trends & Opportunities
The ridesharing market is experiencing substantial growth, driven by several factors. The increasing adoption of smartphones and mobile applications has fueled the widespread use of app-based ridesharing services. Changing consumer preferences, particularly among younger demographics, favor convenient and on-demand transportation solutions. Technological advancements, such as the development of autonomous vehicles and ride-pooling technologies, are reshaping the market landscape. However, competitive pressures, fluctuating fuel prices, and regulatory changes pose significant challenges. The market size is expected to reach xx Million in 2025, with a projected CAGR of xx% from 2025 to 2033. Market penetration rates vary across regions, with mature markets exhibiting higher saturation levels. The integration of ridesharing services with other mobility solutions, such as public transport and bike-sharing, presents significant opportunities for growth.
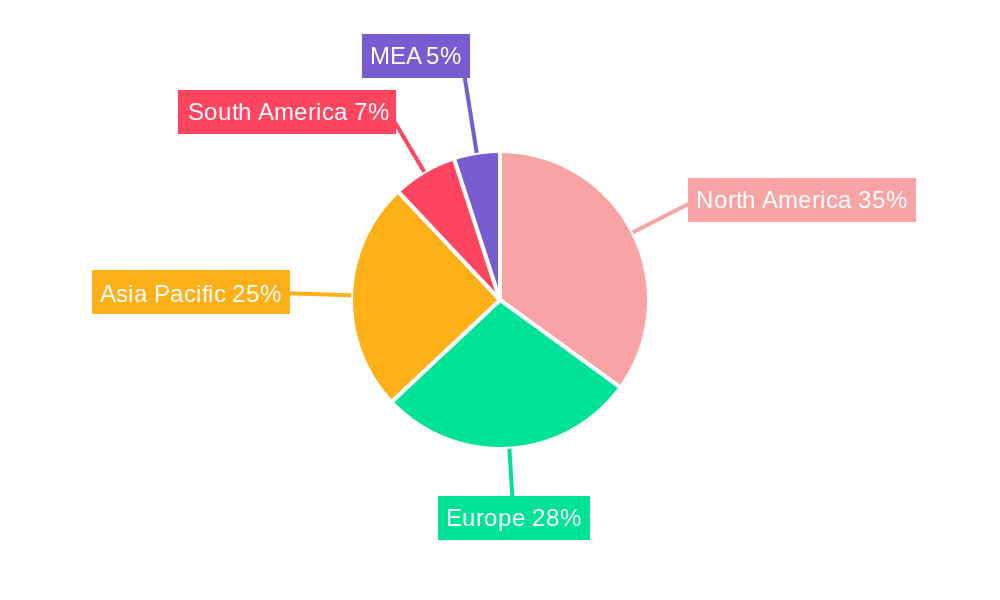
Dominant Markets & Segments in Ridesharing Market
North America currently holds the largest market share in the ridesharing sector. This is driven by factors including high smartphone penetration, robust infrastructure, and a culture of convenience. However, the Asia-Pacific region is experiencing rapid growth and is expected to become a major market in the coming years.
By Membership Type:
- Dynamic Ridesharing: This segment is experiencing the fastest growth, driven by its flexibility and affordability.
- Fixed Ridesharing: This segment offers stability and reliability for commuters.
- Corporate Ridesharing: This segment is growing due to cost efficiency and employee benefits.
By Service Type:
- App-Based: This segment dominates the market, offering ease of access and convenience.
- Web-Based: This segment complements app-based services, catering to specific user needs.
Key Growth Drivers:
- Technological advancements: Development of ride-pooling and autonomous driving technologies.
- Favorable government regulations: Policies supporting ridesharing and integrated mobility solutions.
- Increasing smartphone penetration: Wider adoption of smartphones enhances app-based service accessibility.
Ridesharing Market Product Analysis
The ridesharing market is characterized by a range of offerings, including basic ride-hailing services, ride-pooling options, and specialized services for corporate clients. Technological advancements such as real-time tracking, fare optimization algorithms, and integrated payment systems enhance user experience and operational efficiency. Companies are increasingly integrating various transportation options into a single platform, offering a multi-modal approach to mobility. The focus on safety features, improved user interfaces, and efficient routing algorithms contribute to competitive advantages.
Key Drivers, Barriers & Challenges in Ridesharing Market
Key Drivers:
- Technological advancements: Autonomous vehicles, AI-powered route optimization, and enhanced safety features are driving market growth.
- Economic factors: The rising disposable incomes of consumers fuel the demand for convenient transportation alternatives.
- Policy support: Government initiatives to promote sustainable transportation contribute to market expansion.
Challenges and Restraints:
- Regulatory hurdles: Varying regulations across different regions create operational complexities and increase costs.
- Supply chain disruptions: Fluctuations in fuel prices and driver availability impact operational efficiency.
- Intense competition: The presence of many established players and new entrants leads to price wars and competitive pressure.
Growth Drivers in the Ridesharing Market Market
Technological innovation, particularly in areas such as autonomous vehicles and electric vehicle integration, is a key growth driver. Changing consumer preferences towards on-demand services and a growing demand for convenient and efficient transportation solutions also contribute significantly. Furthermore, supportive government regulations and policies incentivizing sustainable transportation modes are pushing market expansion.
Challenges Impacting Ridesharing Market Growth
Regulatory uncertainty and varying compliance requirements across different jurisdictions present a substantial hurdle. Fluctuations in fuel prices and driver shortages are impacting profitability and operational efficiency. Intense competition, especially from established players and the emergence of new entrants, puts pressure on pricing and margins.
Key Players Shaping the Ridesharing Market Market
- Flinc GmbH (Daimler Mobility Services)
- BlaBlaCar (Comuto SA)
- SPLT (Bosch)
- Didi Chuxing Technology Co
- HyreCar Inc
- KINTO Join Limited
- Wunder Mobility Solutions GmbH
- Kangaride Canada Co
- GoMore
- Klaxit SAS (formerly Wayzup)
- Scoop Technologies Inc
- Vride Inc (Acquired by Enterprise Holdings Inc)
- CarpoolWorld (Datasphere Corporation)
- Via Transportation Inc
- Zimride Inc
Significant Ridesharing Market Industry Milestones
- June 2022: Uber launches UberX Share, offering riders a 20% discount for sharing rides.
- February 2022: Avolon and AirAsia partner to create a ridesharing platform in Southeast Asia using eVTOL aircraft by 2025.
Future Outlook for Ridesharing Market Market
The ridesharing market is poised for continued growth, fueled by technological advancements, evolving consumer preferences, and supportive government policies. Opportunities exist in expanding into underserved markets, integrating with other mobility services, and developing innovative solutions for sustainable transportation. The market's future hinges on overcoming regulatory complexities and addressing operational challenges to ensure sustainable growth and profitability.
Ridesharing Market Segmentation
-
1. Membership Type
- 1.1. Fixed Ridesharing
- 1.2. Dynamic Ridesharing
- 1.3. Corporate Ridesharing
-
2. Service Type
- 2.1. Web-Based
- 2.2. App-Based
- 2.3. Web and App Based
Ridesharing Market Segmentation By Geography
- 1. North America
- 2. Europe
- 3. Asia
- 4. Australia and New Zealand
- 5. Latin America
- 6. Middle East and Africa
Ridesharing Market REPORT HIGHLIGHTS
| Aspects | Details |
|---|---|
| Study Period | 2019-2033 |
| Base Year | 2024 |
| Estimated Year | 2025 |
| Forecast Period | 2025-2033 |
| Historical Period | 2019-2024 |
| Growth Rate | CAGR of 12.81% from 2019-2033 |
| Segmentation |
|
Table of Contents
- 1. Introduction
- 1.1. Research Scope
- 1.2. Market Segmentation
- 1.3. Research Methodology
- 1.4. Definitions and Assumptions
- 2. Executive Summary
- 2.1. Introduction
- 3. Market Dynamics
- 3.1. Introduction
- 3.2. Market Drivers
- 3.2.1 Cost Advantage and Increasing Availability of Carpooling/Corporate Pooling Services; Incentives and Rebates Provided by Governments in Major Markets
- 3.2.2 such as France; Increasing Cost of Vehicle Ownership and Environmental Benefits
- 3.3. Market Restrains
- 3.3.1. Technical Challenges Pertaining to CMP Technique
- 3.4. Market Trends
- 3.4.1. COVID-19 Has Posed Significant Threat to the Market
- 4. Market Factor Analysis
- 4.1. Porters Five Forces
- 4.2. Supply/Value Chain
- 4.3. PESTEL analysis
- 4.4. Market Entropy
- 4.5. Patent/Trademark Analysis
- 5. Global Ridesharing Market Analysis, Insights and Forecast, 2019-2031
- 5.1. Market Analysis, Insights and Forecast - by Membership Type
- 5.1.1. Fixed Ridesharing
- 5.1.2. Dynamic Ridesharing
- 5.1.3. Corporate Ridesharing
- 5.2. Market Analysis, Insights and Forecast - by Service Type
- 5.2.1. Web-Based
- 5.2.2. App-Based
- 5.2.3. Web and App Based
- 5.3. Market Analysis, Insights and Forecast - by Region
- 5.3.1. North America
- 5.3.2. Europe
- 5.3.3. Asia
- 5.3.4. Australia and New Zealand
- 5.3.5. Latin America
- 5.3.6. Middle East and Africa
- 5.1. Market Analysis, Insights and Forecast - by Membership Type
- 6. North America Ridesharing Market Analysis, Insights and Forecast, 2019-2031
- 6.1. Market Analysis, Insights and Forecast - by Membership Type
- 6.1.1. Fixed Ridesharing
- 6.1.2. Dynamic Ridesharing
- 6.1.3. Corporate Ridesharing
- 6.2. Market Analysis, Insights and Forecast - by Service Type
- 6.2.1. Web-Based
- 6.2.2. App-Based
- 6.2.3. Web and App Based
- 6.1. Market Analysis, Insights and Forecast - by Membership Type
- 7. Europe Ridesharing Market Analysis, Insights and Forecast, 2019-2031
- 7.1. Market Analysis, Insights and Forecast - by Membership Type
- 7.1.1. Fixed Ridesharing
- 7.1.2. Dynamic Ridesharing
- 7.1.3. Corporate Ridesharing
- 7.2. Market Analysis, Insights and Forecast - by Service Type
- 7.2.1. Web-Based
- 7.2.2. App-Based
- 7.2.3. Web and App Based
- 7.1. Market Analysis, Insights and Forecast - by Membership Type
- 8. Asia Ridesharing Market Analysis, Insights and Forecast, 2019-2031
- 8.1. Market Analysis, Insights and Forecast - by Membership Type
- 8.1.1. Fixed Ridesharing
- 8.1.2. Dynamic Ridesharing
- 8.1.3. Corporate Ridesharing
- 8.2. Market Analysis, Insights and Forecast - by Service Type
- 8.2.1. Web-Based
- 8.2.2. App-Based
- 8.2.3. Web and App Based
- 8.1. Market Analysis, Insights and Forecast - by Membership Type
- 9. Australia and New Zealand Ridesharing Market Analysis, Insights and Forecast, 2019-2031
- 9.1. Market Analysis, Insights and Forecast - by Membership Type
- 9.1.1. Fixed Ridesharing
- 9.1.2. Dynamic Ridesharing
- 9.1.3. Corporate Ridesharing
- 9.2. Market Analysis, Insights and Forecast - by Service Type
- 9.2.1. Web-Based
- 9.2.2. App-Based
- 9.2.3. Web and App Based
- 9.1. Market Analysis, Insights and Forecast - by Membership Type
- 10. Latin America Ridesharing Market Analysis, Insights and Forecast, 2019-2031
- 10.1. Market Analysis, Insights and Forecast - by Membership Type
- 10.1.1. Fixed Ridesharing
- 10.1.2. Dynamic Ridesharing
- 10.1.3. Corporate Ridesharing
- 10.2. Market Analysis, Insights and Forecast - by Service Type
- 10.2.1. Web-Based
- 10.2.2. App-Based
- 10.2.3. Web and App Based
- 10.1. Market Analysis, Insights and Forecast - by Membership Type
- 11. Middle East and Africa Ridesharing Market Analysis, Insights and Forecast, 2019-2031
- 11.1. Market Analysis, Insights and Forecast - by Membership Type
- 11.1.1. Fixed Ridesharing
- 11.1.2. Dynamic Ridesharing
- 11.1.3. Corporate Ridesharing
- 11.2. Market Analysis, Insights and Forecast - by Service Type
- 11.2.1. Web-Based
- 11.2.2. App-Based
- 11.2.3. Web and App Based
- 11.1. Market Analysis, Insights and Forecast - by Membership Type
- 12. North America Ridesharing Market Analysis, Insights and Forecast, 2019-2031
- 12.1. Market Analysis, Insights and Forecast - By Country/Sub-region
- 12.1.1 United States
- 12.1.2 Canada
- 12.1.3 Mexico
- 13. Europe Ridesharing Market Analysis, Insights and Forecast, 2019-2031
- 13.1. Market Analysis, Insights and Forecast - By Country/Sub-region
- 13.1.1 Germany
- 13.1.2 United Kingdom
- 13.1.3 France
- 13.1.4 Spain
- 13.1.5 Italy
- 13.1.6 Spain
- 13.1.7 Belgium
- 13.1.8 Netherland
- 13.1.9 Nordics
- 13.1.10 Rest of Europe
- 14. Asia Pacific Ridesharing Market Analysis, Insights and Forecast, 2019-2031
- 14.1. Market Analysis, Insights and Forecast - By Country/Sub-region
- 14.1.1 China
- 14.1.2 Japan
- 14.1.3 India
- 14.1.4 South Korea
- 14.1.5 Southeast Asia
- 14.1.6 Australia
- 14.1.7 Indonesia
- 14.1.8 Phillipes
- 14.1.9 Singapore
- 14.1.10 Thailandc
- 14.1.11 Rest of Asia Pacific
- 15. South America Ridesharing Market Analysis, Insights and Forecast, 2019-2031
- 15.1. Market Analysis, Insights and Forecast - By Country/Sub-region
- 15.1.1 Brazil
- 15.1.2 Argentina
- 15.1.3 Peru
- 15.1.4 Chile
- 15.1.5 Colombia
- 15.1.6 Ecuador
- 15.1.7 Venezuela
- 15.1.8 Rest of South America
- 16. North America Ridesharing Market Analysis, Insights and Forecast, 2019-2031
- 16.1. Market Analysis, Insights and Forecast - By Country/Sub-region
- 16.1.1 United States
- 16.1.2 Canada
- 16.1.3 Mexico
- 17. MEA Ridesharing Market Analysis, Insights and Forecast, 2019-2031
- 17.1. Market Analysis, Insights and Forecast - By Country/Sub-region
- 17.1.1 United Arab Emirates
- 17.1.2 Saudi Arabia
- 17.1.3 South Africa
- 17.1.4 Rest of Middle East and Africa
- 18. Competitive Analysis
- 18.1. Global Market Share Analysis 2024
- 18.2. Company Profiles
- 18.2.1 Flinc GmbH (Daimler Mobility Services)
- 18.2.1.1. Overview
- 18.2.1.2. Products
- 18.2.1.3. SWOT Analysis
- 18.2.1.4. Recent Developments
- 18.2.1.5. Financials (Based on Availability)
- 18.2.2 BlaBlaCar (Comuto SA)
- 18.2.2.1. Overview
- 18.2.2.2. Products
- 18.2.2.3. SWOT Analysis
- 18.2.2.4. Recent Developments
- 18.2.2.5. Financials (Based on Availability)
- 18.2.3 SPLT (Bosch)
- 18.2.3.1. Overview
- 18.2.3.2. Products
- 18.2.3.3. SWOT Analysis
- 18.2.3.4. Recent Developments
- 18.2.3.5. Financials (Based on Availability)
- 18.2.4 Didi Chuxing Technology Co
- 18.2.4.1. Overview
- 18.2.4.2. Products
- 18.2.4.3. SWOT Analysis
- 18.2.4.4. Recent Developments
- 18.2.4.5. Financials (Based on Availability)
- 18.2.5 HyreCar Inc
- 18.2.5.1. Overview
- 18.2.5.2. Products
- 18.2.5.3. SWOT Analysis
- 18.2.5.4. Recent Developments
- 18.2.5.5. Financials (Based on Availability)
- 18.2.6 KINTO Join Limited
- 18.2.6.1. Overview
- 18.2.6.2. Products
- 18.2.6.3. SWOT Analysis
- 18.2.6.4. Recent Developments
- 18.2.6.5. Financials (Based on Availability)
- 18.2.7 Wunder Mobility Solutions GmbH
- 18.2.7.1. Overview
- 18.2.7.2. Products
- 18.2.7.3. SWOT Analysis
- 18.2.7.4. Recent Developments
- 18.2.7.5. Financials (Based on Availability)
- 18.2.8 Kangaride Canada Co
- 18.2.8.1. Overview
- 18.2.8.2. Products
- 18.2.8.3. SWOT Analysis
- 18.2.8.4. Recent Developments
- 18.2.8.5. Financials (Based on Availability)
- 18.2.9 GoMore
- 18.2.9.1. Overview
- 18.2.9.2. Products
- 18.2.9.3. SWOT Analysis
- 18.2.9.4. Recent Developments
- 18.2.9.5. Financials (Based on Availability)
- 18.2.10 Klaxit SAS (formerly Wayzup)
- 18.2.10.1. Overview
- 18.2.10.2. Products
- 18.2.10.3. SWOT Analysis
- 18.2.10.4. Recent Developments
- 18.2.10.5. Financials (Based on Availability)
- 18.2.11 Scoop Technologies Inc
- 18.2.11.1. Overview
- 18.2.11.2. Products
- 18.2.11.3. SWOT Analysis
- 18.2.11.4. Recent Developments
- 18.2.11.5. Financials (Based on Availability)
- 18.2.12 Vride Inc (Acquired by Enterprise Holdings Inc
- 18.2.12.1. Overview
- 18.2.12.2. Products
- 18.2.12.3. SWOT Analysis
- 18.2.12.4. Recent Developments
- 18.2.12.5. Financials (Based on Availability)
- 18.2.13 CarpoolWorld (Datasphere Corporation)
- 18.2.13.1. Overview
- 18.2.13.2. Products
- 18.2.13.3. SWOT Analysis
- 18.2.13.4. Recent Developments
- 18.2.13.5. Financials (Based on Availability)
- 18.2.14 Via Transportation Inc
- 18.2.14.1. Overview
- 18.2.14.2. Products
- 18.2.14.3. SWOT Analysis
- 18.2.14.4. Recent Developments
- 18.2.14.5. Financials (Based on Availability)
- 18.2.15 Zimride Inc
- 18.2.15.1. Overview
- 18.2.15.2. Products
- 18.2.15.3. SWOT Analysis
- 18.2.15.4. Recent Developments
- 18.2.15.5. Financials (Based on Availability)
- 18.2.1 Flinc GmbH (Daimler Mobility Services)
List of Figures
- Figure 1: Global Ridesharing Market Revenue Breakdown (Million, %) by Region 2024 & 2032
- Figure 2: North America Ridesharing Market Revenue (Million), by Country 2024 & 2032
- Figure 3: North America Ridesharing Market Revenue Share (%), by Country 2024 & 2032
- Figure 4: Europe Ridesharing Market Revenue (Million), by Country 2024 & 2032
- Figure 5: Europe Ridesharing Market Revenue Share (%), by Country 2024 & 2032
- Figure 6: Asia Pacific Ridesharing Market Revenue (Million), by Country 2024 & 2032
- Figure 7: Asia Pacific Ridesharing Market Revenue Share (%), by Country 2024 & 2032
- Figure 8: South America Ridesharing Market Revenue (Million), by Country 2024 & 2032
- Figure 9: South America Ridesharing Market Revenue Share (%), by Country 2024 & 2032
- Figure 10: North America Ridesharing Market Revenue (Million), by Country 2024 & 2032
- Figure 11: North America Ridesharing Market Revenue Share (%), by Country 2024 & 2032
- Figure 12: MEA Ridesharing Market Revenue (Million), by Country 2024 & 2032
- Figure 13: MEA Ridesharing Market Revenue Share (%), by Country 2024 & 2032
- Figure 14: North America Ridesharing Market Revenue (Million), by Membership Type 2024 & 2032
- Figure 15: North America Ridesharing Market Revenue Share (%), by Membership Type 2024 & 2032
- Figure 16: North America Ridesharing Market Revenue (Million), by Service Type 2024 & 2032
- Figure 17: North America Ridesharing Market Revenue Share (%), by Service Type 2024 & 2032
- Figure 18: North America Ridesharing Market Revenue (Million), by Country 2024 & 2032
- Figure 19: North America Ridesharing Market Revenue Share (%), by Country 2024 & 2032
- Figure 20: Europe Ridesharing Market Revenue (Million), by Membership Type 2024 & 2032
- Figure 21: Europe Ridesharing Market Revenue Share (%), by Membership Type 2024 & 2032
- Figure 22: Europe Ridesharing Market Revenue (Million), by Service Type 2024 & 2032
- Figure 23: Europe Ridesharing Market Revenue Share (%), by Service Type 2024 & 2032
- Figure 24: Europe Ridesharing Market Revenue (Million), by Country 2024 & 2032
- Figure 25: Europe Ridesharing Market Revenue Share (%), by Country 2024 & 2032
- Figure 26: Asia Ridesharing Market Revenue (Million), by Membership Type 2024 & 2032
- Figure 27: Asia Ridesharing Market Revenue Share (%), by Membership Type 2024 & 2032
- Figure 28: Asia Ridesharing Market Revenue (Million), by Service Type 2024 & 2032
- Figure 29: Asia Ridesharing Market Revenue Share (%), by Service Type 2024 & 2032
- Figure 30: Asia Ridesharing Market Revenue (Million), by Country 2024 & 2032
- Figure 31: Asia Ridesharing Market Revenue Share (%), by Country 2024 & 2032
- Figure 32: Australia and New Zealand Ridesharing Market Revenue (Million), by Membership Type 2024 & 2032
- Figure 33: Australia and New Zealand Ridesharing Market Revenue Share (%), by Membership Type 2024 & 2032
- Figure 34: Australia and New Zealand Ridesharing Market Revenue (Million), by Service Type 2024 & 2032
- Figure 35: Australia and New Zealand Ridesharing Market Revenue Share (%), by Service Type 2024 & 2032
- Figure 36: Australia and New Zealand Ridesharing Market Revenue (Million), by Country 2024 & 2032
- Figure 37: Australia and New Zealand Ridesharing Market Revenue Share (%), by Country 2024 & 2032
- Figure 38: Latin America Ridesharing Market Revenue (Million), by Membership Type 2024 & 2032
- Figure 39: Latin America Ridesharing Market Revenue Share (%), by Membership Type 2024 & 2032
- Figure 40: Latin America Ridesharing Market Revenue (Million), by Service Type 2024 & 2032
- Figure 41: Latin America Ridesharing Market Revenue Share (%), by Service Type 2024 & 2032
- Figure 42: Latin America Ridesharing Market Revenue (Million), by Country 2024 & 2032
- Figure 43: Latin America Ridesharing Market Revenue Share (%), by Country 2024 & 2032
- Figure 44: Middle East and Africa Ridesharing Market Revenue (Million), by Membership Type 2024 & 2032
- Figure 45: Middle East and Africa Ridesharing Market Revenue Share (%), by Membership Type 2024 & 2032
- Figure 46: Middle East and Africa Ridesharing Market Revenue (Million), by Service Type 2024 & 2032
- Figure 47: Middle East and Africa Ridesharing Market Revenue Share (%), by Service Type 2024 & 2032
- Figure 48: Middle East and Africa Ridesharing Market Revenue (Million), by Country 2024 & 2032
- Figure 49: Middle East and Africa Ridesharing Market Revenue Share (%), by Country 2024 & 2032
List of Tables
- Table 1: Global Ridesharing Market Revenue Million Forecast, by Region 2019 & 2032
- Table 2: Global Ridesharing Market Revenue Million Forecast, by Membership Type 2019 & 2032
- Table 3: Global Ridesharing Market Revenue Million Forecast, by Service Type 2019 & 2032
- Table 4: Global Ridesharing Market Revenue Million Forecast, by Region 2019 & 2032
- Table 5: Global Ridesharing Market Revenue Million Forecast, by Country 2019 & 2032
- Table 6: United States Ridesharing Market Revenue (Million) Forecast, by Application 2019 & 2032
- Table 7: Canada Ridesharing Market Revenue (Million) Forecast, by Application 2019 & 2032
- Table 8: Mexico Ridesharing Market Revenue (Million) Forecast, by Application 2019 & 2032
- Table 9: Global Ridesharing Market Revenue Million Forecast, by Country 2019 & 2032
- Table 10: Germany Ridesharing Market Revenue (Million) Forecast, by Application 2019 & 2032
- Table 11: United Kingdom Ridesharing Market Revenue (Million) Forecast, by Application 2019 & 2032
- Table 12: France Ridesharing Market Revenue (Million) Forecast, by Application 2019 & 2032
- Table 13: Spain Ridesharing Market Revenue (Million) Forecast, by Application 2019 & 2032
- Table 14: Italy Ridesharing Market Revenue (Million) Forecast, by Application 2019 & 2032
- Table 15: Spain Ridesharing Market Revenue (Million) Forecast, by Application 2019 & 2032
- Table 16: Belgium Ridesharing Market Revenue (Million) Forecast, by Application 2019 & 2032
- Table 17: Netherland Ridesharing Market Revenue (Million) Forecast, by Application 2019 & 2032
- Table 18: Nordics Ridesharing Market Revenue (Million) Forecast, by Application 2019 & 2032
- Table 19: Rest of Europe Ridesharing Market Revenue (Million) Forecast, by Application 2019 & 2032
- Table 20: Global Ridesharing Market Revenue Million Forecast, by Country 2019 & 2032
- Table 21: China Ridesharing Market Revenue (Million) Forecast, by Application 2019 & 2032
- Table 22: Japan Ridesharing Market Revenue (Million) Forecast, by Application 2019 & 2032
- Table 23: India Ridesharing Market Revenue (Million) Forecast, by Application 2019 & 2032
- Table 24: South Korea Ridesharing Market Revenue (Million) Forecast, by Application 2019 & 2032
- Table 25: Southeast Asia Ridesharing Market Revenue (Million) Forecast, by Application 2019 & 2032
- Table 26: Australia Ridesharing Market Revenue (Million) Forecast, by Application 2019 & 2032
- Table 27: Indonesia Ridesharing Market Revenue (Million) Forecast, by Application 2019 & 2032
- Table 28: Phillipes Ridesharing Market Revenue (Million) Forecast, by Application 2019 & 2032
- Table 29: Singapore Ridesharing Market Revenue (Million) Forecast, by Application 2019 & 2032
- Table 30: Thailandc Ridesharing Market Revenue (Million) Forecast, by Application 2019 & 2032
- Table 31: Rest of Asia Pacific Ridesharing Market Revenue (Million) Forecast, by Application 2019 & 2032
- Table 32: Global Ridesharing Market Revenue Million Forecast, by Country 2019 & 2032
- Table 33: Brazil Ridesharing Market Revenue (Million) Forecast, by Application 2019 & 2032
- Table 34: Argentina Ridesharing Market Revenue (Million) Forecast, by Application 2019 & 2032
- Table 35: Peru Ridesharing Market Revenue (Million) Forecast, by Application 2019 & 2032
- Table 36: Chile Ridesharing Market Revenue (Million) Forecast, by Application 2019 & 2032
- Table 37: Colombia Ridesharing Market Revenue (Million) Forecast, by Application 2019 & 2032
- Table 38: Ecuador Ridesharing Market Revenue (Million) Forecast, by Application 2019 & 2032
- Table 39: Venezuela Ridesharing Market Revenue (Million) Forecast, by Application 2019 & 2032
- Table 40: Rest of South America Ridesharing Market Revenue (Million) Forecast, by Application 2019 & 2032
- Table 41: Global Ridesharing Market Revenue Million Forecast, by Country 2019 & 2032
- Table 42: United States Ridesharing Market Revenue (Million) Forecast, by Application 2019 & 2032
- Table 43: Canada Ridesharing Market Revenue (Million) Forecast, by Application 2019 & 2032
- Table 44: Mexico Ridesharing Market Revenue (Million) Forecast, by Application 2019 & 2032
- Table 45: Global Ridesharing Market Revenue Million Forecast, by Country 2019 & 2032
- Table 46: United Arab Emirates Ridesharing Market Revenue (Million) Forecast, by Application 2019 & 2032
- Table 47: Saudi Arabia Ridesharing Market Revenue (Million) Forecast, by Application 2019 & 2032
- Table 48: South Africa Ridesharing Market Revenue (Million) Forecast, by Application 2019 & 2032
- Table 49: Rest of Middle East and Africa Ridesharing Market Revenue (Million) Forecast, by Application 2019 & 2032
- Table 50: Global Ridesharing Market Revenue Million Forecast, by Membership Type 2019 & 2032
- Table 51: Global Ridesharing Market Revenue Million Forecast, by Service Type 2019 & 2032
- Table 52: Global Ridesharing Market Revenue Million Forecast, by Country 2019 & 2032
- Table 53: Global Ridesharing Market Revenue Million Forecast, by Membership Type 2019 & 2032
- Table 54: Global Ridesharing Market Revenue Million Forecast, by Service Type 2019 & 2032
- Table 55: Global Ridesharing Market Revenue Million Forecast, by Country 2019 & 2032
- Table 56: Global Ridesharing Market Revenue Million Forecast, by Membership Type 2019 & 2032
- Table 57: Global Ridesharing Market Revenue Million Forecast, by Service Type 2019 & 2032
- Table 58: Global Ridesharing Market Revenue Million Forecast, by Country 2019 & 2032
- Table 59: Global Ridesharing Market Revenue Million Forecast, by Membership Type 2019 & 2032
- Table 60: Global Ridesharing Market Revenue Million Forecast, by Service Type 2019 & 2032
- Table 61: Global Ridesharing Market Revenue Million Forecast, by Country 2019 & 2032
- Table 62: Global Ridesharing Market Revenue Million Forecast, by Membership Type 2019 & 2032
- Table 63: Global Ridesharing Market Revenue Million Forecast, by Service Type 2019 & 2032
- Table 64: Global Ridesharing Market Revenue Million Forecast, by Country 2019 & 2032
- Table 65: Global Ridesharing Market Revenue Million Forecast, by Membership Type 2019 & 2032
- Table 66: Global Ridesharing Market Revenue Million Forecast, by Service Type 2019 & 2032
- Table 67: Global Ridesharing Market Revenue Million Forecast, by Country 2019 & 2032
Frequently Asked Questions
1. What is the projected Compound Annual Growth Rate (CAGR) of the Ridesharing Market?
The projected CAGR is approximately 12.81%.
2. Which companies are prominent players in the Ridesharing Market?
Key companies in the market include Flinc GmbH (Daimler Mobility Services), BlaBlaCar (Comuto SA), SPLT (Bosch), Didi Chuxing Technology Co, HyreCar Inc, KINTO Join Limited, Wunder Mobility Solutions GmbH, Kangaride Canada Co, GoMore, Klaxit SAS (formerly Wayzup), Scoop Technologies Inc, Vride Inc (Acquired by Enterprise Holdings Inc, CarpoolWorld (Datasphere Corporation), Via Transportation Inc, Zimride Inc.
3. What are the main segments of the Ridesharing Market?
The market segments include Membership Type, Service Type.
4. Can you provide details about the market size?
The market size is estimated to be USD 47.62 Million as of 2022.
5. What are some drivers contributing to market growth?
Cost Advantage and Increasing Availability of Carpooling/Corporate Pooling Services; Incentives and Rebates Provided by Governments in Major Markets. such as France; Increasing Cost of Vehicle Ownership and Environmental Benefits.
6. What are the notable trends driving market growth?
COVID-19 Has Posed Significant Threat to the Market.
7. Are there any restraints impacting market growth?
Technical Challenges Pertaining to CMP Technique.
8. Can you provide examples of recent developments in the market?
June 2022 - Uber has launched a new UberX Share service to share rides, which is remarkably similar to Uber's pre-pandemic carpooling feature, but with a monetary incentive. Riders who choose UberX Share will be paired with another co-rider traveling in the same direction. Uber will give riders a 20% reduction on the overall fee in exchange for the inconvenience and extra time spent on the road. Even if riders are not matched with a co-rider, they will receive an up-front discount on their ride.
9. What pricing options are available for accessing the report?
Pricing options include single-user, multi-user, and enterprise licenses priced at USD 4750, USD 5250, and USD 8750 respectively.
10. Is the market size provided in terms of value or volume?
The market size is provided in terms of value, measured in Million.
11. Are there any specific market keywords associated with the report?
Yes, the market keyword associated with the report is "Ridesharing Market," which aids in identifying and referencing the specific market segment covered.
12. How do I determine which pricing option suits my needs best?
The pricing options vary based on user requirements and access needs. Individual users may opt for single-user licenses, while businesses requiring broader access may choose multi-user or enterprise licenses for cost-effective access to the report.
13. Are there any additional resources or data provided in the Ridesharing Market report?
While the report offers comprehensive insights, it's advisable to review the specific contents or supplementary materials provided to ascertain if additional resources or data are available.
14. How can I stay updated on further developments or reports in the Ridesharing Market?
To stay informed about further developments, trends, and reports in the Ridesharing Market, consider subscribing to industry newsletters, following relevant companies and organizations, or regularly checking reputable industry news sources and publications.
Methodology
Step 1 - Identification of Relevant Samples Size from Population Database


Step 2 - Approaches for Defining Global Market Size (Value, Volume* & Price*)

Note*: In applicable scenarios
Step 3 - Data Sources
Primary Research
- Web Analytics
- Survey Reports
- Research Institute
- Latest Research Reports
- Opinion Leaders
Secondary Research
- Annual Reports
- White Paper
- Latest Press Release
- Industry Association
- Paid Database
- Investor Presentations

Step 4 - Data Triangulation
Involves using different sources of information in order to increase the validity of a study
These sources are likely to be stakeholders in a program - participants, other researchers, program staff, other community members, and so on.
Then we put all data in single framework & apply various statistical tools to find out the dynamic on the market.
During the analysis stage, feedback from the stakeholder groups would be compared to determine areas of agreement as well as areas of divergence
