

Key Insights
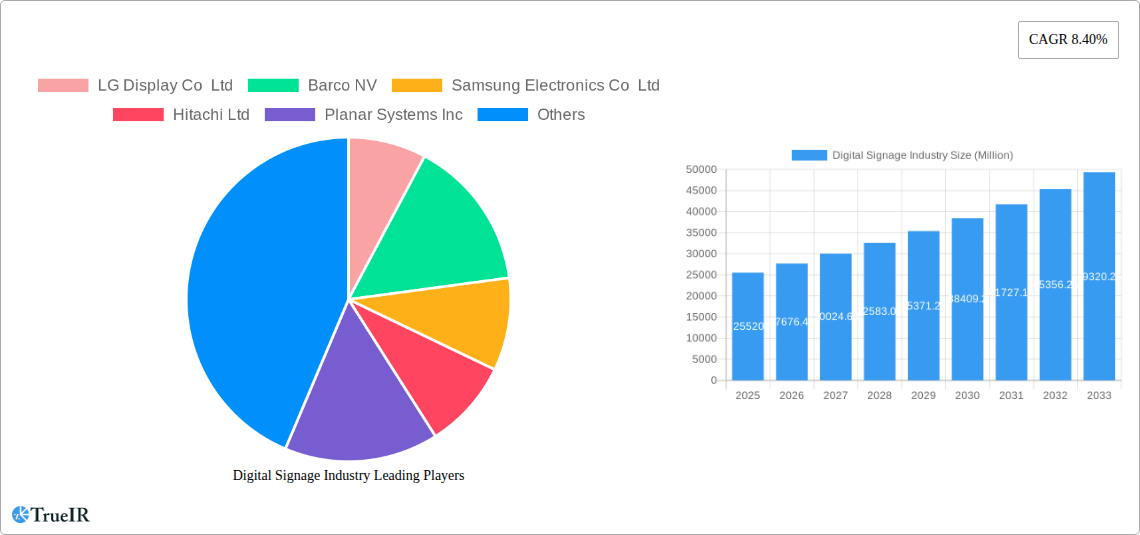
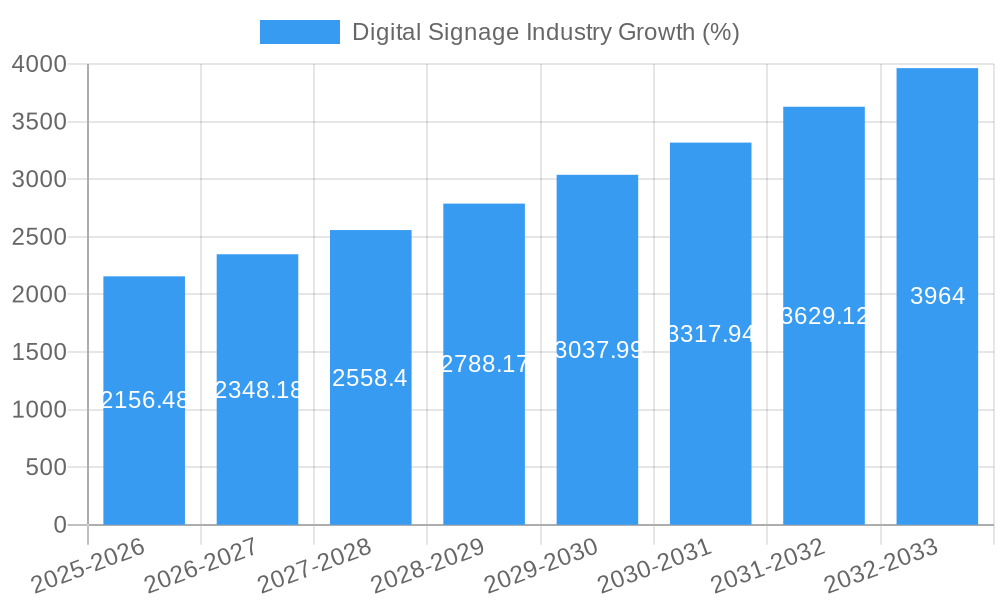
The digital signage market, valued at $25.52 billion in 2025, is experiencing robust growth, projected to expand at a compound annual growth rate (CAGR) of 8.40% from 2025 to 2033. This expansion is driven by several key factors. Firstly, the increasing adoption of digital signage across diverse sectors like retail, transportation, and hospitality reflects a shift towards more engaging and dynamic customer experiences. Businesses leverage digital signage to enhance brand visibility, streamline communication, and improve operational efficiency. Secondly, technological advancements, including the development of higher-resolution displays, improved software capabilities, and the integration of interactive elements, are fueling market growth. The rise of 4K and even 8K displays, coupled with sophisticated content management systems (CMS) that allow for easy updates and targeted messaging, are making digital signage more versatile and appealing. Furthermore, the increasing availability of cost-effective solutions, including cloud-based CMS platforms and more affordable hardware options, are broadening market accessibility, particularly for small and medium-sized businesses.
However, market growth is not without challenges. Competition from traditional advertising methods and concerns about upfront investment costs can hinder adoption in some sectors. Furthermore, ensuring the long-term reliability and maintainability of digital signage networks, especially in high-traffic environments, poses operational complexities for businesses. Despite these restraints, the overall market outlook remains positive, driven by continuous technological innovation, increasing demand for interactive experiences, and the growing recognition of digital signage's ability to deliver measurable ROI in various business applications. The market segmentation, encompassing diverse components (hardware, software, services), sizes (below 32”, 32”-52”, above 52”), locations (in-store, outdoor), applications, and types (video walls, kiosks, etc.), presents significant opportunities for specialized players to cater to specific niche markets. The presence of major players like LG, Samsung, and Barco ensures a competitive landscape fostering innovation and product diversification.
Digital Signage Industry Market Report: 2019-2033
This comprehensive report provides an in-depth analysis of the global digital signage market, projecting a value exceeding $XX million by 2033. The study covers the period 2019-2033, with 2025 as the base and estimated year. It offers a detailed examination of market structure, competitive dynamics, key trends, and growth drivers, providing invaluable insights for industry stakeholders. This report analyzes the digital signage market across various segments, including hardware, software, services, size, location, application, and type, identifying key players and their strategies. The report also highlights recent industry milestones and offers a forward-looking perspective on the market's future trajectory.
Digital Signage Industry Market Structure & Competitive Landscape
The digital signage market exhibits a moderately consolidated structure, with a few dominant players capturing a significant market share. Key companies such as LG Display Co Ltd, Samsung Electronics Co Ltd, and Barco NV, hold leading positions due to their extensive product portfolios and strong brand recognition. The market's concentration ratio (CR4) is estimated at xx%, indicating a moderately competitive landscape. However, the presence of numerous smaller players and the continuous emergence of innovative solutions create a dynamic environment.
Innovation is a crucial driver, with companies constantly developing advanced technologies like AI-powered content management systems, improved display technologies (e.g., transparent LCDs, microLEDs), and interactive features. Regulatory changes, particularly concerning data privacy and advertising standards, impact the market, requiring companies to adapt their strategies. Product substitutes, like traditional billboards and print media, pose a level of competition, but the digital signage industry’s advantages (targeted advertising, dynamic content, measurable ROI) maintain strong market appeal. Furthermore, market segmentation is vast, spanning diverse end-user sectors – from retail and hospitality to corporate and transportation – influencing the competitive dynamics within each segment.
Mergers and acquisitions (M&A) activity has been moderate in recent years, with xx transactions recorded between 2019 and 2024, mainly focused on strengthening technological capabilities and expanding market reach. These activities have contributed to shaping the current market structure and influencing competitive dynamics. Future M&A activity is projected to be driven by the need for innovative technologies and the expansion into new geographical areas.
Digital Signage Industry Market Trends & Opportunities
The global digital signage market is experiencing robust growth, with a projected Compound Annual Growth Rate (CAGR) of xx% during the forecast period (2025-2033). The market size is estimated at $XX million in 2025 and is expected to reach $XX million by 2033. This growth is fueled by several factors, including rising adoption across various sectors, technological advancements (higher resolution displays, improved interactivity), and the increasing demand for effective brand communication.
Consumer preferences are shifting towards engaging and interactive digital experiences, driving demand for advanced features like touchscreens, augmented reality overlays, and personalized content. The competitive landscape is constantly evolving, with companies focusing on delivering innovative solutions, developing robust content management systems, and expanding their service offerings to cater to diverse customer needs. Market penetration is currently at xx% in key sectors like retail and hospitality, indicating significant untapped potential for growth.
Dominant Markets & Segments in Digital Signage Industry
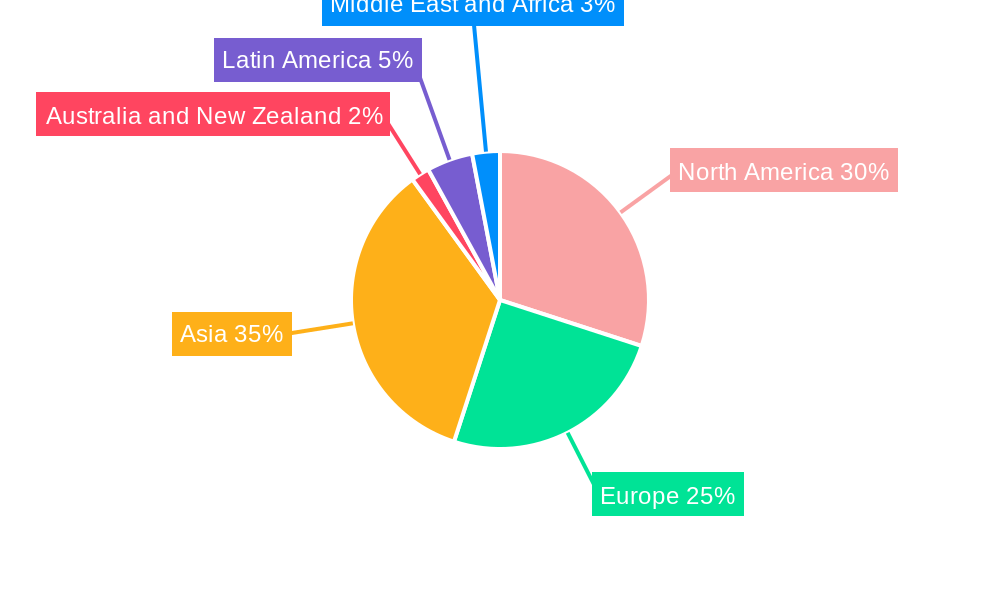
The North American and European regions currently dominate the digital signage market, driven by factors such as robust digital infrastructure, advanced technological capabilities, and high consumer adoption.
- Key Growth Drivers:
- Well-developed digital infrastructure
- High consumer adoption rates
- Strong focus on retail innovation
- Government initiatives supporting smart city initiatives
- High investment in transportation infrastructure
Within the segment analysis:
- Hardware: The hardware segment accounts for the largest market share, driven by continuous innovations in display technologies and increased demand for high-resolution screens.
- Retail Application: Retail remains the largest application segment, due to its effectiveness in enhancing in-store experiences and promoting brand awareness.
- In-store Location: The majority of digital signage deployments are in-store, reflecting the growing adoption by retailers.
- 32' – 52' Size: This size range accounts for a substantial portion of the market, representing a balance between screen size and cost-effectiveness.
Digital Signage Industry Product Analysis
Technological advancements in display technologies, such as higher resolutions, improved brightness, and energy efficiency, are shaping product innovations. The market offers a wide range of products catering to diverse needs, from basic video screens to advanced interactive kiosks and video walls. Competitive advantages are derived from factors like superior image quality, ease of use, cost-effectiveness, and reliable content management systems. Products are increasingly incorporating advanced features such as integration with data analytics platforms and AI-powered content management to enhance effectiveness and ROI for businesses.
Key Drivers, Barriers & Challenges in Digital Signage Industry
Key Drivers:
- Technological advancements: The continuous development of high-resolution displays, touchscreens, and interactive features is boosting market adoption.
- Increased demand for enhanced customer engagement: Businesses are increasingly using digital signage to enhance the customer experience and improve brand visibility.
- Growing adoption of digital marketing strategies: Digital signage provides an effective platform for targeted advertising and promotion.
Challenges:
- High initial investment costs: Implementing digital signage solutions can be expensive, potentially limiting adoption by smaller businesses.
- Content management complexities: Effectively managing content across multiple screens can be challenging, demanding specialized software and expertise.
- Competition from traditional advertising methods: Digital signage faces competition from traditional forms of advertising, requiring continuous innovation to maintain its competitive edge. The impact of this is seen in reduced market penetration in certain sectors (estimated at xx%).
Growth Drivers in the Digital Signage Industry Market
Technological advancements, the increasing demand for enhanced customer experiences, and the expansion of digital marketing strategies are key drivers for the market's growth. Government initiatives promoting smart city projects and investments in public transportation infrastructure further fuel the demand for digital signage solutions. Economic growth in emerging markets creates a strong opportunity for digital signage deployments.
Challenges Impacting Digital Signage Industry Growth
High initial investment costs, content management complexities, and competition from traditional advertising methods pose significant challenges to market growth. Supply chain disruptions can also impact the availability and cost of digital signage components. Regulatory hurdles, especially concerning data privacy and advertising standards, may also impede the market’s expansion.
Key Players Shaping the Digital Signage Industry Market
- LG Display Co Ltd
- Barco NV
- Samsung Electronics Co Ltd
- Hitachi Ltd
- Planar Systems Inc
- Cisco Systems Inc
- NEC Display Solutions Ltd
- Goodview
- Panasonic Corporation
- Stratacache
- Sony Corporation
Significant Digital Signage Industry Milestones
- May 2024: Quest Technology Management and Samsung Electronics America launched a managed service for SMBs, accessible through Telarus.
- March 2024: Quest Technology Management and Samsung partnered to offer an exclusive digital signage solution through Telarus, presenting a unified service.
Future Outlook for Digital Signage Industry Market
The digital signage market is poised for continued growth, driven by technological innovation, increasing demand for interactive experiences, and the expansion of digital marketing strategies. The focus on creating tailored solutions for specific sectors, along with the integration of data analytics and AI, will shape the future of the market. Strategic partnerships and acquisitions will play a crucial role in driving innovation and market consolidation. The market is expected to witness significant expansion in emerging economies, presenting substantial growth opportunities for industry players.
Digital Signage Industry Segmentation
-
1. Type
- 1.1. Video Wall
- 1.2. Video Screen
- 1.3. Kiosk
- 1.4. Transparent LCD Screen
- 1.5. Digital Poster
- 1.6. Other Types
-
2. Component
-
2.1. Hardware
- 2.1.1. LCD/LED Display
- 2.1.2. OLED Display
- 2.1.3. Media Players
- 2.1.4. Projector/Projection Screens
- 2.1.5. Other Hardware
- 2.2. Software
- 2.3. Services
-
2.1. Hardware
-
3. Size
- 3.1. Below 32'
- 3.2. 32' - 52'
- 3.3. Above 52'
-
4. Location
- 4.1. In-store
- 4.2. Outdoor
-
5. Application
- 5.1. Retail
- 5.2. Transportation
- 5.3. Hospitality
- 5.4. Corporate
- 5.5. Education
- 5.6. Government
- 5.7. Other Applications
Digital Signage Industry Segmentation By Geography
- 1. North America
- 2. Asia
- 3. Australia and New Zealand
- 4. Europe
- 5. Latin America
- 6. Middle East and Africa
Digital Signage Industry REPORT HIGHLIGHTS
| Aspects | Details |
|---|---|
| Study Period | 2019-2033 |
| Base Year | 2024 |
| Estimated Year | 2025 |
| Forecast Period | 2025-2033 |
| Historical Period | 2019-2024 |
| Growth Rate | CAGR of 8.40% from 2019-2033 |
| Segmentation |
|
Table of Contents
- 1. Introduction
- 1.1. Research Scope
- 1.2. Market Segmentation
- 1.3. Research Methodology
- 1.4. Definitions and Assumptions
- 2. Executive Summary
- 2.1. Introduction
- 3. Market Dynamics
- 3.1. Introduction
- 3.2. Market Drivers
- 3.2.1. Convergence of Digital Signage with Cross-platform Media Tool; Evolution of Turnkey Solutions; Diminishing Cost of Infrastructure Leading to Higher Penetration
- 3.3. Market Restrains
- 3.3.1. Poor Integration with Complex Business Requirements
- 3.4. Market Trends
- 3.4.1. OLED Display is Expected to Experience Healthy Growth
- 4. Market Factor Analysis
- 4.1. Porters Five Forces
- 4.2. Supply/Value Chain
- 4.3. PESTEL analysis
- 4.4. Market Entropy
- 4.5. Patent/Trademark Analysis
- 5. Global Digital Signage Industry Analysis, Insights and Forecast, 2019-2031
- 5.1. Market Analysis, Insights and Forecast - by Type
- 5.1.1. Video Wall
- 5.1.2. Video Screen
- 5.1.3. Kiosk
- 5.1.4. Transparent LCD Screen
- 5.1.5. Digital Poster
- 5.1.6. Other Types
- 5.2. Market Analysis, Insights and Forecast - by Component
- 5.2.1. Hardware
- 5.2.1.1. LCD/LED Display
- 5.2.1.2. OLED Display
- 5.2.1.3. Media Players
- 5.2.1.4. Projector/Projection Screens
- 5.2.1.5. Other Hardware
- 5.2.2. Software
- 5.2.3. Services
- 5.2.1. Hardware
- 5.3. Market Analysis, Insights and Forecast - by Size
- 5.3.1. Below 32'
- 5.3.2. 32' - 52'
- 5.3.3. Above 52'
- 5.4. Market Analysis, Insights and Forecast - by Location
- 5.4.1. In-store
- 5.4.2. Outdoor
- 5.5. Market Analysis, Insights and Forecast - by Application
- 5.5.1. Retail
- 5.5.2. Transportation
- 5.5.3. Hospitality
- 5.5.4. Corporate
- 5.5.5. Education
- 5.5.6. Government
- 5.5.7. Other Applications
- 5.6. Market Analysis, Insights and Forecast - by Region
- 5.6.1. North America
- 5.6.2. Asia
- 5.6.3. Australia and New Zealand
- 5.6.4. Europe
- 5.6.5. Latin America
- 5.6.6. Middle East and Africa
- 5.1. Market Analysis, Insights and Forecast - by Type
- 6. North America Digital Signage Industry Analysis, Insights and Forecast, 2019-2031
- 6.1. Market Analysis, Insights and Forecast - by Type
- 6.1.1. Video Wall
- 6.1.2. Video Screen
- 6.1.3. Kiosk
- 6.1.4. Transparent LCD Screen
- 6.1.5. Digital Poster
- 6.1.6. Other Types
- 6.2. Market Analysis, Insights and Forecast - by Component
- 6.2.1. Hardware
- 6.2.1.1. LCD/LED Display
- 6.2.1.2. OLED Display
- 6.2.1.3. Media Players
- 6.2.1.4. Projector/Projection Screens
- 6.2.1.5. Other Hardware
- 6.2.2. Software
- 6.2.3. Services
- 6.2.1. Hardware
- 6.3. Market Analysis, Insights and Forecast - by Size
- 6.3.1. Below 32'
- 6.3.2. 32' - 52'
- 6.3.3. Above 52'
- 6.4. Market Analysis, Insights and Forecast - by Location
- 6.4.1. In-store
- 6.4.2. Outdoor
- 6.5. Market Analysis, Insights and Forecast - by Application
- 6.5.1. Retail
- 6.5.2. Transportation
- 6.5.3. Hospitality
- 6.5.4. Corporate
- 6.5.5. Education
- 6.5.6. Government
- 6.5.7. Other Applications
- 6.1. Market Analysis, Insights and Forecast - by Type
- 7. Asia Digital Signage Industry Analysis, Insights and Forecast, 2019-2031
- 7.1. Market Analysis, Insights and Forecast - by Type
- 7.1.1. Video Wall
- 7.1.2. Video Screen
- 7.1.3. Kiosk
- 7.1.4. Transparent LCD Screen
- 7.1.5. Digital Poster
- 7.1.6. Other Types
- 7.2. Market Analysis, Insights and Forecast - by Component
- 7.2.1. Hardware
- 7.2.1.1. LCD/LED Display
- 7.2.1.2. OLED Display
- 7.2.1.3. Media Players
- 7.2.1.4. Projector/Projection Screens
- 7.2.1.5. Other Hardware
- 7.2.2. Software
- 7.2.3. Services
- 7.2.1. Hardware
- 7.3. Market Analysis, Insights and Forecast - by Size
- 7.3.1. Below 32'
- 7.3.2. 32' - 52'
- 7.3.3. Above 52'
- 7.4. Market Analysis, Insights and Forecast - by Location
- 7.4.1. In-store
- 7.4.2. Outdoor
- 7.5. Market Analysis, Insights and Forecast - by Application
- 7.5.1. Retail
- 7.5.2. Transportation
- 7.5.3. Hospitality
- 7.5.4. Corporate
- 7.5.5. Education
- 7.5.6. Government
- 7.5.7. Other Applications
- 7.1. Market Analysis, Insights and Forecast - by Type
- 8. Australia and New Zealand Digital Signage Industry Analysis, Insights and Forecast, 2019-2031
- 8.1. Market Analysis, Insights and Forecast - by Type
- 8.1.1. Video Wall
- 8.1.2. Video Screen
- 8.1.3. Kiosk
- 8.1.4. Transparent LCD Screen
- 8.1.5. Digital Poster
- 8.1.6. Other Types
- 8.2. Market Analysis, Insights and Forecast - by Component
- 8.2.1. Hardware
- 8.2.1.1. LCD/LED Display
- 8.2.1.2. OLED Display
- 8.2.1.3. Media Players
- 8.2.1.4. Projector/Projection Screens
- 8.2.1.5. Other Hardware
- 8.2.2. Software
- 8.2.3. Services
- 8.2.1. Hardware
- 8.3. Market Analysis, Insights and Forecast - by Size
- 8.3.1. Below 32'
- 8.3.2. 32' - 52'
- 8.3.3. Above 52'
- 8.4. Market Analysis, Insights and Forecast - by Location
- 8.4.1. In-store
- 8.4.2. Outdoor
- 8.5. Market Analysis, Insights and Forecast - by Application
- 8.5.1. Retail
- 8.5.2. Transportation
- 8.5.3. Hospitality
- 8.5.4. Corporate
- 8.5.5. Education
- 8.5.6. Government
- 8.5.7. Other Applications
- 8.1. Market Analysis, Insights and Forecast - by Type
- 9. Europe Digital Signage Industry Analysis, Insights and Forecast, 2019-2031
- 9.1. Market Analysis, Insights and Forecast - by Type
- 9.1.1. Video Wall
- 9.1.2. Video Screen
- 9.1.3. Kiosk
- 9.1.4. Transparent LCD Screen
- 9.1.5. Digital Poster
- 9.1.6. Other Types
- 9.2. Market Analysis, Insights and Forecast - by Component
- 9.2.1. Hardware
- 9.2.1.1. LCD/LED Display
- 9.2.1.2. OLED Display
- 9.2.1.3. Media Players
- 9.2.1.4. Projector/Projection Screens
- 9.2.1.5. Other Hardware
- 9.2.2. Software
- 9.2.3. Services
- 9.2.1. Hardware
- 9.3. Market Analysis, Insights and Forecast - by Size
- 9.3.1. Below 32'
- 9.3.2. 32' - 52'
- 9.3.3. Above 52'
- 9.4. Market Analysis, Insights and Forecast - by Location
- 9.4.1. In-store
- 9.4.2. Outdoor
- 9.5. Market Analysis, Insights and Forecast - by Application
- 9.5.1. Retail
- 9.5.2. Transportation
- 9.5.3. Hospitality
- 9.5.4. Corporate
- 9.5.5. Education
- 9.5.6. Government
- 9.5.7. Other Applications
- 9.1. Market Analysis, Insights and Forecast - by Type
- 10. Latin America Digital Signage Industry Analysis, Insights and Forecast, 2019-2031
- 10.1. Market Analysis, Insights and Forecast - by Type
- 10.1.1. Video Wall
- 10.1.2. Video Screen
- 10.1.3. Kiosk
- 10.1.4. Transparent LCD Screen
- 10.1.5. Digital Poster
- 10.1.6. Other Types
- 10.2. Market Analysis, Insights and Forecast - by Component
- 10.2.1. Hardware
- 10.2.1.1. LCD/LED Display
- 10.2.1.2. OLED Display
- 10.2.1.3. Media Players
- 10.2.1.4. Projector/Projection Screens
- 10.2.1.5. Other Hardware
- 10.2.2. Software
- 10.2.3. Services
- 10.2.1. Hardware
- 10.3. Market Analysis, Insights and Forecast - by Size
- 10.3.1. Below 32'
- 10.3.2. 32' - 52'
- 10.3.3. Above 52'
- 10.4. Market Analysis, Insights and Forecast - by Location
- 10.4.1. In-store
- 10.4.2. Outdoor
- 10.5. Market Analysis, Insights and Forecast - by Application
- 10.5.1. Retail
- 10.5.2. Transportation
- 10.5.3. Hospitality
- 10.5.4. Corporate
- 10.5.5. Education
- 10.5.6. Government
- 10.5.7. Other Applications
- 10.1. Market Analysis, Insights and Forecast - by Type
- 11. Middle East and Africa Digital Signage Industry Analysis, Insights and Forecast, 2019-2031
- 11.1. Market Analysis, Insights and Forecast - by Type
- 11.1.1. Video Wall
- 11.1.2. Video Screen
- 11.1.3. Kiosk
- 11.1.4. Transparent LCD Screen
- 11.1.5. Digital Poster
- 11.1.6. Other Types
- 11.2. Market Analysis, Insights and Forecast - by Component
- 11.2.1. Hardware
- 11.2.1.1. LCD/LED Display
- 11.2.1.2. OLED Display
- 11.2.1.3. Media Players
- 11.2.1.4. Projector/Projection Screens
- 11.2.1.5. Other Hardware
- 11.2.2. Software
- 11.2.3. Services
- 11.2.1. Hardware
- 11.3. Market Analysis, Insights and Forecast - by Size
- 11.3.1. Below 32'
- 11.3.2. 32' - 52'
- 11.3.3. Above 52'
- 11.4. Market Analysis, Insights and Forecast - by Location
- 11.4.1. In-store
- 11.4.2. Outdoor
- 11.5. Market Analysis, Insights and Forecast - by Application
- 11.5.1. Retail
- 11.5.2. Transportation
- 11.5.3. Hospitality
- 11.5.4. Corporate
- 11.5.5. Education
- 11.5.6. Government
- 11.5.7. Other Applications
- 11.1. Market Analysis, Insights and Forecast - by Type
- 12. North America Digital Signage Industry Analysis, Insights and Forecast, 2019-2031
- 12.1. Market Analysis, Insights and Forecast - By Country/Sub-region
- 12.1.1.
- 13. Asia Digital Signage Industry Analysis, Insights and Forecast, 2019-2031
- 13.1. Market Analysis, Insights and Forecast - By Country/Sub-region
- 13.1.1.
- 14. Australia and New Zealand Digital Signage Industry Analysis, Insights and Forecast, 2019-2031
- 14.1. Market Analysis, Insights and Forecast - By Country/Sub-region
- 14.1.1.
- 15. Europe Digital Signage Industry Analysis, Insights and Forecast, 2019-2031
- 15.1. Market Analysis, Insights and Forecast - By Country/Sub-region
- 15.1.1.
- 16. Latin America Digital Signage Industry Analysis, Insights and Forecast, 2019-2031
- 16.1. Market Analysis, Insights and Forecast - By Country/Sub-region
- 16.1.1.
- 17. Middle East and Africa Digital Signage Industry Analysis, Insights and Forecast, 2019-2031
- 17.1. Market Analysis, Insights and Forecast - By Country/Sub-region
- 17.1.1.
- 18. Competitive Analysis
- 18.1. Global Market Share Analysis 2024
- 18.2. Company Profiles
- 18.2.1 LG Display Co Ltd
- 18.2.1.1. Overview
- 18.2.1.2. Products
- 18.2.1.3. SWOT Analysis
- 18.2.1.4. Recent Developments
- 18.2.1.5. Financials (Based on Availability)
- 18.2.2 Barco NV
- 18.2.2.1. Overview
- 18.2.2.2. Products
- 18.2.2.3. SWOT Analysis
- 18.2.2.4. Recent Developments
- 18.2.2.5. Financials (Based on Availability)
- 18.2.3 Samsung Electronics Co Ltd
- 18.2.3.1. Overview
- 18.2.3.2. Products
- 18.2.3.3. SWOT Analysis
- 18.2.3.4. Recent Developments
- 18.2.3.5. Financials (Based on Availability)
- 18.2.4 Hitachi Ltd
- 18.2.4.1. Overview
- 18.2.4.2. Products
- 18.2.4.3. SWOT Analysis
- 18.2.4.4. Recent Developments
- 18.2.4.5. Financials (Based on Availability)
- 18.2.5 Planar Systems Inc
- 18.2.5.1. Overview
- 18.2.5.2. Products
- 18.2.5.3. SWOT Analysis
- 18.2.5.4. Recent Developments
- 18.2.5.5. Financials (Based on Availability)
- 18.2.6 Cisco Systems Inc
- 18.2.6.1. Overview
- 18.2.6.2. Products
- 18.2.6.3. SWOT Analysis
- 18.2.6.4. Recent Developments
- 18.2.6.5. Financials (Based on Availability)
- 18.2.7 NEC Display Solutions Ltd
- 18.2.7.1. Overview
- 18.2.7.2. Products
- 18.2.7.3. SWOT Analysis
- 18.2.7.4. Recent Developments
- 18.2.7.5. Financials (Based on Availability)
- 18.2.8 Goodview
- 18.2.8.1. Overview
- 18.2.8.2. Products
- 18.2.8.3. SWOT Analysis
- 18.2.8.4. Recent Developments
- 18.2.8.5. Financials (Based on Availability)
- 18.2.9 Panasonic Corporation
- 18.2.9.1. Overview
- 18.2.9.2. Products
- 18.2.9.3. SWOT Analysis
- 18.2.9.4. Recent Developments
- 18.2.9.5. Financials (Based on Availability)
- 18.2.10 Stratacache
- 18.2.10.1. Overview
- 18.2.10.2. Products
- 18.2.10.3. SWOT Analysis
- 18.2.10.4. Recent Developments
- 18.2.10.5. Financials (Based on Availability)
- 18.2.11 Sony Corporation
- 18.2.11.1. Overview
- 18.2.11.2. Products
- 18.2.11.3. SWOT Analysis
- 18.2.11.4. Recent Developments
- 18.2.11.5. Financials (Based on Availability)
- 18.2.1 LG Display Co Ltd
List of Figures
- Figure 1: Global Digital Signage Industry Revenue Breakdown (Million, %) by Region 2024 & 2032
- Figure 2: North America Digital Signage Industry Revenue (Million), by Country 2024 & 2032
- Figure 3: North America Digital Signage Industry Revenue Share (%), by Country 2024 & 2032
- Figure 4: Asia Digital Signage Industry Revenue (Million), by Country 2024 & 2032
- Figure 5: Asia Digital Signage Industry Revenue Share (%), by Country 2024 & 2032
- Figure 6: Australia and New Zealand Digital Signage Industry Revenue (Million), by Country 2024 & 2032
- Figure 7: Australia and New Zealand Digital Signage Industry Revenue Share (%), by Country 2024 & 2032
- Figure 8: Europe Digital Signage Industry Revenue (Million), by Country 2024 & 2032
- Figure 9: Europe Digital Signage Industry Revenue Share (%), by Country 2024 & 2032
- Figure 10: Latin America Digital Signage Industry Revenue (Million), by Country 2024 & 2032
- Figure 11: Latin America Digital Signage Industry Revenue Share (%), by Country 2024 & 2032
- Figure 12: Middle East and Africa Digital Signage Industry Revenue (Million), by Country 2024 & 2032
- Figure 13: Middle East and Africa Digital Signage Industry Revenue Share (%), by Country 2024 & 2032
- Figure 14: North America Digital Signage Industry Revenue (Million), by Type 2024 & 2032
- Figure 15: North America Digital Signage Industry Revenue Share (%), by Type 2024 & 2032
- Figure 16: North America Digital Signage Industry Revenue (Million), by Component 2024 & 2032
- Figure 17: North America Digital Signage Industry Revenue Share (%), by Component 2024 & 2032
- Figure 18: North America Digital Signage Industry Revenue (Million), by Size 2024 & 2032
- Figure 19: North America Digital Signage Industry Revenue Share (%), by Size 2024 & 2032
- Figure 20: North America Digital Signage Industry Revenue (Million), by Location 2024 & 2032
- Figure 21: North America Digital Signage Industry Revenue Share (%), by Location 2024 & 2032
- Figure 22: North America Digital Signage Industry Revenue (Million), by Application 2024 & 2032
- Figure 23: North America Digital Signage Industry Revenue Share (%), by Application 2024 & 2032
- Figure 24: North America Digital Signage Industry Revenue (Million), by Country 2024 & 2032
- Figure 25: North America Digital Signage Industry Revenue Share (%), by Country 2024 & 2032
- Figure 26: Asia Digital Signage Industry Revenue (Million), by Type 2024 & 2032
- Figure 27: Asia Digital Signage Industry Revenue Share (%), by Type 2024 & 2032
- Figure 28: Asia Digital Signage Industry Revenue (Million), by Component 2024 & 2032
- Figure 29: Asia Digital Signage Industry Revenue Share (%), by Component 2024 & 2032
- Figure 30: Asia Digital Signage Industry Revenue (Million), by Size 2024 & 2032
- Figure 31: Asia Digital Signage Industry Revenue Share (%), by Size 2024 & 2032
- Figure 32: Asia Digital Signage Industry Revenue (Million), by Location 2024 & 2032
- Figure 33: Asia Digital Signage Industry Revenue Share (%), by Location 2024 & 2032
- Figure 34: Asia Digital Signage Industry Revenue (Million), by Application 2024 & 2032
- Figure 35: Asia Digital Signage Industry Revenue Share (%), by Application 2024 & 2032
- Figure 36: Asia Digital Signage Industry Revenue (Million), by Country 2024 & 2032
- Figure 37: Asia Digital Signage Industry Revenue Share (%), by Country 2024 & 2032
- Figure 38: Australia and New Zealand Digital Signage Industry Revenue (Million), by Type 2024 & 2032
- Figure 39: Australia and New Zealand Digital Signage Industry Revenue Share (%), by Type 2024 & 2032
- Figure 40: Australia and New Zealand Digital Signage Industry Revenue (Million), by Component 2024 & 2032
- Figure 41: Australia and New Zealand Digital Signage Industry Revenue Share (%), by Component 2024 & 2032
- Figure 42: Australia and New Zealand Digital Signage Industry Revenue (Million), by Size 2024 & 2032
- Figure 43: Australia and New Zealand Digital Signage Industry Revenue Share (%), by Size 2024 & 2032
- Figure 44: Australia and New Zealand Digital Signage Industry Revenue (Million), by Location 2024 & 2032
- Figure 45: Australia and New Zealand Digital Signage Industry Revenue Share (%), by Location 2024 & 2032
- Figure 46: Australia and New Zealand Digital Signage Industry Revenue (Million), by Application 2024 & 2032
- Figure 47: Australia and New Zealand Digital Signage Industry Revenue Share (%), by Application 2024 & 2032
- Figure 48: Australia and New Zealand Digital Signage Industry Revenue (Million), by Country 2024 & 2032
- Figure 49: Australia and New Zealand Digital Signage Industry Revenue Share (%), by Country 2024 & 2032
- Figure 50: Europe Digital Signage Industry Revenue (Million), by Type 2024 & 2032
- Figure 51: Europe Digital Signage Industry Revenue Share (%), by Type 2024 & 2032
- Figure 52: Europe Digital Signage Industry Revenue (Million), by Component 2024 & 2032
- Figure 53: Europe Digital Signage Industry Revenue Share (%), by Component 2024 & 2032
- Figure 54: Europe Digital Signage Industry Revenue (Million), by Size 2024 & 2032
- Figure 55: Europe Digital Signage Industry Revenue Share (%), by Size 2024 & 2032
- Figure 56: Europe Digital Signage Industry Revenue (Million), by Location 2024 & 2032
- Figure 57: Europe Digital Signage Industry Revenue Share (%), by Location 2024 & 2032
- Figure 58: Europe Digital Signage Industry Revenue (Million), by Application 2024 & 2032
- Figure 59: Europe Digital Signage Industry Revenue Share (%), by Application 2024 & 2032
- Figure 60: Europe Digital Signage Industry Revenue (Million), by Country 2024 & 2032
- Figure 61: Europe Digital Signage Industry Revenue Share (%), by Country 2024 & 2032
- Figure 62: Latin America Digital Signage Industry Revenue (Million), by Type 2024 & 2032
- Figure 63: Latin America Digital Signage Industry Revenue Share (%), by Type 2024 & 2032
- Figure 64: Latin America Digital Signage Industry Revenue (Million), by Component 2024 & 2032
- Figure 65: Latin America Digital Signage Industry Revenue Share (%), by Component 2024 & 2032
- Figure 66: Latin America Digital Signage Industry Revenue (Million), by Size 2024 & 2032
- Figure 67: Latin America Digital Signage Industry Revenue Share (%), by Size 2024 & 2032
- Figure 68: Latin America Digital Signage Industry Revenue (Million), by Location 2024 & 2032
- Figure 69: Latin America Digital Signage Industry Revenue Share (%), by Location 2024 & 2032
- Figure 70: Latin America Digital Signage Industry Revenue (Million), by Application 2024 & 2032
- Figure 71: Latin America Digital Signage Industry Revenue Share (%), by Application 2024 & 2032
- Figure 72: Latin America Digital Signage Industry Revenue (Million), by Country 2024 & 2032
- Figure 73: Latin America Digital Signage Industry Revenue Share (%), by Country 2024 & 2032
- Figure 74: Middle East and Africa Digital Signage Industry Revenue (Million), by Type 2024 & 2032
- Figure 75: Middle East and Africa Digital Signage Industry Revenue Share (%), by Type 2024 & 2032
- Figure 76: Middle East and Africa Digital Signage Industry Revenue (Million), by Component 2024 & 2032
- Figure 77: Middle East and Africa Digital Signage Industry Revenue Share (%), by Component 2024 & 2032
- Figure 78: Middle East and Africa Digital Signage Industry Revenue (Million), by Size 2024 & 2032
- Figure 79: Middle East and Africa Digital Signage Industry Revenue Share (%), by Size 2024 & 2032
- Figure 80: Middle East and Africa Digital Signage Industry Revenue (Million), by Location 2024 & 2032
- Figure 81: Middle East and Africa Digital Signage Industry Revenue Share (%), by Location 2024 & 2032
- Figure 82: Middle East and Africa Digital Signage Industry Revenue (Million), by Application 2024 & 2032
- Figure 83: Middle East and Africa Digital Signage Industry Revenue Share (%), by Application 2024 & 2032
- Figure 84: Middle East and Africa Digital Signage Industry Revenue (Million), by Country 2024 & 2032
- Figure 85: Middle East and Africa Digital Signage Industry Revenue Share (%), by Country 2024 & 2032
List of Tables
- Table 1: Global Digital Signage Industry Revenue Million Forecast, by Region 2019 & 2032
- Table 2: Global Digital Signage Industry Revenue Million Forecast, by Type 2019 & 2032
- Table 3: Global Digital Signage Industry Revenue Million Forecast, by Component 2019 & 2032
- Table 4: Global Digital Signage Industry Revenue Million Forecast, by Size 2019 & 2032
- Table 5: Global Digital Signage Industry Revenue Million Forecast, by Location 2019 & 2032
- Table 6: Global Digital Signage Industry Revenue Million Forecast, by Application 2019 & 2032
- Table 7: Global Digital Signage Industry Revenue Million Forecast, by Region 2019 & 2032
- Table 8: Global Digital Signage Industry Revenue Million Forecast, by Country 2019 & 2032
- Table 9: Digital Signage Industry Revenue (Million) Forecast, by Application 2019 & 2032
- Table 10: Global Digital Signage Industry Revenue Million Forecast, by Country 2019 & 2032
- Table 11: Digital Signage Industry Revenue (Million) Forecast, by Application 2019 & 2032
- Table 12: Global Digital Signage Industry Revenue Million Forecast, by Country 2019 & 2032
- Table 13: Digital Signage Industry Revenue (Million) Forecast, by Application 2019 & 2032
- Table 14: Global Digital Signage Industry Revenue Million Forecast, by Country 2019 & 2032
- Table 15: Digital Signage Industry Revenue (Million) Forecast, by Application 2019 & 2032
- Table 16: Global Digital Signage Industry Revenue Million Forecast, by Country 2019 & 2032
- Table 17: Digital Signage Industry Revenue (Million) Forecast, by Application 2019 & 2032
- Table 18: Global Digital Signage Industry Revenue Million Forecast, by Country 2019 & 2032
- Table 19: Digital Signage Industry Revenue (Million) Forecast, by Application 2019 & 2032
- Table 20: Global Digital Signage Industry Revenue Million Forecast, by Type 2019 & 2032
- Table 21: Global Digital Signage Industry Revenue Million Forecast, by Component 2019 & 2032
- Table 22: Global Digital Signage Industry Revenue Million Forecast, by Size 2019 & 2032
- Table 23: Global Digital Signage Industry Revenue Million Forecast, by Location 2019 & 2032
- Table 24: Global Digital Signage Industry Revenue Million Forecast, by Application 2019 & 2032
- Table 25: Global Digital Signage Industry Revenue Million Forecast, by Country 2019 & 2032
- Table 26: Global Digital Signage Industry Revenue Million Forecast, by Type 2019 & 2032
- Table 27: Global Digital Signage Industry Revenue Million Forecast, by Component 2019 & 2032
- Table 28: Global Digital Signage Industry Revenue Million Forecast, by Size 2019 & 2032
- Table 29: Global Digital Signage Industry Revenue Million Forecast, by Location 2019 & 2032
- Table 30: Global Digital Signage Industry Revenue Million Forecast, by Application 2019 & 2032
- Table 31: Global Digital Signage Industry Revenue Million Forecast, by Country 2019 & 2032
- Table 32: Global Digital Signage Industry Revenue Million Forecast, by Type 2019 & 2032
- Table 33: Global Digital Signage Industry Revenue Million Forecast, by Component 2019 & 2032
- Table 34: Global Digital Signage Industry Revenue Million Forecast, by Size 2019 & 2032
- Table 35: Global Digital Signage Industry Revenue Million Forecast, by Location 2019 & 2032
- Table 36: Global Digital Signage Industry Revenue Million Forecast, by Application 2019 & 2032
- Table 37: Global Digital Signage Industry Revenue Million Forecast, by Country 2019 & 2032
- Table 38: Global Digital Signage Industry Revenue Million Forecast, by Type 2019 & 2032
- Table 39: Global Digital Signage Industry Revenue Million Forecast, by Component 2019 & 2032
- Table 40: Global Digital Signage Industry Revenue Million Forecast, by Size 2019 & 2032
- Table 41: Global Digital Signage Industry Revenue Million Forecast, by Location 2019 & 2032
- Table 42: Global Digital Signage Industry Revenue Million Forecast, by Application 2019 & 2032
- Table 43: Global Digital Signage Industry Revenue Million Forecast, by Country 2019 & 2032
- Table 44: Global Digital Signage Industry Revenue Million Forecast, by Type 2019 & 2032
- Table 45: Global Digital Signage Industry Revenue Million Forecast, by Component 2019 & 2032
- Table 46: Global Digital Signage Industry Revenue Million Forecast, by Size 2019 & 2032
- Table 47: Global Digital Signage Industry Revenue Million Forecast, by Location 2019 & 2032
- Table 48: Global Digital Signage Industry Revenue Million Forecast, by Application 2019 & 2032
- Table 49: Global Digital Signage Industry Revenue Million Forecast, by Country 2019 & 2032
- Table 50: Global Digital Signage Industry Revenue Million Forecast, by Type 2019 & 2032
- Table 51: Global Digital Signage Industry Revenue Million Forecast, by Component 2019 & 2032
- Table 52: Global Digital Signage Industry Revenue Million Forecast, by Size 2019 & 2032
- Table 53: Global Digital Signage Industry Revenue Million Forecast, by Location 2019 & 2032
- Table 54: Global Digital Signage Industry Revenue Million Forecast, by Application 2019 & 2032
- Table 55: Global Digital Signage Industry Revenue Million Forecast, by Country 2019 & 2032
Frequently Asked Questions
1. What is the projected Compound Annual Growth Rate (CAGR) of the Digital Signage Industry?
The projected CAGR is approximately 8.40%.
2. Which companies are prominent players in the Digital Signage Industry?
Key companies in the market include LG Display Co Ltd, Barco NV, Samsung Electronics Co Ltd, Hitachi Ltd, Planar Systems Inc, Cisco Systems Inc, NEC Display Solutions Ltd, Goodview, Panasonic Corporation, Stratacache, Sony Corporation.
3. What are the main segments of the Digital Signage Industry?
The market segments include Type, Component, Size, Location, Application.
4. Can you provide details about the market size?
The market size is estimated to be USD 25.52 Million as of 2022.
5. What are some drivers contributing to market growth?
Convergence of Digital Signage with Cross-platform Media Tool; Evolution of Turnkey Solutions; Diminishing Cost of Infrastructure Leading to Higher Penetration.
6. What are the notable trends driving market growth?
OLED Display is Expected to Experience Healthy Growth.
7. Are there any restraints impacting market growth?
Poor Integration with Complex Business Requirements.
8. Can you provide examples of recent developments in the market?
May 2024 - Quest Technology Management and Samsung Electronics America have collaborated to launch a pioneering managed service tailored for small and midsize businesses (SMBs). This service is available through Telarus technology advisors. The comprehensive package streamlines content and device management and features advanced displays, empowering SMB owners to revamp their business settings and enhance their brand's visibility.
9. What pricing options are available for accessing the report?
Pricing options include single-user, multi-user, and enterprise licenses priced at USD 4750, USD 5250, and USD 8750 respectively.
10. Is the market size provided in terms of value or volume?
The market size is provided in terms of value, measured in Million.
11. Are there any specific market keywords associated with the report?
Yes, the market keyword associated with the report is "Digital Signage Industry," which aids in identifying and referencing the specific market segment covered.
12. How do I determine which pricing option suits my needs best?
The pricing options vary based on user requirements and access needs. Individual users may opt for single-user licenses, while businesses requiring broader access may choose multi-user or enterprise licenses for cost-effective access to the report.
13. Are there any additional resources or data provided in the Digital Signage Industry report?
While the report offers comprehensive insights, it's advisable to review the specific contents or supplementary materials provided to ascertain if additional resources or data are available.
14. How can I stay updated on further developments or reports in the Digital Signage Industry?
To stay informed about further developments, trends, and reports in the Digital Signage Industry, consider subscribing to industry newsletters, following relevant companies and organizations, or regularly checking reputable industry news sources and publications.
Methodology
Step 1 - Identification of Relevant Samples Size from Population Database


Step 2 - Approaches for Defining Global Market Size (Value, Volume* & Price*)

Note*: In applicable scenarios
Step 3 - Data Sources
Primary Research
- Web Analytics
- Survey Reports
- Research Institute
- Latest Research Reports
- Opinion Leaders
Secondary Research
- Annual Reports
- White Paper
- Latest Press Release
- Industry Association
- Paid Database
- Investor Presentations

Step 4 - Data Triangulation
Involves using different sources of information in order to increase the validity of a study
These sources are likely to be stakeholders in a program - participants, other researchers, program staff, other community members, and so on.
Then we put all data in single framework & apply various statistical tools to find out the dynamic on the market.
During the analysis stage, feedback from the stakeholder groups would be compared to determine areas of agreement as well as areas of divergence
