

Key Insights
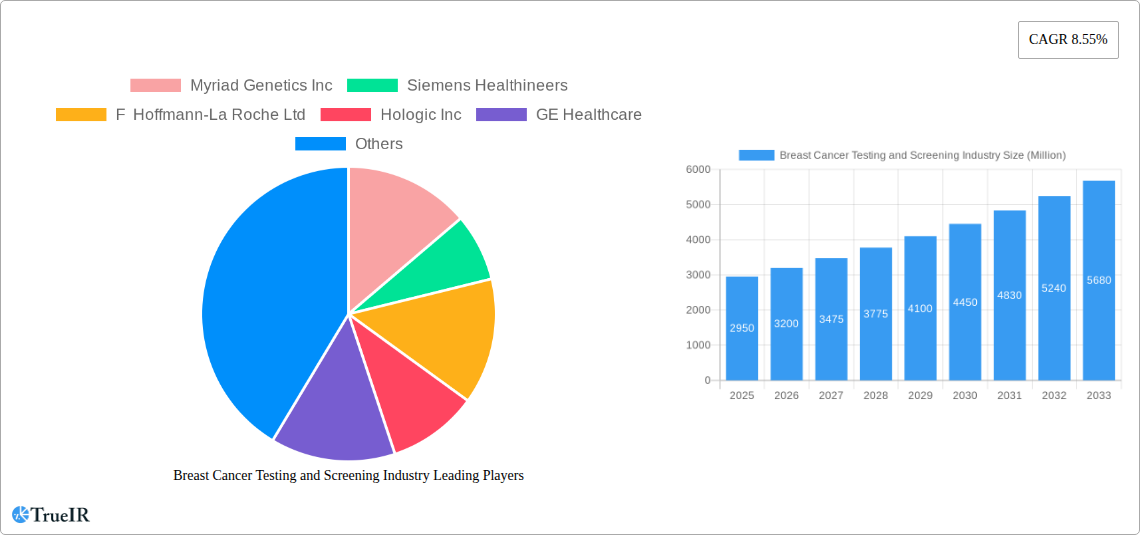
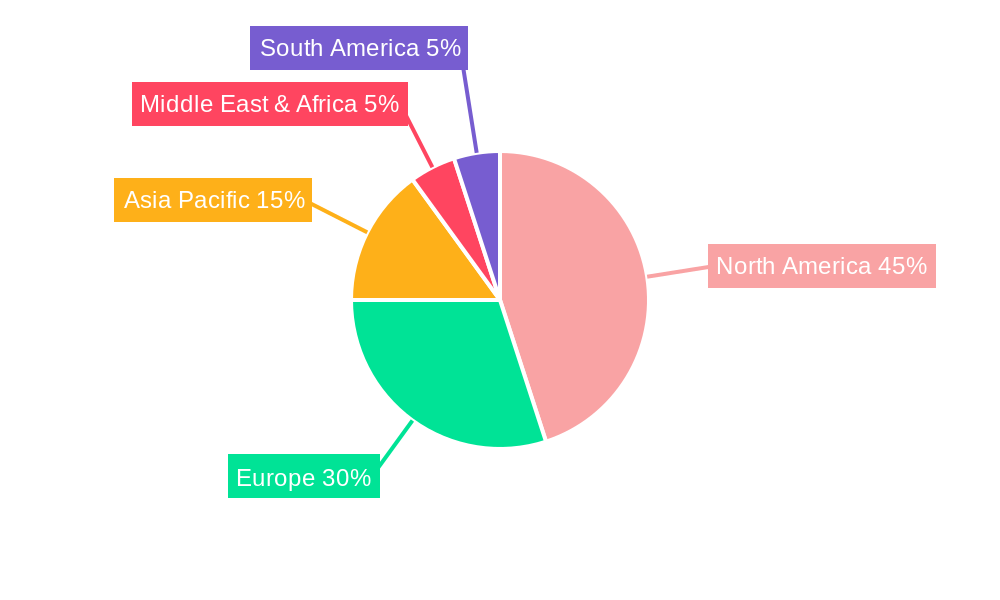
The global breast cancer testing and screening market, valued at $2.95 billion in 2025, is projected to experience robust growth, driven by increasing breast cancer incidence rates, advancements in diagnostic technologies, and rising awareness about early detection. The compound annual growth rate (CAGR) of 8.55% from 2025 to 2033 indicates a significant expansion of the market, reaching an estimated value exceeding $6 billion by 2033. Key drivers include the increasing adoption of genomic tests, providing personalized risk assessment and treatment strategies, alongside the widespread use of advanced imaging techniques like mammography and MRI, enhancing early detection capabilities. Technological advancements, such as liquid biopsies and AI-powered image analysis, are further fueling market growth. However, high testing costs, particularly for advanced genomic tests, and limited access to screening in low- and middle-income countries pose significant restraints. The market is segmented primarily by test type, with genomic tests and imaging tests holding substantial market share, reflecting the diverse approaches to breast cancer diagnosis and management. North America currently dominates the market due to advanced healthcare infrastructure and high healthcare expenditure, followed by Europe and the Asia-Pacific region, which is experiencing rapid growth driven by rising healthcare awareness and increasing disposable incomes.
The competitive landscape is characterized by the presence of major players such as Myriad Genetics, Siemens Healthineers, Roche, Hologic, GE Healthcare, and Philips, along with several smaller specialized companies. These companies are actively engaged in research and development, focusing on improving test accuracy, reducing costs, and developing innovative diagnostic solutions. Future market growth will likely be influenced by the continued development and adoption of non-invasive screening methods, improved reimbursement policies, and increasing government initiatives aimed at promoting breast cancer awareness and early detection programs. Furthermore, the growing integration of big data analytics and AI in the analysis of test results is expected to significantly enhance the diagnostic capabilities and precision of breast cancer testing and screening. The market will witness significant regional variations, with growth heavily influenced by factors like healthcare infrastructure, economic development, and government regulations.
Breast Cancer Testing and Screening Industry: A Comprehensive Market Report (2019-2033)
This dynamic report provides a detailed analysis of the Breast Cancer Testing and Screening industry, projecting a market valuation of $XX Million by 2033. Leveraging a robust methodology and incorporating extensive primary and secondary research, this report offers invaluable insights for stakeholders across the value chain. The study period covers 2019-2033, with 2025 serving as the base and estimated year. The forecast period spans 2025-2033, while the historical period encompasses 2019-2024.
Breast Cancer Testing and Screening Industry Market Structure & Competitive Landscape
The breast cancer testing and screening market exhibits a moderately concentrated structure, with several key players vying for market share. The Herfindahl-Hirschman Index (HHI) for 2025 is estimated at xx, indicating a moderately concentrated market. Innovation is a crucial driver, with companies continuously developing advanced genomic tests, imaging technologies, and AI-driven diagnostic tools. Regulatory approvals and reimbursement policies significantly impact market access and growth. Product substitutes, such as alternative diagnostic methods, exert competitive pressure. The market is segmented by end-users, including hospitals, diagnostic centers, and individual consumers, influencing market penetration and sales strategy. Mergers and acquisitions (M&A) activity has been significant, with xx M&A deals recorded between 2019 and 2024, totaling an estimated value of $xx Million. Future M&A activity is anticipated to further consolidate the market.
- Key Market Players: Myriad Genetics Inc, Siemens Healthineers, F Hoffmann-La Roche Ltd, Hologic Inc, GE Healthcare, Koninklijke Philips N V, Carestream Health, Quest Diagnostics Incorporated, NanoString Technologies Inc, Fujifilm Holdings Corporation. (List Not Exhaustive)
- Concentration Ratio (CR4): xx% (2025 Estimate)
- Innovation Drivers: Next-generation sequencing (NGS), AI-driven image analysis, liquid biopsies
- Regulatory Impact: FDA approvals, reimbursement policies, ethical considerations
- End-User Segmentation: Hospitals, clinics, diagnostic labs, home-testing
Breast Cancer Testing and Screening Industry Market Trends & Opportunities
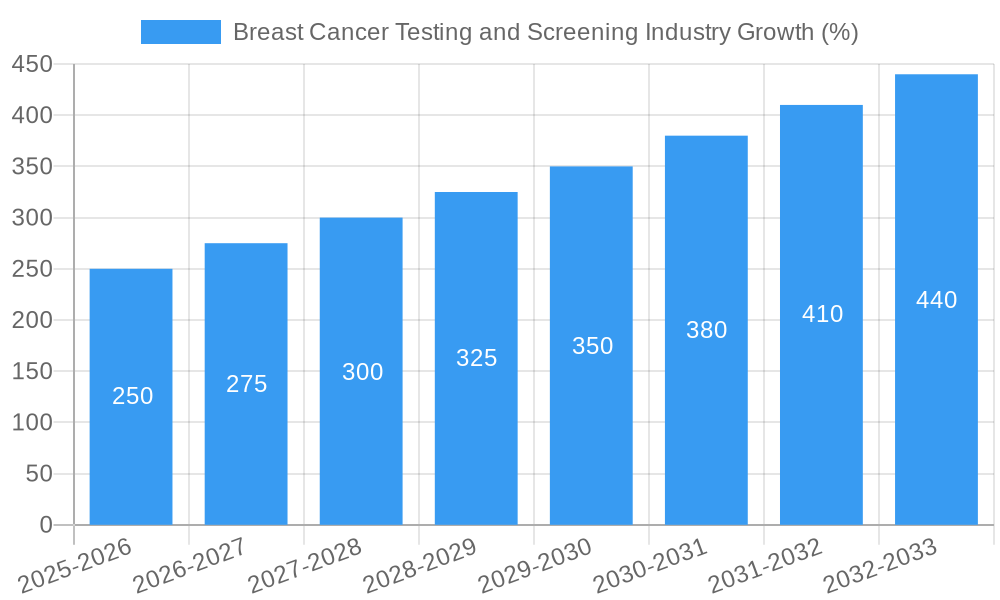
The global breast cancer testing and screening market is experiencing robust growth, driven by increasing breast cancer prevalence, rising awareness, and technological advancements. The market size is estimated at $XX Million in 2025 and is projected to reach $XX Million by 2033, exhibiting a Compound Annual Growth Rate (CAGR) of xx% during the forecast period. This growth is fueled by several key trends, including the increasing adoption of advanced genomic tests offering personalized risk assessment and treatment planning, alongside the proliferation of sophisticated imaging technologies, such as digital mammography and tomosynthesis, enhancing early detection rates. Consumer preference for minimally invasive and faster diagnostic methods is also driving innovation and market penetration. The competitive landscape is characterized by intense rivalry, with companies striving for technological leadership and market share through strategic partnerships, product diversification, and geographical expansion. Market penetration rates for genomic tests are expected to increase from xx% in 2025 to xx% by 2033, while imaging tests' penetration will rise from xx% to xx% in the same period.
Dominant Markets & Segments in Breast Cancer Testing and Screening Industry
The North American market holds the dominant position in the breast cancer testing and screening industry, driven by factors such as high healthcare expenditure, advanced healthcare infrastructure, and strong regulatory support. Within the test segments, genomic tests are witnessing faster growth compared to imaging tests, owing to their ability to provide personalized risk assessments and targeted therapies.
- Leading Region: North America
- Key Growth Drivers (North America): High healthcare expenditure, advanced healthcare infrastructure, strong regulatory support, high prevalence of breast cancer.
- Key Growth Drivers (Genomic Tests): Increasing demand for personalized medicine, advancements in NGS technologies, improved accuracy and reliability.
- Key Growth Drivers (Imaging Tests): Technological advancements in digital mammography and tomosynthesis, increased adoption of AI-powered diagnostic tools, improved image quality and diagnostic accuracy.
Breast Cancer Testing and Screening Industry Product Analysis
The breast cancer testing and screening market features a diverse range of products, encompassing genomic tests (e.g., BRCA gene testing, multi-gene panel testing) and imaging tests (e.g., mammography, ultrasound, MRI). Technological advancements are driving the development of more sensitive, specific, and less invasive tests. The market is witnessing a shift towards liquid biopsies, which offer minimally invasive options for early detection. These products are differentiated based on their sensitivity, specificity, cost-effectiveness, and ease of use. The increasing demand for personalized medicine and early detection fuels the development and adoption of advanced testing solutions.
Key Drivers, Barriers & Challenges in Breast Cancer Testing and Screening Industry
Key Drivers:
- Rising breast cancer incidence and prevalence globally
- Technological advancements leading to improved diagnostic accuracy and early detection
- Increased awareness and proactive screening initiatives
- Growing demand for personalized medicine and targeted therapies
Challenges:
- High cost of advanced testing methods limiting accessibility in low-income countries
- Regulatory complexities and varying reimbursement policies across geographies
- Supply chain disruptions potentially impacting test availability
- Intense competition among industry players
Growth Drivers in the Breast Cancer Testing and Screening Industry Market
Technological advancements, notably in genomic testing and imaging techniques, are major growth catalysts. The rising prevalence of breast cancer coupled with increased public awareness and proactive screening programs significantly drive market expansion. Supportive government policies and funding initiatives further contribute to market growth.
Challenges Impacting Breast Cancer Testing and Screening Industry Growth
High costs associated with advanced testing and treatment, coupled with inconsistent reimbursement policies across various healthcare systems, pose significant challenges. Regulatory complexities and stringent approval processes can slow down product innovation and market entry. Supply chain vulnerabilities and potential disruptions can also impact test availability and affordability. Lastly, stiff competition amongst established players can impact profitability and growth.
Key Players Shaping the Breast Cancer Testing and Screening Industry Market
- Myriad Genetics Inc
- Siemens Healthineers
- F Hoffmann-La Roche Ltd
- Hologic Inc
- GE Healthcare
- Koninklijke Philips N V
- Carestream Health
- Quest Diagnostics Incorporated
- NanoString Technologies Inc
- Fujifilm Holdings Corporation
Significant Breast Cancer Testing and Screening Industry Milestones
- June 2022: Biomerica, Inc. partnered with Walmart to distribute its Aware Breast Self Exam device.
- March 2022: LifeCell launched the Breast Screen Panel, a comprehensive genetic screening test.
Future Outlook for Breast Cancer Testing and Screening Industry Market
The future of the breast cancer testing and screening market is bright, driven by sustained technological innovation, expanding diagnostic capabilities, and a growing emphasis on personalized medicine. Strategic partnerships and collaborations will further accelerate growth. The market is poised for substantial expansion, with significant opportunities for companies focused on developing innovative and accessible testing solutions.
Breast Cancer Testing and Screening Industry Segmentation
-
1. Test
-
1.1. Genomic Tests
- 1.1.1. DNA sequencing and testing
- 1.1.2. Gene expression profiling
-
1.2. Imaging Test
- 1.2.1. Mammograms
- 1.2.2. Ultrasound
- 1.2.3. MRI
- 1.2.4. Tomography
- 1.2.5. Other Imaging Tests
-
1.1. Genomic Tests
Breast Cancer Testing and Screening Industry Segmentation By Geography
-
1. North America
- 1.1. United States
- 1.2. Canada
- 1.3. Mexico
-
2. Europe
- 2.1. Germany
- 2.2. United Kindgom
- 2.3. France
- 2.4. Italy
- 2.5. Spain
- 2.6. Rest of Europe
-
3. Asia Pacific
- 3.1. China
- 3.2. Japan
- 3.3. India
- 3.4. Australia
- 3.5. South Korea
- 3.6. Rest of Asia Pacific
- 4. Middle East
-
5. GCC
- 5.1. South Africa
- 5.2. Rest of Middle East
-
6. South America
- 6.1. Brazil
- 6.2. Argentina
- 6.3. Rest of South America
Breast Cancer Testing and Screening Industry REPORT HIGHLIGHTS
| Aspects | Details |
|---|---|
| Study Period | 2019-2033 |
| Base Year | 2024 |
| Estimated Year | 2025 |
| Forecast Period | 2025-2033 |
| Historical Period | 2019-2024 |
| Growth Rate | CAGR of 8.55% from 2019-2033 |
| Segmentation |
|
Table of Contents
- 1. Introduction
- 1.1. Research Scope
- 1.2. Market Segmentation
- 1.3. Research Methodology
- 1.4. Definitions and Assumptions
- 2. Executive Summary
- 2.1. Introduction
- 3. Market Dynamics
- 3.1. Introduction
- 3.2. Market Drivers
- 3.2.1. Increasing Awareness about Early Detection of Breast Cancer; Growing Incidence of Breast Cancer; Increasing Government Initiatives and Support
- 3.3. Market Restrains
- 3.3.1. Controversies Related to Mammography; High Cost of Screening Tests in the Developing Countries
- 3.4. Market Trends
- 3.4.1. Mammograms segment is Expected to Dominate in the Breast Cancer Screening Test Market
- 4. Market Factor Analysis
- 4.1. Porters Five Forces
- 4.2. Supply/Value Chain
- 4.3. PESTEL analysis
- 4.4. Market Entropy
- 4.5. Patent/Trademark Analysis
- 5. Global Breast Cancer Testing and Screening Industry Analysis, Insights and Forecast, 2019-2031
- 5.1. Market Analysis, Insights and Forecast - by Test
- 5.1.1. Genomic Tests
- 5.1.1.1. DNA sequencing and testing
- 5.1.1.2. Gene expression profiling
- 5.1.2. Imaging Test
- 5.1.2.1. Mammograms
- 5.1.2.2. Ultrasound
- 5.1.2.3. MRI
- 5.1.2.4. Tomography
- 5.1.2.5. Other Imaging Tests
- 5.1.1. Genomic Tests
- 5.2. Market Analysis, Insights and Forecast - by Region
- 5.2.1. North America
- 5.2.2. Europe
- 5.2.3. Asia Pacific
- 5.2.4. Middle East
- 5.2.5. GCC
- 5.2.6. South America
- 5.1. Market Analysis, Insights and Forecast - by Test
- 6. North America Breast Cancer Testing and Screening Industry Analysis, Insights and Forecast, 2019-2031
- 6.1. Market Analysis, Insights and Forecast - by Test
- 6.1.1. Genomic Tests
- 6.1.1.1. DNA sequencing and testing
- 6.1.1.2. Gene expression profiling
- 6.1.2. Imaging Test
- 6.1.2.1. Mammograms
- 6.1.2.2. Ultrasound
- 6.1.2.3. MRI
- 6.1.2.4. Tomography
- 6.1.2.5. Other Imaging Tests
- 6.1.1. Genomic Tests
- 6.1. Market Analysis, Insights and Forecast - by Test
- 7. Europe Breast Cancer Testing and Screening Industry Analysis, Insights and Forecast, 2019-2031
- 7.1. Market Analysis, Insights and Forecast - by Test
- 7.1.1. Genomic Tests
- 7.1.1.1. DNA sequencing and testing
- 7.1.1.2. Gene expression profiling
- 7.1.2. Imaging Test
- 7.1.2.1. Mammograms
- 7.1.2.2. Ultrasound
- 7.1.2.3. MRI
- 7.1.2.4. Tomography
- 7.1.2.5. Other Imaging Tests
- 7.1.1. Genomic Tests
- 7.1. Market Analysis, Insights and Forecast - by Test
- 8. Asia Pacific Breast Cancer Testing and Screening Industry Analysis, Insights and Forecast, 2019-2031
- 8.1. Market Analysis, Insights and Forecast - by Test
- 8.1.1. Genomic Tests
- 8.1.1.1. DNA sequencing and testing
- 8.1.1.2. Gene expression profiling
- 8.1.2. Imaging Test
- 8.1.2.1. Mammograms
- 8.1.2.2. Ultrasound
- 8.1.2.3. MRI
- 8.1.2.4. Tomography
- 8.1.2.5. Other Imaging Tests
- 8.1.1. Genomic Tests
- 8.1. Market Analysis, Insights and Forecast - by Test
- 9. Middle East Breast Cancer Testing and Screening Industry Analysis, Insights and Forecast, 2019-2031
- 9.1. Market Analysis, Insights and Forecast - by Test
- 9.1.1. Genomic Tests
- 9.1.1.1. DNA sequencing and testing
- 9.1.1.2. Gene expression profiling
- 9.1.2. Imaging Test
- 9.1.2.1. Mammograms
- 9.1.2.2. Ultrasound
- 9.1.2.3. MRI
- 9.1.2.4. Tomography
- 9.1.2.5. Other Imaging Tests
- 9.1.1. Genomic Tests
- 9.1. Market Analysis, Insights and Forecast - by Test
- 10. GCC Breast Cancer Testing and Screening Industry Analysis, Insights and Forecast, 2019-2031
- 10.1. Market Analysis, Insights and Forecast - by Test
- 10.1.1. Genomic Tests
- 10.1.1.1. DNA sequencing and testing
- 10.1.1.2. Gene expression profiling
- 10.1.2. Imaging Test
- 10.1.2.1. Mammograms
- 10.1.2.2. Ultrasound
- 10.1.2.3. MRI
- 10.1.2.4. Tomography
- 10.1.2.5. Other Imaging Tests
- 10.1.1. Genomic Tests
- 10.1. Market Analysis, Insights and Forecast - by Test
- 11. South America Breast Cancer Testing and Screening Industry Analysis, Insights and Forecast, 2019-2031
- 11.1. Market Analysis, Insights and Forecast - by Test
- 11.1.1. Genomic Tests
- 11.1.1.1. DNA sequencing and testing
- 11.1.1.2. Gene expression profiling
- 11.1.2. Imaging Test
- 11.1.2.1. Mammograms
- 11.1.2.2. Ultrasound
- 11.1.2.3. MRI
- 11.1.2.4. Tomography
- 11.1.2.5. Other Imaging Tests
- 11.1.1. Genomic Tests
- 11.1. Market Analysis, Insights and Forecast - by Test
- 12. North America Breast Cancer Testing and Screening Industry Analysis, Insights and Forecast, 2019-2031
- 12.1. Market Analysis, Insights and Forecast - By Country/Sub-region
- 12.1.1 United States
- 12.1.2 Canada
- 12.1.3 Mexico
- 13. Europe Breast Cancer Testing and Screening Industry Analysis, Insights and Forecast, 2019-2031
- 13.1. Market Analysis, Insights and Forecast - By Country/Sub-region
- 13.1.1 Germany
- 13.1.2 United Kindgom
- 13.1.3 France
- 13.1.4 Italy
- 13.1.5 Spain
- 13.1.6 Rest of Europe
- 14. Asia Pacific Breast Cancer Testing and Screening Industry Analysis, Insights and Forecast, 2019-2031
- 14.1. Market Analysis, Insights and Forecast - By Country/Sub-region
- 14.1.1 China
- 14.1.2 Japan
- 14.1.3 India
- 14.1.4 Australia
- 14.1.5 South Korea
- 14.1.6 Rest of Asia Pacific
- 15. Middle East Breast Cancer Testing and Screening Industry Analysis, Insights and Forecast, 2019-2031
- 15.1. Market Analysis, Insights and Forecast - By Country/Sub-region
- 15.1.1.
- 16. GCC Breast Cancer Testing and Screening Industry Analysis, Insights and Forecast, 2019-2031
- 16.1. Market Analysis, Insights and Forecast - By Country/Sub-region
- 16.1.1 South Africa
- 16.1.2 Rest of Middle East
- 17. South America Breast Cancer Testing and Screening Industry Analysis, Insights and Forecast, 2019-2031
- 17.1. Market Analysis, Insights and Forecast - By Country/Sub-region
- 17.1.1 Brazil
- 17.1.2 Argentina
- 17.1.3 Rest of South America
- 18. Competitive Analysis
- 18.1. Global Market Share Analysis 2024
- 18.2. Company Profiles
- 18.2.1 Myriad Genetics Inc
- 18.2.1.1. Overview
- 18.2.1.2. Products
- 18.2.1.3. SWOT Analysis
- 18.2.1.4. Recent Developments
- 18.2.1.5. Financials (Based on Availability)
- 18.2.2 Siemens Healthineers
- 18.2.2.1. Overview
- 18.2.2.2. Products
- 18.2.2.3. SWOT Analysis
- 18.2.2.4. Recent Developments
- 18.2.2.5. Financials (Based on Availability)
- 18.2.3 F Hoffmann-La Roche Ltd
- 18.2.3.1. Overview
- 18.2.3.2. Products
- 18.2.3.3. SWOT Analysis
- 18.2.3.4. Recent Developments
- 18.2.3.5. Financials (Based on Availability)
- 18.2.4 Hologic Inc
- 18.2.4.1. Overview
- 18.2.4.2. Products
- 18.2.4.3. SWOT Analysis
- 18.2.4.4. Recent Developments
- 18.2.4.5. Financials (Based on Availability)
- 18.2.5 GE Healthcare
- 18.2.5.1. Overview
- 18.2.5.2. Products
- 18.2.5.3. SWOT Analysis
- 18.2.5.4. Recent Developments
- 18.2.5.5. Financials (Based on Availability)
- 18.2.6 Koninklijke Philips N V
- 18.2.6.1. Overview
- 18.2.6.2. Products
- 18.2.6.3. SWOT Analysis
- 18.2.6.4. Recent Developments
- 18.2.6.5. Financials (Based on Availability)
- 18.2.7 Carestream Health
- 18.2.7.1. Overview
- 18.2.7.2. Products
- 18.2.7.3. SWOT Analysis
- 18.2.7.4. Recent Developments
- 18.2.7.5. Financials (Based on Availability)
- 18.2.8 Quest Diagnostics Incorporated*List Not Exhaustive
- 18.2.8.1. Overview
- 18.2.8.2. Products
- 18.2.8.3. SWOT Analysis
- 18.2.8.4. Recent Developments
- 18.2.8.5. Financials (Based on Availability)
- 18.2.9 NanoString Technologies Inc
- 18.2.9.1. Overview
- 18.2.9.2. Products
- 18.2.9.3. SWOT Analysis
- 18.2.9.4. Recent Developments
- 18.2.9.5. Financials (Based on Availability)
- 18.2.10 Fujifilm Holdings Corporation
- 18.2.10.1. Overview
- 18.2.10.2. Products
- 18.2.10.3. SWOT Analysis
- 18.2.10.4. Recent Developments
- 18.2.10.5. Financials (Based on Availability)
- 18.2.1 Myriad Genetics Inc
List of Figures
- Figure 1: Global Breast Cancer Testing and Screening Industry Revenue Breakdown (Million, %) by Region 2024 & 2032
- Figure 2: Global Breast Cancer Testing and Screening Industry Volume Breakdown (K Unit, %) by Region 2024 & 2032
- Figure 3: North America Breast Cancer Testing and Screening Industry Revenue (Million), by Country 2024 & 2032
- Figure 4: North America Breast Cancer Testing and Screening Industry Volume (K Unit), by Country 2024 & 2032
- Figure 5: North America Breast Cancer Testing and Screening Industry Revenue Share (%), by Country 2024 & 2032
- Figure 6: North America Breast Cancer Testing and Screening Industry Volume Share (%), by Country 2024 & 2032
- Figure 7: Europe Breast Cancer Testing and Screening Industry Revenue (Million), by Country 2024 & 2032
- Figure 8: Europe Breast Cancer Testing and Screening Industry Volume (K Unit), by Country 2024 & 2032
- Figure 9: Europe Breast Cancer Testing and Screening Industry Revenue Share (%), by Country 2024 & 2032
- Figure 10: Europe Breast Cancer Testing and Screening Industry Volume Share (%), by Country 2024 & 2032
- Figure 11: Asia Pacific Breast Cancer Testing and Screening Industry Revenue (Million), by Country 2024 & 2032
- Figure 12: Asia Pacific Breast Cancer Testing and Screening Industry Volume (K Unit), by Country 2024 & 2032
- Figure 13: Asia Pacific Breast Cancer Testing and Screening Industry Revenue Share (%), by Country 2024 & 2032
- Figure 14: Asia Pacific Breast Cancer Testing and Screening Industry Volume Share (%), by Country 2024 & 2032
- Figure 15: Middle East Breast Cancer Testing and Screening Industry Revenue (Million), by Country 2024 & 2032
- Figure 16: Middle East Breast Cancer Testing and Screening Industry Volume (K Unit), by Country 2024 & 2032
- Figure 17: Middle East Breast Cancer Testing and Screening Industry Revenue Share (%), by Country 2024 & 2032
- Figure 18: Middle East Breast Cancer Testing and Screening Industry Volume Share (%), by Country 2024 & 2032
- Figure 19: GCC Breast Cancer Testing and Screening Industry Revenue (Million), by Country 2024 & 2032
- Figure 20: GCC Breast Cancer Testing and Screening Industry Volume (K Unit), by Country 2024 & 2032
- Figure 21: GCC Breast Cancer Testing and Screening Industry Revenue Share (%), by Country 2024 & 2032
- Figure 22: GCC Breast Cancer Testing and Screening Industry Volume Share (%), by Country 2024 & 2032
- Figure 23: South America Breast Cancer Testing and Screening Industry Revenue (Million), by Country 2024 & 2032
- Figure 24: South America Breast Cancer Testing and Screening Industry Volume (K Unit), by Country 2024 & 2032
- Figure 25: South America Breast Cancer Testing and Screening Industry Revenue Share (%), by Country 2024 & 2032
- Figure 26: South America Breast Cancer Testing and Screening Industry Volume Share (%), by Country 2024 & 2032
- Figure 27: North America Breast Cancer Testing and Screening Industry Revenue (Million), by Test 2024 & 2032
- Figure 28: North America Breast Cancer Testing and Screening Industry Volume (K Unit), by Test 2024 & 2032
- Figure 29: North America Breast Cancer Testing and Screening Industry Revenue Share (%), by Test 2024 & 2032
- Figure 30: North America Breast Cancer Testing and Screening Industry Volume Share (%), by Test 2024 & 2032
- Figure 31: North America Breast Cancer Testing and Screening Industry Revenue (Million), by Country 2024 & 2032
- Figure 32: North America Breast Cancer Testing and Screening Industry Volume (K Unit), by Country 2024 & 2032
- Figure 33: North America Breast Cancer Testing and Screening Industry Revenue Share (%), by Country 2024 & 2032
- Figure 34: North America Breast Cancer Testing and Screening Industry Volume Share (%), by Country 2024 & 2032
- Figure 35: Europe Breast Cancer Testing and Screening Industry Revenue (Million), by Test 2024 & 2032
- Figure 36: Europe Breast Cancer Testing and Screening Industry Volume (K Unit), by Test 2024 & 2032
- Figure 37: Europe Breast Cancer Testing and Screening Industry Revenue Share (%), by Test 2024 & 2032
- Figure 38: Europe Breast Cancer Testing and Screening Industry Volume Share (%), by Test 2024 & 2032
- Figure 39: Europe Breast Cancer Testing and Screening Industry Revenue (Million), by Country 2024 & 2032
- Figure 40: Europe Breast Cancer Testing and Screening Industry Volume (K Unit), by Country 2024 & 2032
- Figure 41: Europe Breast Cancer Testing and Screening Industry Revenue Share (%), by Country 2024 & 2032
- Figure 42: Europe Breast Cancer Testing and Screening Industry Volume Share (%), by Country 2024 & 2032
- Figure 43: Asia Pacific Breast Cancer Testing and Screening Industry Revenue (Million), by Test 2024 & 2032
- Figure 44: Asia Pacific Breast Cancer Testing and Screening Industry Volume (K Unit), by Test 2024 & 2032
- Figure 45: Asia Pacific Breast Cancer Testing and Screening Industry Revenue Share (%), by Test 2024 & 2032
- Figure 46: Asia Pacific Breast Cancer Testing and Screening Industry Volume Share (%), by Test 2024 & 2032
- Figure 47: Asia Pacific Breast Cancer Testing and Screening Industry Revenue (Million), by Country 2024 & 2032
- Figure 48: Asia Pacific Breast Cancer Testing and Screening Industry Volume (K Unit), by Country 2024 & 2032
- Figure 49: Asia Pacific Breast Cancer Testing and Screening Industry Revenue Share (%), by Country 2024 & 2032
- Figure 50: Asia Pacific Breast Cancer Testing and Screening Industry Volume Share (%), by Country 2024 & 2032
- Figure 51: Middle East Breast Cancer Testing and Screening Industry Revenue (Million), by Test 2024 & 2032
- Figure 52: Middle East Breast Cancer Testing and Screening Industry Volume (K Unit), by Test 2024 & 2032
- Figure 53: Middle East Breast Cancer Testing and Screening Industry Revenue Share (%), by Test 2024 & 2032
- Figure 54: Middle East Breast Cancer Testing and Screening Industry Volume Share (%), by Test 2024 & 2032
- Figure 55: Middle East Breast Cancer Testing and Screening Industry Revenue (Million), by Country 2024 & 2032
- Figure 56: Middle East Breast Cancer Testing and Screening Industry Volume (K Unit), by Country 2024 & 2032
- Figure 57: Middle East Breast Cancer Testing and Screening Industry Revenue Share (%), by Country 2024 & 2032
- Figure 58: Middle East Breast Cancer Testing and Screening Industry Volume Share (%), by Country 2024 & 2032
- Figure 59: GCC Breast Cancer Testing and Screening Industry Revenue (Million), by Test 2024 & 2032
- Figure 60: GCC Breast Cancer Testing and Screening Industry Volume (K Unit), by Test 2024 & 2032
- Figure 61: GCC Breast Cancer Testing and Screening Industry Revenue Share (%), by Test 2024 & 2032
- Figure 62: GCC Breast Cancer Testing and Screening Industry Volume Share (%), by Test 2024 & 2032
- Figure 63: GCC Breast Cancer Testing and Screening Industry Revenue (Million), by Country 2024 & 2032
- Figure 64: GCC Breast Cancer Testing and Screening Industry Volume (K Unit), by Country 2024 & 2032
- Figure 65: GCC Breast Cancer Testing and Screening Industry Revenue Share (%), by Country 2024 & 2032
- Figure 66: GCC Breast Cancer Testing and Screening Industry Volume Share (%), by Country 2024 & 2032
- Figure 67: South America Breast Cancer Testing and Screening Industry Revenue (Million), by Test 2024 & 2032
- Figure 68: South America Breast Cancer Testing and Screening Industry Volume (K Unit), by Test 2024 & 2032
- Figure 69: South America Breast Cancer Testing and Screening Industry Revenue Share (%), by Test 2024 & 2032
- Figure 70: South America Breast Cancer Testing and Screening Industry Volume Share (%), by Test 2024 & 2032
- Figure 71: South America Breast Cancer Testing and Screening Industry Revenue (Million), by Country 2024 & 2032
- Figure 72: South America Breast Cancer Testing and Screening Industry Volume (K Unit), by Country 2024 & 2032
- Figure 73: South America Breast Cancer Testing and Screening Industry Revenue Share (%), by Country 2024 & 2032
- Figure 74: South America Breast Cancer Testing and Screening Industry Volume Share (%), by Country 2024 & 2032
List of Tables
- Table 1: Global Breast Cancer Testing and Screening Industry Revenue Million Forecast, by Region 2019 & 2032
- Table 2: Global Breast Cancer Testing and Screening Industry Volume K Unit Forecast, by Region 2019 & 2032
- Table 3: Global Breast Cancer Testing and Screening Industry Revenue Million Forecast, by Test 2019 & 2032
- Table 4: Global Breast Cancer Testing and Screening Industry Volume K Unit Forecast, by Test 2019 & 2032
- Table 5: Global Breast Cancer Testing and Screening Industry Revenue Million Forecast, by Region 2019 & 2032
- Table 6: Global Breast Cancer Testing and Screening Industry Volume K Unit Forecast, by Region 2019 & 2032
- Table 7: Global Breast Cancer Testing and Screening Industry Revenue Million Forecast, by Country 2019 & 2032
- Table 8: Global Breast Cancer Testing and Screening Industry Volume K Unit Forecast, by Country 2019 & 2032
- Table 9: United States Breast Cancer Testing and Screening Industry Revenue (Million) Forecast, by Application 2019 & 2032
- Table 10: United States Breast Cancer Testing and Screening Industry Volume (K Unit) Forecast, by Application 2019 & 2032
- Table 11: Canada Breast Cancer Testing and Screening Industry Revenue (Million) Forecast, by Application 2019 & 2032
- Table 12: Canada Breast Cancer Testing and Screening Industry Volume (K Unit) Forecast, by Application 2019 & 2032
- Table 13: Mexico Breast Cancer Testing and Screening Industry Revenue (Million) Forecast, by Application 2019 & 2032
- Table 14: Mexico Breast Cancer Testing and Screening Industry Volume (K Unit) Forecast, by Application 2019 & 2032
- Table 15: Global Breast Cancer Testing and Screening Industry Revenue Million Forecast, by Country 2019 & 2032
- Table 16: Global Breast Cancer Testing and Screening Industry Volume K Unit Forecast, by Country 2019 & 2032
- Table 17: Germany Breast Cancer Testing and Screening Industry Revenue (Million) Forecast, by Application 2019 & 2032
- Table 18: Germany Breast Cancer Testing and Screening Industry Volume (K Unit) Forecast, by Application 2019 & 2032
- Table 19: United Kindgom Breast Cancer Testing and Screening Industry Revenue (Million) Forecast, by Application 2019 & 2032
- Table 20: United Kindgom Breast Cancer Testing and Screening Industry Volume (K Unit) Forecast, by Application 2019 & 2032
- Table 21: France Breast Cancer Testing and Screening Industry Revenue (Million) Forecast, by Application 2019 & 2032
- Table 22: France Breast Cancer Testing and Screening Industry Volume (K Unit) Forecast, by Application 2019 & 2032
- Table 23: Italy Breast Cancer Testing and Screening Industry Revenue (Million) Forecast, by Application 2019 & 2032
- Table 24: Italy Breast Cancer Testing and Screening Industry Volume (K Unit) Forecast, by Application 2019 & 2032
- Table 25: Spain Breast Cancer Testing and Screening Industry Revenue (Million) Forecast, by Application 2019 & 2032
- Table 26: Spain Breast Cancer Testing and Screening Industry Volume (K Unit) Forecast, by Application 2019 & 2032
- Table 27: Rest of Europe Breast Cancer Testing and Screening Industry Revenue (Million) Forecast, by Application 2019 & 2032
- Table 28: Rest of Europe Breast Cancer Testing and Screening Industry Volume (K Unit) Forecast, by Application 2019 & 2032
- Table 29: Global Breast Cancer Testing and Screening Industry Revenue Million Forecast, by Country 2019 & 2032
- Table 30: Global Breast Cancer Testing and Screening Industry Volume K Unit Forecast, by Country 2019 & 2032
- Table 31: China Breast Cancer Testing and Screening Industry Revenue (Million) Forecast, by Application 2019 & 2032
- Table 32: China Breast Cancer Testing and Screening Industry Volume (K Unit) Forecast, by Application 2019 & 2032
- Table 33: Japan Breast Cancer Testing and Screening Industry Revenue (Million) Forecast, by Application 2019 & 2032
- Table 34: Japan Breast Cancer Testing and Screening Industry Volume (K Unit) Forecast, by Application 2019 & 2032
- Table 35: India Breast Cancer Testing and Screening Industry Revenue (Million) Forecast, by Application 2019 & 2032
- Table 36: India Breast Cancer Testing and Screening Industry Volume (K Unit) Forecast, by Application 2019 & 2032
- Table 37: Australia Breast Cancer Testing and Screening Industry Revenue (Million) Forecast, by Application 2019 & 2032
- Table 38: Australia Breast Cancer Testing and Screening Industry Volume (K Unit) Forecast, by Application 2019 & 2032
- Table 39: South Korea Breast Cancer Testing and Screening Industry Revenue (Million) Forecast, by Application 2019 & 2032
- Table 40: South Korea Breast Cancer Testing and Screening Industry Volume (K Unit) Forecast, by Application 2019 & 2032
- Table 41: Rest of Asia Pacific Breast Cancer Testing and Screening Industry Revenue (Million) Forecast, by Application 2019 & 2032
- Table 42: Rest of Asia Pacific Breast Cancer Testing and Screening Industry Volume (K Unit) Forecast, by Application 2019 & 2032
- Table 43: Global Breast Cancer Testing and Screening Industry Revenue Million Forecast, by Country 2019 & 2032
- Table 44: Global Breast Cancer Testing and Screening Industry Volume K Unit Forecast, by Country 2019 & 2032
- Table 45: Breast Cancer Testing and Screening Industry Revenue (Million) Forecast, by Application 2019 & 2032
- Table 46: Breast Cancer Testing and Screening Industry Volume (K Unit) Forecast, by Application 2019 & 2032
- Table 47: Global Breast Cancer Testing and Screening Industry Revenue Million Forecast, by Country 2019 & 2032
- Table 48: Global Breast Cancer Testing and Screening Industry Volume K Unit Forecast, by Country 2019 & 2032
- Table 49: South Africa Breast Cancer Testing and Screening Industry Revenue (Million) Forecast, by Application 2019 & 2032
- Table 50: South Africa Breast Cancer Testing and Screening Industry Volume (K Unit) Forecast, by Application 2019 & 2032
- Table 51: Rest of Middle East Breast Cancer Testing and Screening Industry Revenue (Million) Forecast, by Application 2019 & 2032
- Table 52: Rest of Middle East Breast Cancer Testing and Screening Industry Volume (K Unit) Forecast, by Application 2019 & 2032
- Table 53: Global Breast Cancer Testing and Screening Industry Revenue Million Forecast, by Country 2019 & 2032
- Table 54: Global Breast Cancer Testing and Screening Industry Volume K Unit Forecast, by Country 2019 & 2032
- Table 55: Brazil Breast Cancer Testing and Screening Industry Revenue (Million) Forecast, by Application 2019 & 2032
- Table 56: Brazil Breast Cancer Testing and Screening Industry Volume (K Unit) Forecast, by Application 2019 & 2032
- Table 57: Argentina Breast Cancer Testing and Screening Industry Revenue (Million) Forecast, by Application 2019 & 2032
- Table 58: Argentina Breast Cancer Testing and Screening Industry Volume (K Unit) Forecast, by Application 2019 & 2032
- Table 59: Rest of South America Breast Cancer Testing and Screening Industry Revenue (Million) Forecast, by Application 2019 & 2032
- Table 60: Rest of South America Breast Cancer Testing and Screening Industry Volume (K Unit) Forecast, by Application 2019 & 2032
- Table 61: Global Breast Cancer Testing and Screening Industry Revenue Million Forecast, by Test 2019 & 2032
- Table 62: Global Breast Cancer Testing and Screening Industry Volume K Unit Forecast, by Test 2019 & 2032
- Table 63: Global Breast Cancer Testing and Screening Industry Revenue Million Forecast, by Country 2019 & 2032
- Table 64: Global Breast Cancer Testing and Screening Industry Volume K Unit Forecast, by Country 2019 & 2032
- Table 65: United States Breast Cancer Testing and Screening Industry Revenue (Million) Forecast, by Application 2019 & 2032
- Table 66: United States Breast Cancer Testing and Screening Industry Volume (K Unit) Forecast, by Application 2019 & 2032
- Table 67: Canada Breast Cancer Testing and Screening Industry Revenue (Million) Forecast, by Application 2019 & 2032
- Table 68: Canada Breast Cancer Testing and Screening Industry Volume (K Unit) Forecast, by Application 2019 & 2032
- Table 69: Mexico Breast Cancer Testing and Screening Industry Revenue (Million) Forecast, by Application 2019 & 2032
- Table 70: Mexico Breast Cancer Testing and Screening Industry Volume (K Unit) Forecast, by Application 2019 & 2032
- Table 71: Global Breast Cancer Testing and Screening Industry Revenue Million Forecast, by Test 2019 & 2032
- Table 72: Global Breast Cancer Testing and Screening Industry Volume K Unit Forecast, by Test 2019 & 2032
- Table 73: Global Breast Cancer Testing and Screening Industry Revenue Million Forecast, by Country 2019 & 2032
- Table 74: Global Breast Cancer Testing and Screening Industry Volume K Unit Forecast, by Country 2019 & 2032
- Table 75: Germany Breast Cancer Testing and Screening Industry Revenue (Million) Forecast, by Application 2019 & 2032
- Table 76: Germany Breast Cancer Testing and Screening Industry Volume (K Unit) Forecast, by Application 2019 & 2032
- Table 77: United Kindgom Breast Cancer Testing and Screening Industry Revenue (Million) Forecast, by Application 2019 & 2032
- Table 78: United Kindgom Breast Cancer Testing and Screening Industry Volume (K Unit) Forecast, by Application 2019 & 2032
- Table 79: France Breast Cancer Testing and Screening Industry Revenue (Million) Forecast, by Application 2019 & 2032
- Table 80: France Breast Cancer Testing and Screening Industry Volume (K Unit) Forecast, by Application 2019 & 2032
- Table 81: Italy Breast Cancer Testing and Screening Industry Revenue (Million) Forecast, by Application 2019 & 2032
- Table 82: Italy Breast Cancer Testing and Screening Industry Volume (K Unit) Forecast, by Application 2019 & 2032
- Table 83: Spain Breast Cancer Testing and Screening Industry Revenue (Million) Forecast, by Application 2019 & 2032
- Table 84: Spain Breast Cancer Testing and Screening Industry Volume (K Unit) Forecast, by Application 2019 & 2032
- Table 85: Rest of Europe Breast Cancer Testing and Screening Industry Revenue (Million) Forecast, by Application 2019 & 2032
- Table 86: Rest of Europe Breast Cancer Testing and Screening Industry Volume (K Unit) Forecast, by Application 2019 & 2032
- Table 87: Global Breast Cancer Testing and Screening Industry Revenue Million Forecast, by Test 2019 & 2032
- Table 88: Global Breast Cancer Testing and Screening Industry Volume K Unit Forecast, by Test 2019 & 2032
- Table 89: Global Breast Cancer Testing and Screening Industry Revenue Million Forecast, by Country 2019 & 2032
- Table 90: Global Breast Cancer Testing and Screening Industry Volume K Unit Forecast, by Country 2019 & 2032
- Table 91: China Breast Cancer Testing and Screening Industry Revenue (Million) Forecast, by Application 2019 & 2032
- Table 92: China Breast Cancer Testing and Screening Industry Volume (K Unit) Forecast, by Application 2019 & 2032
- Table 93: Japan Breast Cancer Testing and Screening Industry Revenue (Million) Forecast, by Application 2019 & 2032
- Table 94: Japan Breast Cancer Testing and Screening Industry Volume (K Unit) Forecast, by Application 2019 & 2032
- Table 95: India Breast Cancer Testing and Screening Industry Revenue (Million) Forecast, by Application 2019 & 2032
- Table 96: India Breast Cancer Testing and Screening Industry Volume (K Unit) Forecast, by Application 2019 & 2032
- Table 97: Australia Breast Cancer Testing and Screening Industry Revenue (Million) Forecast, by Application 2019 & 2032
- Table 98: Australia Breast Cancer Testing and Screening Industry Volume (K Unit) Forecast, by Application 2019 & 2032
- Table 99: South Korea Breast Cancer Testing and Screening Industry Revenue (Million) Forecast, by Application 2019 & 2032
- Table 100: South Korea Breast Cancer Testing and Screening Industry Volume (K Unit) Forecast, by Application 2019 & 2032
- Table 101: Rest of Asia Pacific Breast Cancer Testing and Screening Industry Revenue (Million) Forecast, by Application 2019 & 2032
- Table 102: Rest of Asia Pacific Breast Cancer Testing and Screening Industry Volume (K Unit) Forecast, by Application 2019 & 2032
- Table 103: Global Breast Cancer Testing and Screening Industry Revenue Million Forecast, by Test 2019 & 2032
- Table 104: Global Breast Cancer Testing and Screening Industry Volume K Unit Forecast, by Test 2019 & 2032
- Table 105: Global Breast Cancer Testing and Screening Industry Revenue Million Forecast, by Country 2019 & 2032
- Table 106: Global Breast Cancer Testing and Screening Industry Volume K Unit Forecast, by Country 2019 & 2032
- Table 107: Global Breast Cancer Testing and Screening Industry Revenue Million Forecast, by Test 2019 & 2032
- Table 108: Global Breast Cancer Testing and Screening Industry Volume K Unit Forecast, by Test 2019 & 2032
- Table 109: Global Breast Cancer Testing and Screening Industry Revenue Million Forecast, by Country 2019 & 2032
- Table 110: Global Breast Cancer Testing and Screening Industry Volume K Unit Forecast, by Country 2019 & 2032
- Table 111: South Africa Breast Cancer Testing and Screening Industry Revenue (Million) Forecast, by Application 2019 & 2032
- Table 112: South Africa Breast Cancer Testing and Screening Industry Volume (K Unit) Forecast, by Application 2019 & 2032
- Table 113: Rest of Middle East Breast Cancer Testing and Screening Industry Revenue (Million) Forecast, by Application 2019 & 2032
- Table 114: Rest of Middle East Breast Cancer Testing and Screening Industry Volume (K Unit) Forecast, by Application 2019 & 2032
- Table 115: Global Breast Cancer Testing and Screening Industry Revenue Million Forecast, by Test 2019 & 2032
- Table 116: Global Breast Cancer Testing and Screening Industry Volume K Unit Forecast, by Test 2019 & 2032
- Table 117: Global Breast Cancer Testing and Screening Industry Revenue Million Forecast, by Country 2019 & 2032
- Table 118: Global Breast Cancer Testing and Screening Industry Volume K Unit Forecast, by Country 2019 & 2032
- Table 119: Brazil Breast Cancer Testing and Screening Industry Revenue (Million) Forecast, by Application 2019 & 2032
- Table 120: Brazil Breast Cancer Testing and Screening Industry Volume (K Unit) Forecast, by Application 2019 & 2032
- Table 121: Argentina Breast Cancer Testing and Screening Industry Revenue (Million) Forecast, by Application 2019 & 2032
- Table 122: Argentina Breast Cancer Testing and Screening Industry Volume (K Unit) Forecast, by Application 2019 & 2032
- Table 123: Rest of South America Breast Cancer Testing and Screening Industry Revenue (Million) Forecast, by Application 2019 & 2032
- Table 124: Rest of South America Breast Cancer Testing and Screening Industry Volume (K Unit) Forecast, by Application 2019 & 2032
Frequently Asked Questions
1. What is the projected Compound Annual Growth Rate (CAGR) of the Breast Cancer Testing and Screening Industry?
The projected CAGR is approximately 8.55%.
2. Which companies are prominent players in the Breast Cancer Testing and Screening Industry?
Key companies in the market include Myriad Genetics Inc, Siemens Healthineers, F Hoffmann-La Roche Ltd, Hologic Inc, GE Healthcare, Koninklijke Philips N V, Carestream Health, Quest Diagnostics Incorporated*List Not Exhaustive, NanoString Technologies Inc, Fujifilm Holdings Corporation.
3. What are the main segments of the Breast Cancer Testing and Screening Industry?
The market segments include Test.
4. Can you provide details about the market size?
The market size is estimated to be USD 2.95 Million as of 2022.
5. What are some drivers contributing to market growth?
Increasing Awareness about Early Detection of Breast Cancer; Growing Incidence of Breast Cancer; Increasing Government Initiatives and Support.
6. What are the notable trends driving market growth?
Mammograms segment is Expected to Dominate in the Breast Cancer Screening Test Market.
7. Are there any restraints impacting market growth?
Controversies Related to Mammography; High Cost of Screening Tests in the Developing Countries.
8. Can you provide examples of recent developments in the market?
In June 2022, Biomerica, Inc. entered a general merchandise supplier agreement with Walmart. The Aware Breast Self Exam device will be sold in Walmart's retail system.
9. What pricing options are available for accessing the report?
Pricing options include single-user, multi-user, and enterprise licenses priced at USD 4750, USD 5250, and USD 8750 respectively.
10. Is the market size provided in terms of value or volume?
The market size is provided in terms of value, measured in Million and volume, measured in K Unit.
11. Are there any specific market keywords associated with the report?
Yes, the market keyword associated with the report is "Breast Cancer Testing and Screening Industry," which aids in identifying and referencing the specific market segment covered.
12. How do I determine which pricing option suits my needs best?
The pricing options vary based on user requirements and access needs. Individual users may opt for single-user licenses, while businesses requiring broader access may choose multi-user or enterprise licenses for cost-effective access to the report.
13. Are there any additional resources or data provided in the Breast Cancer Testing and Screening Industry report?
While the report offers comprehensive insights, it's advisable to review the specific contents or supplementary materials provided to ascertain if additional resources or data are available.
14. How can I stay updated on further developments or reports in the Breast Cancer Testing and Screening Industry?
To stay informed about further developments, trends, and reports in the Breast Cancer Testing and Screening Industry, consider subscribing to industry newsletters, following relevant companies and organizations, or regularly checking reputable industry news sources and publications.
Methodology
Step 1 - Identification of Relevant Samples Size from Population Database


Step 2 - Approaches for Defining Global Market Size (Value, Volume* & Price*)

Note*: In applicable scenarios
Step 3 - Data Sources
Primary Research
- Web Analytics
- Survey Reports
- Research Institute
- Latest Research Reports
- Opinion Leaders
Secondary Research
- Annual Reports
- White Paper
- Latest Press Release
- Industry Association
- Paid Database
- Investor Presentations

Step 4 - Data Triangulation
Involves using different sources of information in order to increase the validity of a study
These sources are likely to be stakeholders in a program - participants, other researchers, program staff, other community members, and so on.
Then we put all data in single framework & apply various statistical tools to find out the dynamic on the market.
During the analysis stage, feedback from the stakeholder groups would be compared to determine areas of agreement as well as areas of divergence
