

Key Insights
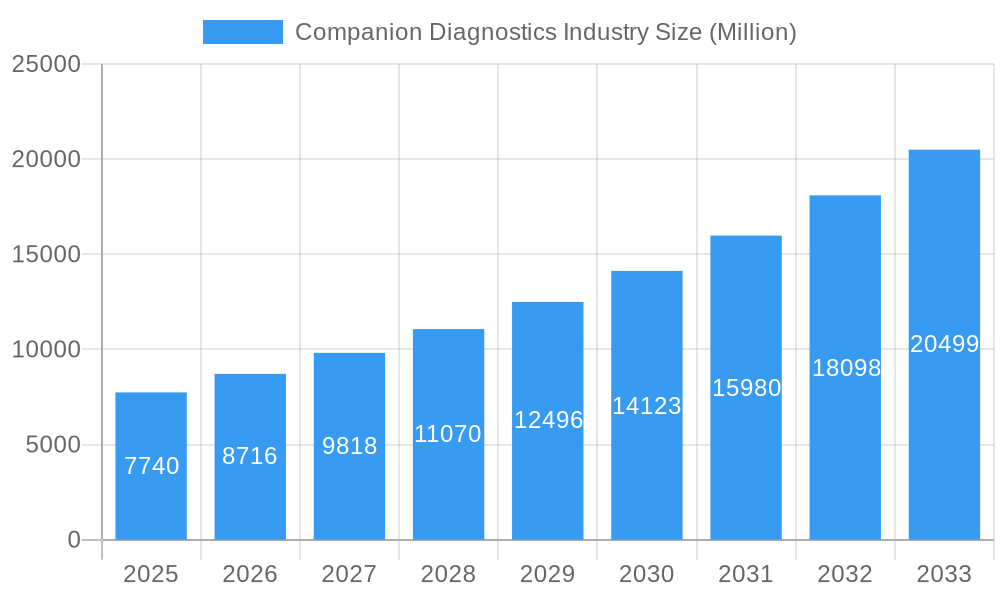
The companion diagnostics market, valued at $7.74 billion in 2025, is projected to experience robust growth, exhibiting a Compound Annual Growth Rate (CAGR) of 12.54% from 2025 to 2033. This expansion is driven by several key factors. Firstly, the increasing prevalence of cancer and other chronic diseases necessitates more precise and personalized treatment strategies. Companion diagnostics play a crucial role in identifying patients most likely to benefit from specific therapies, optimizing treatment efficacy and reducing adverse effects. Secondly, advancements in molecular diagnostics technologies, such as next-generation sequencing (NGS) and PCR, are continuously improving the accuracy, speed, and affordability of companion diagnostic tests. This technological progress fuels market expansion, enabling earlier disease detection and more effective targeted therapies. Furthermore, the growing adoption of personalized medicine approaches across healthcare systems globally is a significant driver, increasing the demand for accurate companion diagnostic tests. Regulatory approvals for new companion diagnostic tests and increasing investments in research and development further contribute to market growth.
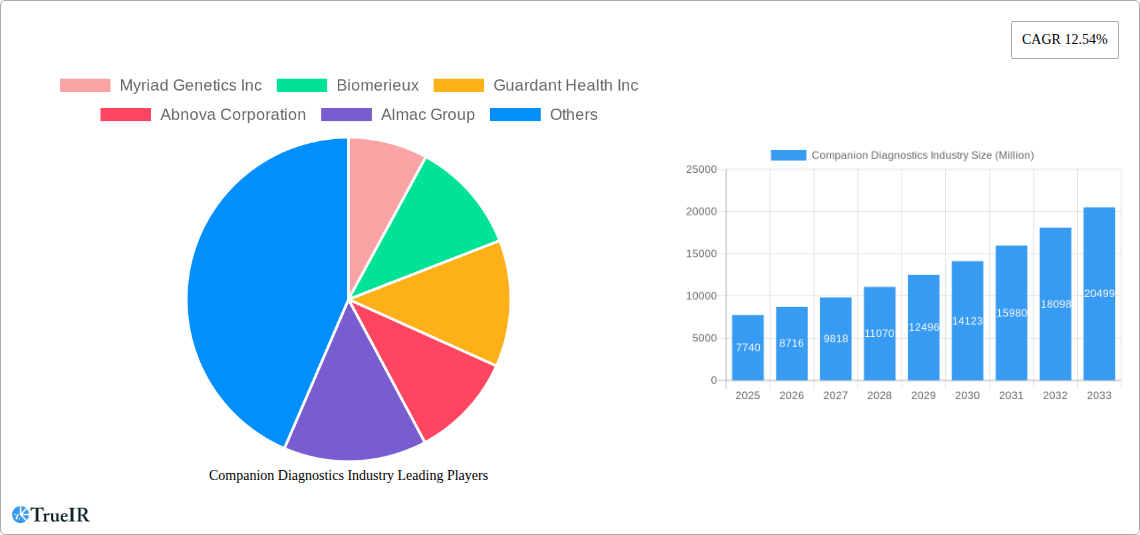
Companion Diagnostics Industry Market Size (In Billion)
Market segmentation reveals significant opportunities within specific areas. Cancer indications like lung, breast, and colorectal cancer represent substantial market segments due to high prevalence and ongoing therapeutic advancements. Technological segments such as PCR, IHC, and gene sequencing are also witnessing significant growth, reflecting the diverse applications and technological preferences within the field. Geographically, North America currently holds a leading market share due to high healthcare expenditure and advanced healthcare infrastructure. However, rapid growth is anticipated in the Asia-Pacific region, fueled by rising healthcare awareness, increased disposable incomes, and growing adoption of advanced diagnostic techniques in emerging economies like India and China. The competitive landscape is dynamic, with major players like Thermo Fisher Scientific, Roche, and Illumina leading the innovation and market penetration, alongside other significant contributors focusing on specific niche areas within the companion diagnostics spectrum. The future of the companion diagnostics market is bright, poised for continued growth driven by technological innovation, rising disease prevalence, and the increasing adoption of personalized medicine globally.
Companion Diagnostics Industry Company Market Share
Companion Diagnostics Industry Market Report: 2019-2033
This comprehensive report provides a detailed analysis of the Companion Diagnostics industry, offering invaluable insights into market trends, competitive landscapes, and future growth prospects. With a study period spanning 2019-2033, a base year of 2025, and a forecast period of 2025-2033, this report is an essential resource for industry stakeholders, investors, and researchers. The market is valued at XX Million in 2025 and is projected to reach XX Million by 2033, exhibiting a CAGR of XX%.
Companion Diagnostics Industry Market Structure & Competitive Landscape
The companion diagnostics market is characterized by a moderately concentrated landscape, with several multinational corporations holding significant market share. Key players such as Myriad Genetics Inc, Biomerieux, Guardant Health Inc, Abnova Corporation, Almac Group, Thermo Fisher Scientific Inc, F Hoffmann-La Roche Ltd, Siemens Healthineers AG, Agilent Technologies Inc, Abbott, Qiagen NV, Sysmex Corporation, Illumina Inc, Biogenex Laboratories Inc, and Danaher Corporation (Beckman Coulter Inc) drive innovation and competition. The Herfindahl-Hirschman Index (HHI) is estimated at XX, indicating a moderately concentrated market.
Several factors influence market dynamics:
- Innovation Drivers: Continuous advancements in gene sequencing, PCR technologies, and AI-powered pathology are key drivers of innovation, leading to more accurate and personalized diagnostics.
- Regulatory Impacts: Stringent regulatory approvals and compliance requirements influence market entry and product development strategies. CE Mark approvals and FDA clearances significantly impact market access.
- Product Substitutes: The absence of direct substitutes strengthens the market's position, though advancements in alternative diagnostic approaches might present future competition.
- End-User Segmentation: The market is segmented by hospitals, clinical laboratories, research institutions, and pharmaceutical companies.
- M&A Trends: The market has witnessed several mergers and acquisitions in recent years, indicating consolidation and strategic expansion efforts. The total M&A volume between 2019 and 2024 is estimated at XX Million.
Companion Diagnostics Industry Market Trends & Opportunities
The companion diagnostics market is experiencing robust growth, driven by several key factors. The increasing prevalence of chronic diseases, rising demand for personalized medicine, technological advancements in molecular diagnostics, and favorable regulatory landscapes are key contributors to market expansion. The market size witnessed significant growth from XX Million in 2019 to XX Million in 2024, representing a substantial increase. The projected CAGR of XX% during the forecast period (2025-2033) indicates continued strong market momentum. This growth is fueled by several factors:
- Technological Advancements: The integration of AI and machine learning in digital pathology is revolutionizing diagnostic accuracy and efficiency. Next-generation sequencing (NGS) is expanding diagnostic capabilities, while advancements in PCR techniques are improving diagnostic sensitivity and speed.
- Rising Demand for Personalized Medicine: The increasing focus on targeted therapies necessitates companion diagnostics to ensure the selection of appropriate treatment based on individual patient characteristics.
- Growing Prevalence of Cancer: The increasing incidence of various cancers, particularly lung, breast, colorectal, and leukemia, is a significant driver of market growth due to the strong linkage between companion diagnostics and cancer treatment.
- Expanding Healthcare Infrastructure: Investments in healthcare infrastructure, especially in emerging economies, are improving access to diagnostic services and boosting market growth.
Dominant Markets & Segments in Companion Diagnostics Industry
The North American region currently holds the largest market share, driven by high healthcare expenditure, advanced technological infrastructure, and strong regulatory support. However, the Asia-Pacific region is expected to exhibit the highest growth rate during the forecast period, fuelled by rapid economic development, rising healthcare expenditure, and increasing prevalence of chronic diseases.
By Technology:
- Immunohistochemistry (IHC): IHC remains a dominant technology, with consistent demand driven by its established role in cancer diagnostics.
- Polymerase Chain Reaction (PCR): PCR technology continues to be widely used due to its accuracy, speed, and cost-effectiveness.
- Gene Sequencing: The adoption of NGS is rapidly increasing, creating new opportunities for more comprehensive and personalized diagnostics.
- Real-time PCR (RT-PCR): RT-PCR is a crucial tool for detecting various infectious diseases and monitoring treatment effectiveness.
By Indication:
- Lung Cancer: Lung cancer remains a major driver due to its high prevalence and the increasing use of targeted therapies requiring companion diagnostics.
- Breast Cancer: Breast cancer diagnosis and treatment heavily rely on companion diagnostics, resulting in significant market demand.
- Colorectal Cancer: The use of companion diagnostics in colorectal cancer is expanding rapidly, contributing to significant market growth.
Key Growth Drivers: Investments in research and development, increasing government funding for healthcare initiatives, and collaborations between pharmaceutical and diagnostic companies are essential drivers for this segment growth.
Companion Diagnostics Industry Product Analysis
The companion diagnostics market showcases a range of products, including assays, kits, and instruments for various technologies (IHC, PCR, ISH, RT-PCR, gene sequencing). These products are designed to identify specific biomarkers that predict response to particular therapies, enabling personalized treatment decisions. Key competitive advantages include high accuracy, sensitivity, speed, ease of use, and cost-effectiveness. The market is witnessing the emergence of integrated platforms that combine multiple diagnostic technologies to provide comprehensive diagnostic solutions.
Key Drivers, Barriers & Challenges in Companion Diagnostics Industry
Key Drivers: The rising prevalence of chronic diseases, the increasing adoption of targeted therapies, technological advancements, and regulatory support are key drivers, creating demand for accurate and efficient diagnostics. The growing focus on personalized medicine and the development of novel targeted therapies will further fuel market growth.
Key Challenges: Regulatory hurdles, high development costs, reimbursement challenges, and competition from other diagnostic techniques present significant barriers. The complexities of regulatory approvals and the need for robust clinical validation can impede market entry and expansion. Supply chain disruptions due to raw material shortages can also pose challenges, particularly for companies dependent on specific reagents and components.
Growth Drivers in the Companion Diagnostics Industry Market
The expanding adoption of personalized medicine, alongside technological advancements such as AI-powered diagnostics and NGS, is a primary driver. Government funding and supportive regulatory policies play a crucial role in stimulating market expansion. The rising incidence of cancer and chronic diseases, along with the increase in healthcare spending worldwide, provides a significant market opportunity.
Challenges Impacting Companion Diagnostics Industry Growth
High development and validation costs, alongside stringent regulatory hurdles and the complexities of reimbursement, act as significant barriers. Competition from alternative diagnostic technologies and potential supply chain disruptions due to geopolitical factors or raw material shortages can impact market growth.
Key Players Shaping the Companion Diagnostics Industry Market
- Myriad Genetics Inc
- Biomerieux
- Guardant Health Inc
- Abnova Corporation
- Almac Group
- Thermo Fisher Scientific Inc
- F Hoffmann-La Roche Ltd
- Siemens Healthineers AG
- Agilent Technologies Inc
- Abbott
- Qiagen NV
- Sysmex Corporation
- Illumina Inc
- Biogenex Laboratories Inc
- Danaher Corporation (Beckman Coulter Inc)
Significant Companion Diagnostics Industry Industry Milestones
- April 2024: Roche received CE Mark approval for the VENTANA HER2 (4B5) Rabbit Monoclonal Primary Antibody RxDx, expanding treatment options for metastatic breast cancer patients.
- April 2024: Transcenta Holding Limited and Agilent Technologies collaborated on developing a Claudin18.2 companion diagnostic, supporting a pivotal Phase III trial for gastric cancer treatment.
- February 2024: Roche partnered with PathAI to develop AI-enabled digital pathology algorithms for companion diagnostics, enhancing diagnostic accuracy and efficiency.
Future Outlook for Companion Diagnostics Industry Market
The companion diagnostics market is poised for continued strong growth, driven by ongoing technological innovation, increasing demand for personalized medicine, and favorable regulatory environments. Strategic partnerships and collaborations among pharmaceutical companies and diagnostic manufacturers are expected to accelerate product development and market penetration. The market is anticipated to experience substantial expansion, creating significant opportunities for industry players.
Companion Diagnostics Industry Segmentation
-
1. Technology
- 1.1. Immunohistochemistry (IHC)
- 1.2. Polymerase Chain Reaction (PCR)
- 1.3. In-situ Hybridization (ISH)
- 1.4. Real-time PCR (RT-PCR)
- 1.5. Gene Sequencing
- 1.6. Other Technologies
-
2. Indication
- 2.1. Lung Cancer
- 2.2. Breast Cancer
- 2.3. Colorectal Cancer
- 2.4. Leukemia
- 2.5. Melanoma
- 2.6. Other Indications
Companion Diagnostics Industry Segmentation By Geography
-
1. North America
- 1.1. United States
- 1.2. Canada
- 1.3. Mexico
-
2. Europe
- 2.1. Germany
- 2.2. United Kingdom
- 2.3. France
- 2.4. Italy
- 2.5. Spain
- 2.6. Rest of Europe
-
3. Asia Pacific
- 3.1. China
- 3.2. Japan
- 3.3. India
- 3.4. Australia
- 3.5. South Korea
- 3.6. Rest of Asia Pacific
-
4. Middle East and Africa
- 4.1. GCC
- 4.2. South Africa
- 4.3. Rest of Middle East and Africa
-
5. South America
- 5.1. Brazil
- 5.2. Argentina
- 5.3. Rest of South America
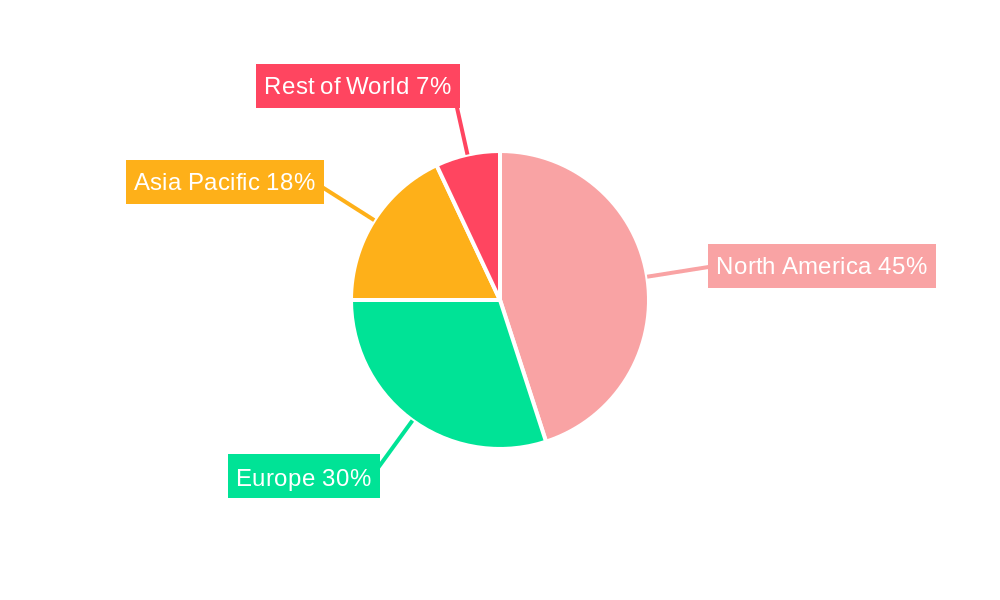
Companion Diagnostics Industry Regional Market Share
Geographic Coverage of Companion Diagnostics Industry
Companion Diagnostics Industry REPORT HIGHLIGHTS
| Aspects | Details |
|---|---|
| Study Period | 2020-2034 |
| Base Year | 2025 |
| Estimated Year | 2026 |
| Forecast Period | 2026-2034 |
| Historical Period | 2020-2025 |
| Growth Rate | CAGR of 12.54% from 2020-2034 |
| Segmentation |
|
Table of Contents
- 1. Introduction
- 1.1. Research Scope
- 1.2. Market Segmentation
- 1.3. Research Objective
- 1.4. Definitions and Assumptions
- 2. Executive Summary
- 2.1. Market Snapshot
- 3. Market Dynamics
- 3.1. Market Drivers
- 3.2. Market Restrains
- 3.3. Market Trends
- 3.4. Market Opportunities
- 4. Market Factor Analysis
- 4.1. Porters Five Forces
- 4.1.1. Bargaining Power of Suppliers
- 4.1.2. Bargaining Power of Buyers
- 4.1.3. Threat of New Entrants
- 4.1.4. Threat of Substitutes
- 4.1.5. Competitive Rivalry
- 4.2. PESTEL analysis
- 4.3. BCG Analysis
- 4.3.1. Stars (High Growth, High Market Share)
- 4.3.2. Cash Cows (Low Growth, High Market Share)
- 4.3.3. Question Mark (High Growth, Low Market Share)
- 4.3.4. Dogs (Low Growth, Low Market Share)
- 4.4. Ansoff Matrix Analysis
- 4.5. Supply Chain Analysis
- 4.6. Regulatory Landscape
- 4.7. Current Market Potential and Opportunity Assessment (TAM–SAM–SOM Framework)
- 4.8. TIR Analyst Note
- 4.1. Porters Five Forces
- 5. Market Analysis, Insights and Forecast 2021-2033
- 5.1. Market Analysis, Insights and Forecast - by Technology
- 5.1.1. Immunohistochemistry (IHC)
- 5.1.2. Polymerase Chain Reaction (PCR)
- 5.1.3. In-situ Hybridization (ISH)
- 5.1.4. Real-time PCR (RT-PCR)
- 5.1.5. Gene Sequencing
- 5.1.6. Other Technologies
- 5.2. Market Analysis, Insights and Forecast - by Indication
- 5.2.1. Lung Cancer
- 5.2.2. Breast Cancer
- 5.2.3. Colorectal Cancer
- 5.2.4. Leukemia
- 5.2.5. Melanoma
- 5.2.6. Other Indications
- 5.3. Market Analysis, Insights and Forecast - by Region
- 5.3.1. North America
- 5.3.2. Europe
- 5.3.3. Asia Pacific
- 5.3.4. Middle East and Africa
- 5.3.5. South America
- 5.1. Market Analysis, Insights and Forecast - by Technology
- 6. Global Companion Diagnostics Industry Analysis, Insights and Forecast, 2021-2033
- 6.1. Market Analysis, Insights and Forecast - by Technology
- 6.1.1. Immunohistochemistry (IHC)
- 6.1.2. Polymerase Chain Reaction (PCR)
- 6.1.3. In-situ Hybridization (ISH)
- 6.1.4. Real-time PCR (RT-PCR)
- 6.1.5. Gene Sequencing
- 6.1.6. Other Technologies
- 6.2. Market Analysis, Insights and Forecast - by Indication
- 6.2.1. Lung Cancer
- 6.2.2. Breast Cancer
- 6.2.3. Colorectal Cancer
- 6.2.4. Leukemia
- 6.2.5. Melanoma
- 6.2.6. Other Indications
- 6.1. Market Analysis, Insights and Forecast - by Technology
- 7. North America Companion Diagnostics Industry Analysis, Insights and Forecast, 2020-2032
- 7.1. Market Analysis, Insights and Forecast - by Technology
- 7.1.1. Immunohistochemistry (IHC)
- 7.1.2. Polymerase Chain Reaction (PCR)
- 7.1.3. In-situ Hybridization (ISH)
- 7.1.4. Real-time PCR (RT-PCR)
- 7.1.5. Gene Sequencing
- 7.1.6. Other Technologies
- 7.2. Market Analysis, Insights and Forecast - by Indication
- 7.2.1. Lung Cancer
- 7.2.2. Breast Cancer
- 7.2.3. Colorectal Cancer
- 7.2.4. Leukemia
- 7.2.5. Melanoma
- 7.2.6. Other Indications
- 7.1. Market Analysis, Insights and Forecast - by Technology
- 8. Europe Companion Diagnostics Industry Analysis, Insights and Forecast, 2020-2032
- 8.1. Market Analysis, Insights and Forecast - by Technology
- 8.1.1. Immunohistochemistry (IHC)
- 8.1.2. Polymerase Chain Reaction (PCR)
- 8.1.3. In-situ Hybridization (ISH)
- 8.1.4. Real-time PCR (RT-PCR)
- 8.1.5. Gene Sequencing
- 8.1.6. Other Technologies
- 8.2. Market Analysis, Insights and Forecast - by Indication
- 8.2.1. Lung Cancer
- 8.2.2. Breast Cancer
- 8.2.3. Colorectal Cancer
- 8.2.4. Leukemia
- 8.2.5. Melanoma
- 8.2.6. Other Indications
- 8.1. Market Analysis, Insights and Forecast - by Technology
- 9. Asia Pacific Companion Diagnostics Industry Analysis, Insights and Forecast, 2020-2032
- 9.1. Market Analysis, Insights and Forecast - by Technology
- 9.1.1. Immunohistochemistry (IHC)
- 9.1.2. Polymerase Chain Reaction (PCR)
- 9.1.3. In-situ Hybridization (ISH)
- 9.1.4. Real-time PCR (RT-PCR)
- 9.1.5. Gene Sequencing
- 9.1.6. Other Technologies
- 9.2. Market Analysis, Insights and Forecast - by Indication
- 9.2.1. Lung Cancer
- 9.2.2. Breast Cancer
- 9.2.3. Colorectal Cancer
- 9.2.4. Leukemia
- 9.2.5. Melanoma
- 9.2.6. Other Indications
- 9.1. Market Analysis, Insights and Forecast - by Technology
- 10. Middle East and Africa Companion Diagnostics Industry Analysis, Insights and Forecast, 2020-2032
- 10.1. Market Analysis, Insights and Forecast - by Technology
- 10.1.1. Immunohistochemistry (IHC)
- 10.1.2. Polymerase Chain Reaction (PCR)
- 10.1.3. In-situ Hybridization (ISH)
- 10.1.4. Real-time PCR (RT-PCR)
- 10.1.5. Gene Sequencing
- 10.1.6. Other Technologies
- 10.2. Market Analysis, Insights and Forecast - by Indication
- 10.2.1. Lung Cancer
- 10.2.2. Breast Cancer
- 10.2.3. Colorectal Cancer
- 10.2.4. Leukemia
- 10.2.5. Melanoma
- 10.2.6. Other Indications
- 10.1. Market Analysis, Insights and Forecast - by Technology
- 11. South America Companion Diagnostics Industry Analysis, Insights and Forecast, 2020-2032
- 11.1. Market Analysis, Insights and Forecast - by Technology
- 11.1.1. Immunohistochemistry (IHC)
- 11.1.2. Polymerase Chain Reaction (PCR)
- 11.1.3. In-situ Hybridization (ISH)
- 11.1.4. Real-time PCR (RT-PCR)
- 11.1.5. Gene Sequencing
- 11.1.6. Other Technologies
- 11.2. Market Analysis, Insights and Forecast - by Indication
- 11.2.1. Lung Cancer
- 11.2.2. Breast Cancer
- 11.2.3. Colorectal Cancer
- 11.2.4. Leukemia
- 11.2.5. Melanoma
- 11.2.6. Other Indications
- 11.1. Market Analysis, Insights and Forecast - by Technology
- 12. Competitive Analysis
- 12.1. Company Profiles
- 12.1.1 Myriad Genetics Inc
- 12.1.1.1. Company Overview
- 12.1.1.2. Products
- 12.1.1.3. Company Financials
- 12.1.1.4. SWOT Analysis
- 12.1.2 Biomerieux
- 12.1.2.1. Company Overview
- 12.1.2.2. Products
- 12.1.2.3. Company Financials
- 12.1.2.4. SWOT Analysis
- 12.1.3 Guardant Health Inc
- 12.1.3.1. Company Overview
- 12.1.3.2. Products
- 12.1.3.3. Company Financials
- 12.1.3.4. SWOT Analysis
- 12.1.4 Abnova Corporation
- 12.1.4.1. Company Overview
- 12.1.4.2. Products
- 12.1.4.3. Company Financials
- 12.1.4.4. SWOT Analysis
- 12.1.5 Almac Group
- 12.1.5.1. Company Overview
- 12.1.5.2. Products
- 12.1.5.3. Company Financials
- 12.1.5.4. SWOT Analysis
- 12.1.6 Thermo Fisher Scientific Inc
- 12.1.6.1. Company Overview
- 12.1.6.2. Products
- 12.1.6.3. Company Financials
- 12.1.6.4. SWOT Analysis
- 12.1.7 F Hoffmann-La Roche Ltd
- 12.1.7.1. Company Overview
- 12.1.7.2. Products
- 12.1.7.3. Company Financials
- 12.1.7.4. SWOT Analysis
- 12.1.8 Siemens Healthineers AG
- 12.1.8.1. Company Overview
- 12.1.8.2. Products
- 12.1.8.3. Company Financials
- 12.1.8.4. SWOT Analysis
- 12.1.9 Agilent Technologies Inc
- 12.1.9.1. Company Overview
- 12.1.9.2. Products
- 12.1.9.3. Company Financials
- 12.1.9.4. SWOT Analysis
- 12.1.10 Abbott
- 12.1.10.1. Company Overview
- 12.1.10.2. Products
- 12.1.10.3. Company Financials
- 12.1.10.4. SWOT Analysis
- 12.1.11 Qiagen NV
- 12.1.11.1. Company Overview
- 12.1.11.2. Products
- 12.1.11.3. Company Financials
- 12.1.11.4. SWOT Analysis
- 12.1.12 Sysmex Corporation
- 12.1.12.1. Company Overview
- 12.1.12.2. Products
- 12.1.12.3. Company Financials
- 12.1.12.4. SWOT Analysis
- 12.1.13 Illumina Inc
- 12.1.13.1. Company Overview
- 12.1.13.2. Products
- 12.1.13.3. Company Financials
- 12.1.13.4. SWOT Analysis
- 12.1.14 Biogenex Laboratories Inc *List Not Exhaustive
- 12.1.14.1. Company Overview
- 12.1.14.2. Products
- 12.1.14.3. Company Financials
- 12.1.14.4. SWOT Analysis
- 12.1.15 Danaher Corporation (Beckman Coulter Inc )
- 12.1.15.1. Company Overview
- 12.1.15.2. Products
- 12.1.15.3. Company Financials
- 12.1.15.4. SWOT Analysis
- 12.1.1 Myriad Genetics Inc
- 12.2. Market Entropy
- 12.2.1 Company's Key Areas Served
- 12.2.2 Recent Developments
- 12.3. Company Market Share Analysis 2025
- 12.3.1 Top 5 Companies Market Share Analysis
- 12.3.2 Top 3 Companies Market Share Analysis
- 12.4. List of Potential Customers
- 13. Research Methodology
List of Figures
- Figure 1: Global Companion Diagnostics Industry Revenue Breakdown (Million, %) by Region 2025 & 2033
- Figure 2: North America Companion Diagnostics Industry Revenue (Million), by Technology 2025 & 2033
- Figure 3: North America Companion Diagnostics Industry Revenue Share (%), by Technology 2025 & 2033
- Figure 4: North America Companion Diagnostics Industry Revenue (Million), by Indication 2025 & 2033
- Figure 5: North America Companion Diagnostics Industry Revenue Share (%), by Indication 2025 & 2033
- Figure 6: North America Companion Diagnostics Industry Revenue (Million), by Country 2025 & 2033
- Figure 7: North America Companion Diagnostics Industry Revenue Share (%), by Country 2025 & 2033
- Figure 8: Europe Companion Diagnostics Industry Revenue (Million), by Technology 2025 & 2033
- Figure 9: Europe Companion Diagnostics Industry Revenue Share (%), by Technology 2025 & 2033
- Figure 10: Europe Companion Diagnostics Industry Revenue (Million), by Indication 2025 & 2033
- Figure 11: Europe Companion Diagnostics Industry Revenue Share (%), by Indication 2025 & 2033
- Figure 12: Europe Companion Diagnostics Industry Revenue (Million), by Country 2025 & 2033
- Figure 13: Europe Companion Diagnostics Industry Revenue Share (%), by Country 2025 & 2033
- Figure 14: Asia Pacific Companion Diagnostics Industry Revenue (Million), by Technology 2025 & 2033
- Figure 15: Asia Pacific Companion Diagnostics Industry Revenue Share (%), by Technology 2025 & 2033
- Figure 16: Asia Pacific Companion Diagnostics Industry Revenue (Million), by Indication 2025 & 2033
- Figure 17: Asia Pacific Companion Diagnostics Industry Revenue Share (%), by Indication 2025 & 2033
- Figure 18: Asia Pacific Companion Diagnostics Industry Revenue (Million), by Country 2025 & 2033
- Figure 19: Asia Pacific Companion Diagnostics Industry Revenue Share (%), by Country 2025 & 2033
- Figure 20: Middle East and Africa Companion Diagnostics Industry Revenue (Million), by Technology 2025 & 2033
- Figure 21: Middle East and Africa Companion Diagnostics Industry Revenue Share (%), by Technology 2025 & 2033
- Figure 22: Middle East and Africa Companion Diagnostics Industry Revenue (Million), by Indication 2025 & 2033
- Figure 23: Middle East and Africa Companion Diagnostics Industry Revenue Share (%), by Indication 2025 & 2033
- Figure 24: Middle East and Africa Companion Diagnostics Industry Revenue (Million), by Country 2025 & 2033
- Figure 25: Middle East and Africa Companion Diagnostics Industry Revenue Share (%), by Country 2025 & 2033
- Figure 26: South America Companion Diagnostics Industry Revenue (Million), by Technology 2025 & 2033
- Figure 27: South America Companion Diagnostics Industry Revenue Share (%), by Technology 2025 & 2033
- Figure 28: South America Companion Diagnostics Industry Revenue (Million), by Indication 2025 & 2033
- Figure 29: South America Companion Diagnostics Industry Revenue Share (%), by Indication 2025 & 2033
- Figure 30: South America Companion Diagnostics Industry Revenue (Million), by Country 2025 & 2033
- Figure 31: South America Companion Diagnostics Industry Revenue Share (%), by Country 2025 & 2033
List of Tables
- Table 1: Global Companion Diagnostics Industry Revenue Million Forecast, by Technology 2020 & 2033
- Table 2: Global Companion Diagnostics Industry Revenue Million Forecast, by Indication 2020 & 2033
- Table 3: Global Companion Diagnostics Industry Revenue Million Forecast, by Region 2020 & 2033
- Table 4: Global Companion Diagnostics Industry Revenue Million Forecast, by Technology 2020 & 2033
- Table 5: Global Companion Diagnostics Industry Revenue Million Forecast, by Indication 2020 & 2033
- Table 6: Global Companion Diagnostics Industry Revenue Million Forecast, by Country 2020 & 2033
- Table 7: United States Companion Diagnostics Industry Revenue (Million) Forecast, by Application 2020 & 2033
- Table 8: Canada Companion Diagnostics Industry Revenue (Million) Forecast, by Application 2020 & 2033
- Table 9: Mexico Companion Diagnostics Industry Revenue (Million) Forecast, by Application 2020 & 2033
- Table 10: Global Companion Diagnostics Industry Revenue Million Forecast, by Technology 2020 & 2033
- Table 11: Global Companion Diagnostics Industry Revenue Million Forecast, by Indication 2020 & 2033
- Table 12: Global Companion Diagnostics Industry Revenue Million Forecast, by Country 2020 & 2033
- Table 13: Germany Companion Diagnostics Industry Revenue (Million) Forecast, by Application 2020 & 2033
- Table 14: United Kingdom Companion Diagnostics Industry Revenue (Million) Forecast, by Application 2020 & 2033
- Table 15: France Companion Diagnostics Industry Revenue (Million) Forecast, by Application 2020 & 2033
- Table 16: Italy Companion Diagnostics Industry Revenue (Million) Forecast, by Application 2020 & 2033
- Table 17: Spain Companion Diagnostics Industry Revenue (Million) Forecast, by Application 2020 & 2033
- Table 18: Rest of Europe Companion Diagnostics Industry Revenue (Million) Forecast, by Application 2020 & 2033
- Table 19: Global Companion Diagnostics Industry Revenue Million Forecast, by Technology 2020 & 2033
- Table 20: Global Companion Diagnostics Industry Revenue Million Forecast, by Indication 2020 & 2033
- Table 21: Global Companion Diagnostics Industry Revenue Million Forecast, by Country 2020 & 2033
- Table 22: China Companion Diagnostics Industry Revenue (Million) Forecast, by Application 2020 & 2033
- Table 23: Japan Companion Diagnostics Industry Revenue (Million) Forecast, by Application 2020 & 2033
- Table 24: India Companion Diagnostics Industry Revenue (Million) Forecast, by Application 2020 & 2033
- Table 25: Australia Companion Diagnostics Industry Revenue (Million) Forecast, by Application 2020 & 2033
- Table 26: South Korea Companion Diagnostics Industry Revenue (Million) Forecast, by Application 2020 & 2033
- Table 27: Rest of Asia Pacific Companion Diagnostics Industry Revenue (Million) Forecast, by Application 2020 & 2033
- Table 28: Global Companion Diagnostics Industry Revenue Million Forecast, by Technology 2020 & 2033
- Table 29: Global Companion Diagnostics Industry Revenue Million Forecast, by Indication 2020 & 2033
- Table 30: Global Companion Diagnostics Industry Revenue Million Forecast, by Country 2020 & 2033
- Table 31: GCC Companion Diagnostics Industry Revenue (Million) Forecast, by Application 2020 & 2033
- Table 32: South Africa Companion Diagnostics Industry Revenue (Million) Forecast, by Application 2020 & 2033
- Table 33: Rest of Middle East and Africa Companion Diagnostics Industry Revenue (Million) Forecast, by Application 2020 & 2033
- Table 34: Global Companion Diagnostics Industry Revenue Million Forecast, by Technology 2020 & 2033
- Table 35: Global Companion Diagnostics Industry Revenue Million Forecast, by Indication 2020 & 2033
- Table 36: Global Companion Diagnostics Industry Revenue Million Forecast, by Country 2020 & 2033
- Table 37: Brazil Companion Diagnostics Industry Revenue (Million) Forecast, by Application 2020 & 2033
- Table 38: Argentina Companion Diagnostics Industry Revenue (Million) Forecast, by Application 2020 & 2033
- Table 39: Rest of South America Companion Diagnostics Industry Revenue (Million) Forecast, by Application 2020 & 2033
Frequently Asked Questions
1. What is the projected Compound Annual Growth Rate (CAGR) of the Companion Diagnostics Industry?
The projected CAGR is approximately 12.54%.
2. Which companies are prominent players in the Companion Diagnostics Industry?
Key companies in the market include Myriad Genetics Inc, Biomerieux, Guardant Health Inc, Abnova Corporation, Almac Group, Thermo Fisher Scientific Inc, F Hoffmann-La Roche Ltd, Siemens Healthineers AG, Agilent Technologies Inc, Abbott, Qiagen NV, Sysmex Corporation, Illumina Inc, Biogenex Laboratories Inc *List Not Exhaustive, Danaher Corporation (Beckman Coulter Inc ).
3. What are the main segments of the Companion Diagnostics Industry?
The market segments include Technology, Indication.
4. Can you provide details about the market size?
The market size is estimated to be USD 7.74 Million as of 2022.
5. What are some drivers contributing to market growth?
Companies Promoting Personalized Medicine and Targeted Therapy as a New Treatment Option; Increasing Cases of Adverse Drug Reactions; Co-development of Drug and Diagnostic Technologies.
6. What are the notable trends driving market growth?
The Lung Cancer Segment is Expected to Witness Significant Growth Over the Forecast Period.
7. Are there any restraints impacting market growth?
High Cost of Drug Development and Associated Clinical Trials; Reimbursement Issues Among Many Countries.
8. Can you provide examples of recent developments in the market?
April 2024: Roche received approval of the CE Mark for the VENTANA HER2 (4B5) Rabbit Monoclonal Primary Antibody RxDx to identify metastatic breast cancer patients with low HER2 expression who can be given ENHERTU (trastuzumab deruxtecan) as a targeted treatment.
9. What pricing options are available for accessing the report?
Pricing options include single-user, multi-user, and enterprise licenses priced at USD 4750, USD 5250, and USD 8750 respectively.
10. Is the market size provided in terms of value or volume?
The market size is provided in terms of value, measured in Million.
11. Are there any specific market keywords associated with the report?
Yes, the market keyword associated with the report is "Companion Diagnostics Industry," which aids in identifying and referencing the specific market segment covered.
12. How do I determine which pricing option suits my needs best?
The pricing options vary based on user requirements and access needs. Individual users may opt for single-user licenses, while businesses requiring broader access may choose multi-user or enterprise licenses for cost-effective access to the report.
13. Are there any additional resources or data provided in the Companion Diagnostics Industry report?
While the report offers comprehensive insights, it's advisable to review the specific contents or supplementary materials provided to ascertain if additional resources or data are available.
14. How can I stay updated on further developments or reports in the Companion Diagnostics Industry?
To stay informed about further developments, trends, and reports in the Companion Diagnostics Industry, consider subscribing to industry newsletters, following relevant companies and organizations, or regularly checking reputable industry news sources and publications.
Methodology
Step 1 - Identification of Relevant Samples Size from Population Database


Step 2 - Approaches for Defining Global Market Size (Value, Volume* & Price*)

Note*: In applicable scenarios
Step 3 - Data Sources
Primary Research
- Web Analytics
- Survey Reports
- Research Institute
- Latest Research Reports
- Opinion Leaders
Secondary Research
- Annual Reports
- White Paper
- Latest Press Release
- Industry Association
- Paid Database
- Investor Presentations

Step 4 - Data Triangulation
Involves using different sources of information in order to increase the validity of a study
These sources are likely to be stakeholders in a program - participants, other researchers, program staff, other community members, and so on.
Then we put all data in single framework & apply various statistical tools to find out the dynamic on the market.
During the analysis stage, feedback from the stakeholder groups would be compared to determine areas of agreement as well as areas of divergence