

Key Insights
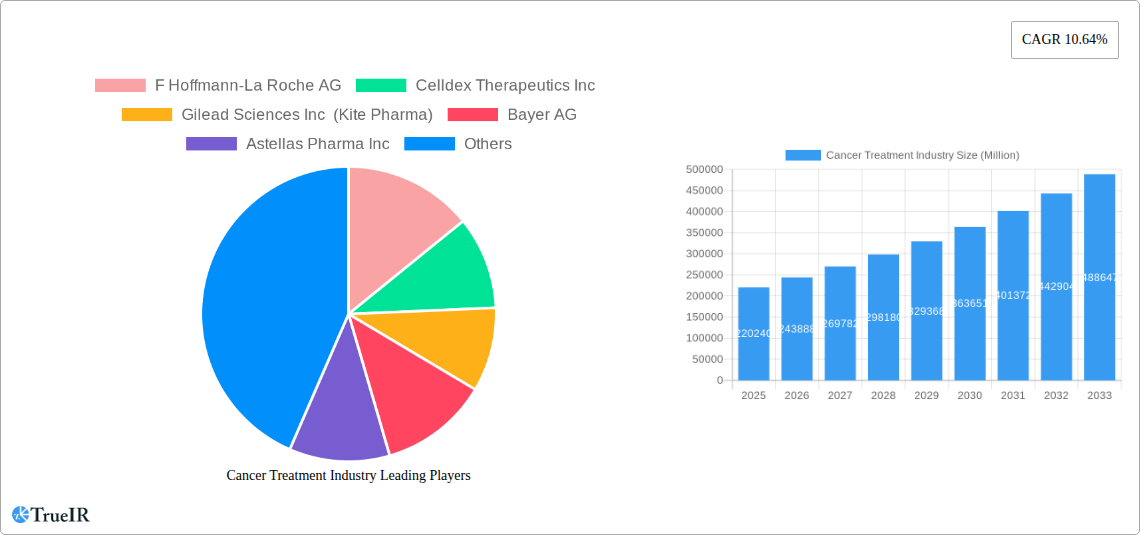
The global cancer treatment market, valued at $220.24 billion in 2025, is projected to experience robust growth, driven by several key factors. Rising cancer incidence rates worldwide, coupled with an aging population, significantly contribute to increased demand for cancer therapies. Advancements in treatment modalities, including targeted therapies, immunotherapies, and innovative drug delivery systems, are revolutionizing cancer care and fueling market expansion. The development of personalized medicine approaches, tailored to individual patient genetics and tumor characteristics, further enhances treatment efficacy and market growth. Significant investments in research and development by pharmaceutical companies are leading to the approval and launch of novel cancer drugs, expanding treatment options and driving market value. However, the high cost of advanced therapies poses a significant challenge, particularly in low- and middle-income countries, potentially limiting access for a substantial portion of the population. Furthermore, the development of drug resistance and the emergence of new cancer types present ongoing hurdles for the industry.
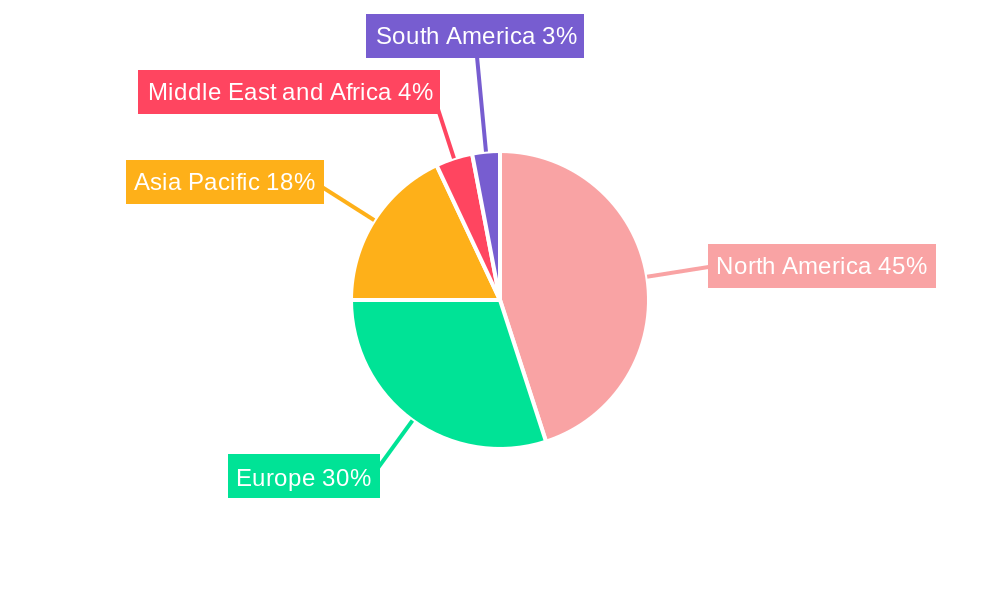
Segmentation analysis reveals that chemotherapy remains a dominant therapy type, although immunotherapy and targeted therapies are witnessing rapid growth due to their improved efficacy and reduced side effects. Breast cancer, lung cancer, and blood cancers constitute significant portions of the market, reflecting their high prevalence. Hospitals and specialty clinics are the primary end-users, although the role of cancer and radiation therapy centers is expanding. Geographically, North America currently holds a substantial market share due to high healthcare expenditure and advanced healthcare infrastructure. However, the Asia-Pacific region is expected to exhibit the fastest growth rate due to rising cancer incidence, increasing healthcare spending, and a growing awareness of advanced treatment options. This growth will be fueled by expanding healthcare infrastructure and increasing affordability of treatments in key markets like China and India. The forecast period (2025-2033) anticipates continued expansion, with the market expected to be significantly larger by 2033, driven by ongoing innovation and increasing global healthcare investment.
Cancer Treatment Industry Market Report: 2019-2033
This comprehensive report provides a detailed analysis of the global cancer treatment industry, offering invaluable insights for stakeholders, investors, and industry professionals. With a focus on market size, growth drivers, competitive landscape, and future projections, this report covers the period from 2019 to 2033, with a base year of 2025. The market is segmented by therapy type, cancer type, and end-user, providing granular data for strategic decision-making. The report projects a market size of $XX Million by 2033.
Cancer Treatment Industry Market Structure & Competitive Landscape
The global cancer treatment market is characterized by a moderately concentrated structure, with a few large multinational pharmaceutical companies holding significant market share. Key players such as F Hoffmann-La Roche AG, Novartis AG, Merck & Co Inc, and Bristol Myers Squibb Company dominate the landscape through robust R&D, extensive product portfolios, and strategic acquisitions. The Herfindahl-Hirschman Index (HHI) for this market is estimated at XX, indicating a moderately concentrated market.
Innovation Drivers: Continuous advancements in immunotherapy, targeted therapy, and personalized medicine are driving significant growth. The development of novel drug delivery systems and combination therapies further enhances the market's potential.
Regulatory Impacts: Stringent regulatory approvals and pricing policies influence market access and profitability for pharmaceutical companies. The increasing emphasis on real-world evidence and post-market surveillance adds to the regulatory complexity.
Product Substitutes: The presence of alternative treatment modalities, including surgery, radiation therapy, and traditional medicine, presents some level of substitution, although these often complement rather than replace drug-based treatments.
End-User Segmentation: The market is largely driven by hospitals and specialty cancer centers, but clinics and radiation therapy centers also contribute significantly. The increasing prevalence of cancer and growing preference for advanced treatments fuels demand across all segments.
M&A Trends: The industry witnesses consistent mergers and acquisitions activity, with major pharmaceutical companies strategically acquiring smaller biotech firms to expand their product pipelines and technological capabilities. The total value of M&A transactions in the cancer treatment industry between 2019 and 2024 is estimated at $XX Million.
Cancer Treatment Industry Market Trends & Opportunities
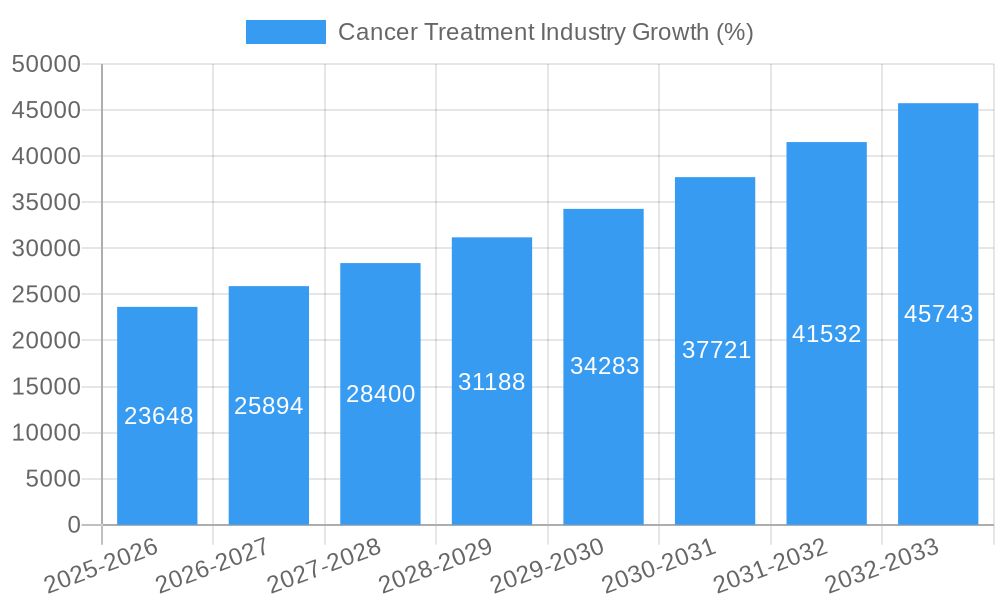
The global cancer treatment market exhibits robust growth, fueled by several key trends. The market size reached $XX Million in 2024 and is projected to reach $XX Million by 2033, representing a Compound Annual Growth Rate (CAGR) of XX% during the forecast period (2025-2033). This growth is driven by several factors, including the rising prevalence of cancer globally, an aging population, increased healthcare expenditure, and advancements in cancer treatment technologies.
Technological advancements, such as the development of next-generation sequencing technologies for personalized medicine, artificial intelligence for drug discovery, and improved imaging techniques for early detection, are transforming the treatment landscape. This leads to improved treatment efficacy, reduced side effects, and increased patient survival rates. The adoption of these technologies is expected to continue growing, enhancing market penetration rates across all segments.
Consumer preferences are shifting towards minimally invasive procedures, targeted therapies, and personalized treatments that offer better quality of life. This trend fuels innovation and demand for advanced treatment options.
Competitive dynamics remain intense, with established pharmaceutical giants and emerging biotech companies vying for market share through continuous innovation and strategic partnerships. The entry of new players with innovative therapies is expected to further intensify competition.
Dominant Markets & Segments in Cancer Treatment Industry
The North American market currently dominates the global cancer treatment landscape, driven by high healthcare expenditure, advanced healthcare infrastructure, and a large patient pool. Within North America, the United States is the largest market. Europe follows as the second-largest market, with significant contributions from countries like Germany, France, and the UK. Asia-Pacific is witnessing rapid growth driven by increasing cancer incidence and rising disposable incomes.
Key Growth Drivers by Segment:
- Therapy Type: Immunotherapy is a rapidly growing segment, driven by its high efficacy and improved safety profiles. Targeted therapy also shows significant growth potential due to its ability to selectively target cancer cells, minimizing damage to healthy tissues.
- Cancer Type: Blood cancers (leukemias, lymphomas) and breast cancer are currently the leading segments in terms of treatment expenditure. The rising incidence of lung and gastrointestinal cancers also fuels significant market growth in these segments.
- End User: Hospitals and specialty cancer centers account for a significant portion of the market share due to their advanced infrastructure and specialized expertise in cancer care.
Market Dominance Analysis: The dominance of North America is attributed to its advanced healthcare infrastructure, high healthcare expenditure, and robust regulatory environment that supports the introduction of new therapies. The significant advancements in research and development within the region have also contributed to this market leadership.
Cancer Treatment Industry Product Analysis
The cancer treatment industry is witnessing rapid product innovation, characterized by the development of highly targeted therapies, including immunotherapies, monoclonal antibodies, and antibody-drug conjugates. These products offer improved efficacy, reduced side effects, and personalized treatment options. Technological advancements in drug delivery systems, such as liposomal formulations and nanotechnology-based drug delivery, further enhance the effectiveness and safety of existing therapies. The market is characterized by a diverse range of products catering to different cancer types and treatment stages, which ensures a good market fit for diverse patient needs.
Key Drivers, Barriers & Challenges in Cancer Treatment Industry
Key Drivers:
- Technological Advancements: Continuous innovation in immunotherapy, targeted therapy, and personalized medicine is driving market growth.
- Rising Cancer Prevalence: The increasing incidence of various cancer types worldwide fuels demand for advanced treatments.
- Favorable Regulatory Environment: Government support for research and development and streamlined regulatory pathways for new drug approvals accelerate market expansion.
Key Barriers and Challenges:
- High Treatment Costs: The exorbitant cost of innovative cancer therapies limits access for a significant portion of the global population, particularly in low- and middle-income countries. The impact is a reduction in market penetration by XX%.
- Regulatory Hurdles: Stringent regulatory requirements and lengthy approval processes pose significant challenges for bringing new treatments to the market. This delays market entry and increases the overall cost of development.
- Competitive Pressure: Intense competition among major pharmaceutical companies and emerging biotech firms necessitates continuous innovation and investment in R&D to maintain market share.
Growth Drivers in the Cancer Treatment Industry Market
The cancer treatment market is propelled by advancements in immunotherapy, targeted therapies, and personalized medicine. Rising cancer prevalence globally, increased healthcare expenditure, and supportive regulatory frameworks also significantly contribute to market growth. Furthermore, technological innovations in drug delivery and diagnostics further enhance treatment effectiveness and efficiency.
Challenges Impacting Cancer Treatment Industry Growth
High treatment costs limit access for many patients, acting as a major restraint. Complex regulatory processes and lengthy approvals slow market entry for new treatments. Intense competition among established and emerging players increases pressure on pricing and profit margins. Supply chain disruptions also represent a potential challenge to the industry.
Key Players Shaping the Cancer Treatment Industry Market
- F Hoffmann-La Roche AG
- Celldex Therapeutics Inc
- Gilead Sciences Inc (Kite Pharma)
- Bayer AG
- Astellas Pharma Inc
- Novartis AG
- Amgen Inc
- Merck & Co Inc
- Takeda Pharmaceutical Company Limited
- AstraZeneca
- Abbvie Inc
- GSK PLC
- Lilly
- Bristol Myers Squibb Company
- Johnson & Johnson Services Inc
- Alaunos Therapeutics Inc
- Pfizer Inc
Significant Cancer Treatment Industry Milestones
- May 2023: Genmab A/S receives USFDA approval for EPKINLY (epcoritamab-bysp) for R/R diffuse large B-cell lymphoma.
- April 2023: Genentech (Roche Group) receives USFDA approval for Polivy (polatuzumab vedotin-piiq) in combination with R-CHP for previously untreated diffuse large B-cell lymphoma.
- April 2023: Gamida Cell Ltd receives USFDA approval for Omisirge (omidubicel-onlv) for hematologic malignancies in adult and pediatric patients (12+ years).
Future Outlook for Cancer Treatment Industry Market
The cancer treatment market is poised for continued robust growth, driven by ongoing innovation in targeted therapies, immunotherapies, and personalized medicine. Strategic partnerships, collaborations, and acquisitions will further shape the competitive landscape. The increasing focus on early detection and prevention, along with improved healthcare infrastructure in emerging markets, presents significant opportunities for market expansion. The development of novel combination therapies and advanced drug delivery systems will further enhance treatment efficacy and improve patient outcomes, fueling future market growth.
Cancer Treatment Industry Segmentation
-
1. Therapy Type
- 1.1. Chemotherapy
- 1.2. Targeted Therapy
- 1.3. Immunotherapy
- 1.4. Hormonal Therapy
- 1.5. Other Treatment Types
-
2. Cancer Type
- 2.1. Blood Cancer
- 2.2. Breast Cancer
- 2.3. Prostate Cancer
- 2.4. Gastrointestinal Cancer
- 2.5. Gynaecologic Cancer
- 2.6. Respiratory/Lung Cancer
- 2.7. Other Cancer Types
-
3. End User
- 3.1. Hospitals
- 3.2. Specialty Clinics
- 3.3. Cancer and Radiation Therapy Centers
Cancer Treatment Industry Segmentation By Geography
-
1. North America
- 1.1. United States
- 1.2. Canada
- 1.3. Mexico
-
2. Europe
- 2.1. Germany
- 2.2. United Kingdom
- 2.3. France
- 2.4. Italy
- 2.5. Spain
- 2.6. Rest of Europe
-
3. Asia Pacific
- 3.1. China
- 3.2. Japan
- 3.3. India
- 3.4. Australia
- 3.5. South Korea
- 3.6. Rest of Asia Pacific
-
4. Middle East and Africa
- 4.1. GCC
- 4.2. South Africa
- 4.3. Rest of Middle East and Africa
-
5. South America
- 5.1. Brazil
- 5.2. Argentina
- 5.3. Rest of South America
Cancer Treatment Industry REPORT HIGHLIGHTS
| Aspects | Details |
|---|---|
| Study Period | 2019-2033 |
| Base Year | 2024 |
| Estimated Year | 2025 |
| Forecast Period | 2025-2033 |
| Historical Period | 2019-2024 |
| Growth Rate | CAGR of 10.64% from 2019-2033 |
| Segmentation |
|
Table of Contents
- 1. Introduction
- 1.1. Research Scope
- 1.2. Market Segmentation
- 1.3. Research Methodology
- 1.4. Definitions and Assumptions
- 2. Executive Summary
- 2.1. Introduction
- 3. Market Dynamics
- 3.1. Introduction
- 3.2. Market Drivers
- 3.2.1. Increasing Patient Assistance Programs (PAPs) and Rising Demand for Personalized Medicine; Growing Government Initiatives for Cancer Awareness; Rising Prevalence of Cancer Worldwide; Strong R&D Initiatives from Key Players
- 3.3. Market Restrains
- 3.3.1. Fluctuation in Reimbursement Policies; High Cost of Cancer Therapies
- 3.4. Market Trends
- 3.4.1. The Targeted Therapy Segment is Expected to Witness Significant Growth during the the Forecast Period
- 4. Market Factor Analysis
- 4.1. Porters Five Forces
- 4.2. Supply/Value Chain
- 4.3. PESTEL analysis
- 4.4. Market Entropy
- 4.5. Patent/Trademark Analysis
- 5. Global Cancer Treatment Industry Analysis, Insights and Forecast, 2019-2031
- 5.1. Market Analysis, Insights and Forecast - by Therapy Type
- 5.1.1. Chemotherapy
- 5.1.2. Targeted Therapy
- 5.1.3. Immunotherapy
- 5.1.4. Hormonal Therapy
- 5.1.5. Other Treatment Types
- 5.2. Market Analysis, Insights and Forecast - by Cancer Type
- 5.2.1. Blood Cancer
- 5.2.2. Breast Cancer
- 5.2.3. Prostate Cancer
- 5.2.4. Gastrointestinal Cancer
- 5.2.5. Gynaecologic Cancer
- 5.2.6. Respiratory/Lung Cancer
- 5.2.7. Other Cancer Types
- 5.3. Market Analysis, Insights and Forecast - by End User
- 5.3.1. Hospitals
- 5.3.2. Specialty Clinics
- 5.3.3. Cancer and Radiation Therapy Centers
- 5.4. Market Analysis, Insights and Forecast - by Region
- 5.4.1. North America
- 5.4.2. Europe
- 5.4.3. Asia Pacific
- 5.4.4. Middle East and Africa
- 5.4.5. South America
- 5.1. Market Analysis, Insights and Forecast - by Therapy Type
- 6. North America Cancer Treatment Industry Analysis, Insights and Forecast, 2019-2031
- 6.1. Market Analysis, Insights and Forecast - by Therapy Type
- 6.1.1. Chemotherapy
- 6.1.2. Targeted Therapy
- 6.1.3. Immunotherapy
- 6.1.4. Hormonal Therapy
- 6.1.5. Other Treatment Types
- 6.2. Market Analysis, Insights and Forecast - by Cancer Type
- 6.2.1. Blood Cancer
- 6.2.2. Breast Cancer
- 6.2.3. Prostate Cancer
- 6.2.4. Gastrointestinal Cancer
- 6.2.5. Gynaecologic Cancer
- 6.2.6. Respiratory/Lung Cancer
- 6.2.7. Other Cancer Types
- 6.3. Market Analysis, Insights and Forecast - by End User
- 6.3.1. Hospitals
- 6.3.2. Specialty Clinics
- 6.3.3. Cancer and Radiation Therapy Centers
- 6.1. Market Analysis, Insights and Forecast - by Therapy Type
- 7. Europe Cancer Treatment Industry Analysis, Insights and Forecast, 2019-2031
- 7.1. Market Analysis, Insights and Forecast - by Therapy Type
- 7.1.1. Chemotherapy
- 7.1.2. Targeted Therapy
- 7.1.3. Immunotherapy
- 7.1.4. Hormonal Therapy
- 7.1.5. Other Treatment Types
- 7.2. Market Analysis, Insights and Forecast - by Cancer Type
- 7.2.1. Blood Cancer
- 7.2.2. Breast Cancer
- 7.2.3. Prostate Cancer
- 7.2.4. Gastrointestinal Cancer
- 7.2.5. Gynaecologic Cancer
- 7.2.6. Respiratory/Lung Cancer
- 7.2.7. Other Cancer Types
- 7.3. Market Analysis, Insights and Forecast - by End User
- 7.3.1. Hospitals
- 7.3.2. Specialty Clinics
- 7.3.3. Cancer and Radiation Therapy Centers
- 7.1. Market Analysis, Insights and Forecast - by Therapy Type
- 8. Asia Pacific Cancer Treatment Industry Analysis, Insights and Forecast, 2019-2031
- 8.1. Market Analysis, Insights and Forecast - by Therapy Type
- 8.1.1. Chemotherapy
- 8.1.2. Targeted Therapy
- 8.1.3. Immunotherapy
- 8.1.4. Hormonal Therapy
- 8.1.5. Other Treatment Types
- 8.2. Market Analysis, Insights and Forecast - by Cancer Type
- 8.2.1. Blood Cancer
- 8.2.2. Breast Cancer
- 8.2.3. Prostate Cancer
- 8.2.4. Gastrointestinal Cancer
- 8.2.5. Gynaecologic Cancer
- 8.2.6. Respiratory/Lung Cancer
- 8.2.7. Other Cancer Types
- 8.3. Market Analysis, Insights and Forecast - by End User
- 8.3.1. Hospitals
- 8.3.2. Specialty Clinics
- 8.3.3. Cancer and Radiation Therapy Centers
- 8.1. Market Analysis, Insights and Forecast - by Therapy Type
- 9. Middle East and Africa Cancer Treatment Industry Analysis, Insights and Forecast, 2019-2031
- 9.1. Market Analysis, Insights and Forecast - by Therapy Type
- 9.1.1. Chemotherapy
- 9.1.2. Targeted Therapy
- 9.1.3. Immunotherapy
- 9.1.4. Hormonal Therapy
- 9.1.5. Other Treatment Types
- 9.2. Market Analysis, Insights and Forecast - by Cancer Type
- 9.2.1. Blood Cancer
- 9.2.2. Breast Cancer
- 9.2.3. Prostate Cancer
- 9.2.4. Gastrointestinal Cancer
- 9.2.5. Gynaecologic Cancer
- 9.2.6. Respiratory/Lung Cancer
- 9.2.7. Other Cancer Types
- 9.3. Market Analysis, Insights and Forecast - by End User
- 9.3.1. Hospitals
- 9.3.2. Specialty Clinics
- 9.3.3. Cancer and Radiation Therapy Centers
- 9.1. Market Analysis, Insights and Forecast - by Therapy Type
- 10. South America Cancer Treatment Industry Analysis, Insights and Forecast, 2019-2031
- 10.1. Market Analysis, Insights and Forecast - by Therapy Type
- 10.1.1. Chemotherapy
- 10.1.2. Targeted Therapy
- 10.1.3. Immunotherapy
- 10.1.4. Hormonal Therapy
- 10.1.5. Other Treatment Types
- 10.2. Market Analysis, Insights and Forecast - by Cancer Type
- 10.2.1. Blood Cancer
- 10.2.2. Breast Cancer
- 10.2.3. Prostate Cancer
- 10.2.4. Gastrointestinal Cancer
- 10.2.5. Gynaecologic Cancer
- 10.2.6. Respiratory/Lung Cancer
- 10.2.7. Other Cancer Types
- 10.3. Market Analysis, Insights and Forecast - by End User
- 10.3.1. Hospitals
- 10.3.2. Specialty Clinics
- 10.3.3. Cancer and Radiation Therapy Centers
- 10.1. Market Analysis, Insights and Forecast - by Therapy Type
- 11. North America Cancer Treatment Industry Analysis, Insights and Forecast, 2019-2031
- 11.1. Market Analysis, Insights and Forecast - By Country/Sub-region
- 11.1.1 United States
- 11.1.2 Canada
- 11.1.3 Mexico
- 12. Europe Cancer Treatment Industry Analysis, Insights and Forecast, 2019-2031
- 12.1. Market Analysis, Insights and Forecast - By Country/Sub-region
- 12.1.1 Germany
- 12.1.2 United Kingdom
- 12.1.3 France
- 12.1.4 Italy
- 12.1.5 Spain
- 12.1.6 Rest of Europe
- 13. Asia Pacific Cancer Treatment Industry Analysis, Insights and Forecast, 2019-2031
- 13.1. Market Analysis, Insights and Forecast - By Country/Sub-region
- 13.1.1 China
- 13.1.2 Japan
- 13.1.3 India
- 13.1.4 Australia
- 13.1.5 South Korea
- 13.1.6 Rest of Asia Pacific
- 14. Middle East and Africa Cancer Treatment Industry Analysis, Insights and Forecast, 2019-2031
- 14.1. Market Analysis, Insights and Forecast - By Country/Sub-region
- 14.1.1 GCC
- 14.1.2 South Africa
- 14.1.3 Rest of Middle East and Africa
- 15. South America Cancer Treatment Industry Analysis, Insights and Forecast, 2019-2031
- 15.1. Market Analysis, Insights and Forecast - By Country/Sub-region
- 15.1.1 Brazil
- 15.1.2 Argentina
- 15.1.3 Rest of South America
- 16. Competitive Analysis
- 16.1. Global Market Share Analysis 2024
- 16.2. Company Profiles
- 16.2.1 F Hoffmann-La Roche AG
- 16.2.1.1. Overview
- 16.2.1.2. Products
- 16.2.1.3. SWOT Analysis
- 16.2.1.4. Recent Developments
- 16.2.1.5. Financials (Based on Availability)
- 16.2.2 Celldex Therapeutics Inc
- 16.2.2.1. Overview
- 16.2.2.2. Products
- 16.2.2.3. SWOT Analysis
- 16.2.2.4. Recent Developments
- 16.2.2.5. Financials (Based on Availability)
- 16.2.3 Gilead Sciences Inc (Kite Pharma)
- 16.2.3.1. Overview
- 16.2.3.2. Products
- 16.2.3.3. SWOT Analysis
- 16.2.3.4. Recent Developments
- 16.2.3.5. Financials (Based on Availability)
- 16.2.4 Bayer AG
- 16.2.4.1. Overview
- 16.2.4.2. Products
- 16.2.4.3. SWOT Analysis
- 16.2.4.4. Recent Developments
- 16.2.4.5. Financials (Based on Availability)
- 16.2.5 Astellas Pharma Inc
- 16.2.5.1. Overview
- 16.2.5.2. Products
- 16.2.5.3. SWOT Analysis
- 16.2.5.4. Recent Developments
- 16.2.5.5. Financials (Based on Availability)
- 16.2.6 Novartis AG
- 16.2.6.1. Overview
- 16.2.6.2. Products
- 16.2.6.3. SWOT Analysis
- 16.2.6.4. Recent Developments
- 16.2.6.5. Financials (Based on Availability)
- 16.2.7 Amgen Inc
- 16.2.7.1. Overview
- 16.2.7.2. Products
- 16.2.7.3. SWOT Analysis
- 16.2.7.4. Recent Developments
- 16.2.7.5. Financials (Based on Availability)
- 16.2.8 Merck & Co Inc
- 16.2.8.1. Overview
- 16.2.8.2. Products
- 16.2.8.3. SWOT Analysis
- 16.2.8.4. Recent Developments
- 16.2.8.5. Financials (Based on Availability)
- 16.2.9 Takeda Pharmaceutical Company Limited
- 16.2.9.1. Overview
- 16.2.9.2. Products
- 16.2.9.3. SWOT Analysis
- 16.2.9.4. Recent Developments
- 16.2.9.5. Financials (Based on Availability)
- 16.2.10 AstraZeneca
- 16.2.10.1. Overview
- 16.2.10.2. Products
- 16.2.10.3. SWOT Analysis
- 16.2.10.4. Recent Developments
- 16.2.10.5. Financials (Based on Availability)
- 16.2.11 Abbvie Inc
- 16.2.11.1. Overview
- 16.2.11.2. Products
- 16.2.11.3. SWOT Analysis
- 16.2.11.4. Recent Developments
- 16.2.11.5. Financials (Based on Availability)
- 16.2.12 GSK PLC
- 16.2.12.1. Overview
- 16.2.12.2. Products
- 16.2.12.3. SWOT Analysis
- 16.2.12.4. Recent Developments
- 16.2.12.5. Financials (Based on Availability)
- 16.2.13 Lilly
- 16.2.13.1. Overview
- 16.2.13.2. Products
- 16.2.13.3. SWOT Analysis
- 16.2.13.4. Recent Developments
- 16.2.13.5. Financials (Based on Availability)
- 16.2.14 Bristol Myers Squibb Company
- 16.2.14.1. Overview
- 16.2.14.2. Products
- 16.2.14.3. SWOT Analysis
- 16.2.14.4. Recent Developments
- 16.2.14.5. Financials (Based on Availability)
- 16.2.15 Johnson & Johnson Services Inc
- 16.2.15.1. Overview
- 16.2.15.2. Products
- 16.2.15.3. SWOT Analysis
- 16.2.15.4. Recent Developments
- 16.2.15.5. Financials (Based on Availability)
- 16.2.16 Alaunos Therapeutics Inc
- 16.2.16.1. Overview
- 16.2.16.2. Products
- 16.2.16.3. SWOT Analysis
- 16.2.16.4. Recent Developments
- 16.2.16.5. Financials (Based on Availability)
- 16.2.17 Pfizer Inc
- 16.2.17.1. Overview
- 16.2.17.2. Products
- 16.2.17.3. SWOT Analysis
- 16.2.17.4. Recent Developments
- 16.2.17.5. Financials (Based on Availability)
- 16.2.1 F Hoffmann-La Roche AG
List of Figures
- Figure 1: Global Cancer Treatment Industry Revenue Breakdown (Million, %) by Region 2024 & 2032
- Figure 2: Global Cancer Treatment Industry Volume Breakdown (K Unit, %) by Region 2024 & 2032
- Figure 3: North America Cancer Treatment Industry Revenue (Million), by Country 2024 & 2032
- Figure 4: North America Cancer Treatment Industry Volume (K Unit), by Country 2024 & 2032
- Figure 5: North America Cancer Treatment Industry Revenue Share (%), by Country 2024 & 2032
- Figure 6: North America Cancer Treatment Industry Volume Share (%), by Country 2024 & 2032
- Figure 7: Europe Cancer Treatment Industry Revenue (Million), by Country 2024 & 2032
- Figure 8: Europe Cancer Treatment Industry Volume (K Unit), by Country 2024 & 2032
- Figure 9: Europe Cancer Treatment Industry Revenue Share (%), by Country 2024 & 2032
- Figure 10: Europe Cancer Treatment Industry Volume Share (%), by Country 2024 & 2032
- Figure 11: Asia Pacific Cancer Treatment Industry Revenue (Million), by Country 2024 & 2032
- Figure 12: Asia Pacific Cancer Treatment Industry Volume (K Unit), by Country 2024 & 2032
- Figure 13: Asia Pacific Cancer Treatment Industry Revenue Share (%), by Country 2024 & 2032
- Figure 14: Asia Pacific Cancer Treatment Industry Volume Share (%), by Country 2024 & 2032
- Figure 15: Middle East and Africa Cancer Treatment Industry Revenue (Million), by Country 2024 & 2032
- Figure 16: Middle East and Africa Cancer Treatment Industry Volume (K Unit), by Country 2024 & 2032
- Figure 17: Middle East and Africa Cancer Treatment Industry Revenue Share (%), by Country 2024 & 2032
- Figure 18: Middle East and Africa Cancer Treatment Industry Volume Share (%), by Country 2024 & 2032
- Figure 19: South America Cancer Treatment Industry Revenue (Million), by Country 2024 & 2032
- Figure 20: South America Cancer Treatment Industry Volume (K Unit), by Country 2024 & 2032
- Figure 21: South America Cancer Treatment Industry Revenue Share (%), by Country 2024 & 2032
- Figure 22: South America Cancer Treatment Industry Volume Share (%), by Country 2024 & 2032
- Figure 23: North America Cancer Treatment Industry Revenue (Million), by Therapy Type 2024 & 2032
- Figure 24: North America Cancer Treatment Industry Volume (K Unit), by Therapy Type 2024 & 2032
- Figure 25: North America Cancer Treatment Industry Revenue Share (%), by Therapy Type 2024 & 2032
- Figure 26: North America Cancer Treatment Industry Volume Share (%), by Therapy Type 2024 & 2032
- Figure 27: North America Cancer Treatment Industry Revenue (Million), by Cancer Type 2024 & 2032
- Figure 28: North America Cancer Treatment Industry Volume (K Unit), by Cancer Type 2024 & 2032
- Figure 29: North America Cancer Treatment Industry Revenue Share (%), by Cancer Type 2024 & 2032
- Figure 30: North America Cancer Treatment Industry Volume Share (%), by Cancer Type 2024 & 2032
- Figure 31: North America Cancer Treatment Industry Revenue (Million), by End User 2024 & 2032
- Figure 32: North America Cancer Treatment Industry Volume (K Unit), by End User 2024 & 2032
- Figure 33: North America Cancer Treatment Industry Revenue Share (%), by End User 2024 & 2032
- Figure 34: North America Cancer Treatment Industry Volume Share (%), by End User 2024 & 2032
- Figure 35: North America Cancer Treatment Industry Revenue (Million), by Country 2024 & 2032
- Figure 36: North America Cancer Treatment Industry Volume (K Unit), by Country 2024 & 2032
- Figure 37: North America Cancer Treatment Industry Revenue Share (%), by Country 2024 & 2032
- Figure 38: North America Cancer Treatment Industry Volume Share (%), by Country 2024 & 2032
- Figure 39: Europe Cancer Treatment Industry Revenue (Million), by Therapy Type 2024 & 2032
- Figure 40: Europe Cancer Treatment Industry Volume (K Unit), by Therapy Type 2024 & 2032
- Figure 41: Europe Cancer Treatment Industry Revenue Share (%), by Therapy Type 2024 & 2032
- Figure 42: Europe Cancer Treatment Industry Volume Share (%), by Therapy Type 2024 & 2032
- Figure 43: Europe Cancer Treatment Industry Revenue (Million), by Cancer Type 2024 & 2032
- Figure 44: Europe Cancer Treatment Industry Volume (K Unit), by Cancer Type 2024 & 2032
- Figure 45: Europe Cancer Treatment Industry Revenue Share (%), by Cancer Type 2024 & 2032
- Figure 46: Europe Cancer Treatment Industry Volume Share (%), by Cancer Type 2024 & 2032
- Figure 47: Europe Cancer Treatment Industry Revenue (Million), by End User 2024 & 2032
- Figure 48: Europe Cancer Treatment Industry Volume (K Unit), by End User 2024 & 2032
- Figure 49: Europe Cancer Treatment Industry Revenue Share (%), by End User 2024 & 2032
- Figure 50: Europe Cancer Treatment Industry Volume Share (%), by End User 2024 & 2032
- Figure 51: Europe Cancer Treatment Industry Revenue (Million), by Country 2024 & 2032
- Figure 52: Europe Cancer Treatment Industry Volume (K Unit), by Country 2024 & 2032
- Figure 53: Europe Cancer Treatment Industry Revenue Share (%), by Country 2024 & 2032
- Figure 54: Europe Cancer Treatment Industry Volume Share (%), by Country 2024 & 2032
- Figure 55: Asia Pacific Cancer Treatment Industry Revenue (Million), by Therapy Type 2024 & 2032
- Figure 56: Asia Pacific Cancer Treatment Industry Volume (K Unit), by Therapy Type 2024 & 2032
- Figure 57: Asia Pacific Cancer Treatment Industry Revenue Share (%), by Therapy Type 2024 & 2032
- Figure 58: Asia Pacific Cancer Treatment Industry Volume Share (%), by Therapy Type 2024 & 2032
- Figure 59: Asia Pacific Cancer Treatment Industry Revenue (Million), by Cancer Type 2024 & 2032
- Figure 60: Asia Pacific Cancer Treatment Industry Volume (K Unit), by Cancer Type 2024 & 2032
- Figure 61: Asia Pacific Cancer Treatment Industry Revenue Share (%), by Cancer Type 2024 & 2032
- Figure 62: Asia Pacific Cancer Treatment Industry Volume Share (%), by Cancer Type 2024 & 2032
- Figure 63: Asia Pacific Cancer Treatment Industry Revenue (Million), by End User 2024 & 2032
- Figure 64: Asia Pacific Cancer Treatment Industry Volume (K Unit), by End User 2024 & 2032
- Figure 65: Asia Pacific Cancer Treatment Industry Revenue Share (%), by End User 2024 & 2032
- Figure 66: Asia Pacific Cancer Treatment Industry Volume Share (%), by End User 2024 & 2032
- Figure 67: Asia Pacific Cancer Treatment Industry Revenue (Million), by Country 2024 & 2032
- Figure 68: Asia Pacific Cancer Treatment Industry Volume (K Unit), by Country 2024 & 2032
- Figure 69: Asia Pacific Cancer Treatment Industry Revenue Share (%), by Country 2024 & 2032
- Figure 70: Asia Pacific Cancer Treatment Industry Volume Share (%), by Country 2024 & 2032
- Figure 71: Middle East and Africa Cancer Treatment Industry Revenue (Million), by Therapy Type 2024 & 2032
- Figure 72: Middle East and Africa Cancer Treatment Industry Volume (K Unit), by Therapy Type 2024 & 2032
- Figure 73: Middle East and Africa Cancer Treatment Industry Revenue Share (%), by Therapy Type 2024 & 2032
- Figure 74: Middle East and Africa Cancer Treatment Industry Volume Share (%), by Therapy Type 2024 & 2032
- Figure 75: Middle East and Africa Cancer Treatment Industry Revenue (Million), by Cancer Type 2024 & 2032
- Figure 76: Middle East and Africa Cancer Treatment Industry Volume (K Unit), by Cancer Type 2024 & 2032
- Figure 77: Middle East and Africa Cancer Treatment Industry Revenue Share (%), by Cancer Type 2024 & 2032
- Figure 78: Middle East and Africa Cancer Treatment Industry Volume Share (%), by Cancer Type 2024 & 2032
- Figure 79: Middle East and Africa Cancer Treatment Industry Revenue (Million), by End User 2024 & 2032
- Figure 80: Middle East and Africa Cancer Treatment Industry Volume (K Unit), by End User 2024 & 2032
- Figure 81: Middle East and Africa Cancer Treatment Industry Revenue Share (%), by End User 2024 & 2032
- Figure 82: Middle East and Africa Cancer Treatment Industry Volume Share (%), by End User 2024 & 2032
- Figure 83: Middle East and Africa Cancer Treatment Industry Revenue (Million), by Country 2024 & 2032
- Figure 84: Middle East and Africa Cancer Treatment Industry Volume (K Unit), by Country 2024 & 2032
- Figure 85: Middle East and Africa Cancer Treatment Industry Revenue Share (%), by Country 2024 & 2032
- Figure 86: Middle East and Africa Cancer Treatment Industry Volume Share (%), by Country 2024 & 2032
- Figure 87: South America Cancer Treatment Industry Revenue (Million), by Therapy Type 2024 & 2032
- Figure 88: South America Cancer Treatment Industry Volume (K Unit), by Therapy Type 2024 & 2032
- Figure 89: South America Cancer Treatment Industry Revenue Share (%), by Therapy Type 2024 & 2032
- Figure 90: South America Cancer Treatment Industry Volume Share (%), by Therapy Type 2024 & 2032
- Figure 91: South America Cancer Treatment Industry Revenue (Million), by Cancer Type 2024 & 2032
- Figure 92: South America Cancer Treatment Industry Volume (K Unit), by Cancer Type 2024 & 2032
- Figure 93: South America Cancer Treatment Industry Revenue Share (%), by Cancer Type 2024 & 2032
- Figure 94: South America Cancer Treatment Industry Volume Share (%), by Cancer Type 2024 & 2032
- Figure 95: South America Cancer Treatment Industry Revenue (Million), by End User 2024 & 2032
- Figure 96: South America Cancer Treatment Industry Volume (K Unit), by End User 2024 & 2032
- Figure 97: South America Cancer Treatment Industry Revenue Share (%), by End User 2024 & 2032
- Figure 98: South America Cancer Treatment Industry Volume Share (%), by End User 2024 & 2032
- Figure 99: South America Cancer Treatment Industry Revenue (Million), by Country 2024 & 2032
- Figure 100: South America Cancer Treatment Industry Volume (K Unit), by Country 2024 & 2032
- Figure 101: South America Cancer Treatment Industry Revenue Share (%), by Country 2024 & 2032
- Figure 102: South America Cancer Treatment Industry Volume Share (%), by Country 2024 & 2032
List of Tables
- Table 1: Global Cancer Treatment Industry Revenue Million Forecast, by Region 2019 & 2032
- Table 2: Global Cancer Treatment Industry Volume K Unit Forecast, by Region 2019 & 2032
- Table 3: Global Cancer Treatment Industry Revenue Million Forecast, by Therapy Type 2019 & 2032
- Table 4: Global Cancer Treatment Industry Volume K Unit Forecast, by Therapy Type 2019 & 2032
- Table 5: Global Cancer Treatment Industry Revenue Million Forecast, by Cancer Type 2019 & 2032
- Table 6: Global Cancer Treatment Industry Volume K Unit Forecast, by Cancer Type 2019 & 2032
- Table 7: Global Cancer Treatment Industry Revenue Million Forecast, by End User 2019 & 2032
- Table 8: Global Cancer Treatment Industry Volume K Unit Forecast, by End User 2019 & 2032
- Table 9: Global Cancer Treatment Industry Revenue Million Forecast, by Region 2019 & 2032
- Table 10: Global Cancer Treatment Industry Volume K Unit Forecast, by Region 2019 & 2032
- Table 11: Global Cancer Treatment Industry Revenue Million Forecast, by Country 2019 & 2032
- Table 12: Global Cancer Treatment Industry Volume K Unit Forecast, by Country 2019 & 2032
- Table 13: United States Cancer Treatment Industry Revenue (Million) Forecast, by Application 2019 & 2032
- Table 14: United States Cancer Treatment Industry Volume (K Unit) Forecast, by Application 2019 & 2032
- Table 15: Canada Cancer Treatment Industry Revenue (Million) Forecast, by Application 2019 & 2032
- Table 16: Canada Cancer Treatment Industry Volume (K Unit) Forecast, by Application 2019 & 2032
- Table 17: Mexico Cancer Treatment Industry Revenue (Million) Forecast, by Application 2019 & 2032
- Table 18: Mexico Cancer Treatment Industry Volume (K Unit) Forecast, by Application 2019 & 2032
- Table 19: Global Cancer Treatment Industry Revenue Million Forecast, by Country 2019 & 2032
- Table 20: Global Cancer Treatment Industry Volume K Unit Forecast, by Country 2019 & 2032
- Table 21: Germany Cancer Treatment Industry Revenue (Million) Forecast, by Application 2019 & 2032
- Table 22: Germany Cancer Treatment Industry Volume (K Unit) Forecast, by Application 2019 & 2032
- Table 23: United Kingdom Cancer Treatment Industry Revenue (Million) Forecast, by Application 2019 & 2032
- Table 24: United Kingdom Cancer Treatment Industry Volume (K Unit) Forecast, by Application 2019 & 2032
- Table 25: France Cancer Treatment Industry Revenue (Million) Forecast, by Application 2019 & 2032
- Table 26: France Cancer Treatment Industry Volume (K Unit) Forecast, by Application 2019 & 2032
- Table 27: Italy Cancer Treatment Industry Revenue (Million) Forecast, by Application 2019 & 2032
- Table 28: Italy Cancer Treatment Industry Volume (K Unit) Forecast, by Application 2019 & 2032
- Table 29: Spain Cancer Treatment Industry Revenue (Million) Forecast, by Application 2019 & 2032
- Table 30: Spain Cancer Treatment Industry Volume (K Unit) Forecast, by Application 2019 & 2032
- Table 31: Rest of Europe Cancer Treatment Industry Revenue (Million) Forecast, by Application 2019 & 2032
- Table 32: Rest of Europe Cancer Treatment Industry Volume (K Unit) Forecast, by Application 2019 & 2032
- Table 33: Global Cancer Treatment Industry Revenue Million Forecast, by Country 2019 & 2032
- Table 34: Global Cancer Treatment Industry Volume K Unit Forecast, by Country 2019 & 2032
- Table 35: China Cancer Treatment Industry Revenue (Million) Forecast, by Application 2019 & 2032
- Table 36: China Cancer Treatment Industry Volume (K Unit) Forecast, by Application 2019 & 2032
- Table 37: Japan Cancer Treatment Industry Revenue (Million) Forecast, by Application 2019 & 2032
- Table 38: Japan Cancer Treatment Industry Volume (K Unit) Forecast, by Application 2019 & 2032
- Table 39: India Cancer Treatment Industry Revenue (Million) Forecast, by Application 2019 & 2032
- Table 40: India Cancer Treatment Industry Volume (K Unit) Forecast, by Application 2019 & 2032
- Table 41: Australia Cancer Treatment Industry Revenue (Million) Forecast, by Application 2019 & 2032
- Table 42: Australia Cancer Treatment Industry Volume (K Unit) Forecast, by Application 2019 & 2032
- Table 43: South Korea Cancer Treatment Industry Revenue (Million) Forecast, by Application 2019 & 2032
- Table 44: South Korea Cancer Treatment Industry Volume (K Unit) Forecast, by Application 2019 & 2032
- Table 45: Rest of Asia Pacific Cancer Treatment Industry Revenue (Million) Forecast, by Application 2019 & 2032
- Table 46: Rest of Asia Pacific Cancer Treatment Industry Volume (K Unit) Forecast, by Application 2019 & 2032
- Table 47: Global Cancer Treatment Industry Revenue Million Forecast, by Country 2019 & 2032
- Table 48: Global Cancer Treatment Industry Volume K Unit Forecast, by Country 2019 & 2032
- Table 49: GCC Cancer Treatment Industry Revenue (Million) Forecast, by Application 2019 & 2032
- Table 50: GCC Cancer Treatment Industry Volume (K Unit) Forecast, by Application 2019 & 2032
- Table 51: South Africa Cancer Treatment Industry Revenue (Million) Forecast, by Application 2019 & 2032
- Table 52: South Africa Cancer Treatment Industry Volume (K Unit) Forecast, by Application 2019 & 2032
- Table 53: Rest of Middle East and Africa Cancer Treatment Industry Revenue (Million) Forecast, by Application 2019 & 2032
- Table 54: Rest of Middle East and Africa Cancer Treatment Industry Volume (K Unit) Forecast, by Application 2019 & 2032
- Table 55: Global Cancer Treatment Industry Revenue Million Forecast, by Country 2019 & 2032
- Table 56: Global Cancer Treatment Industry Volume K Unit Forecast, by Country 2019 & 2032
- Table 57: Brazil Cancer Treatment Industry Revenue (Million) Forecast, by Application 2019 & 2032
- Table 58: Brazil Cancer Treatment Industry Volume (K Unit) Forecast, by Application 2019 & 2032
- Table 59: Argentina Cancer Treatment Industry Revenue (Million) Forecast, by Application 2019 & 2032
- Table 60: Argentina Cancer Treatment Industry Volume (K Unit) Forecast, by Application 2019 & 2032
- Table 61: Rest of South America Cancer Treatment Industry Revenue (Million) Forecast, by Application 2019 & 2032
- Table 62: Rest of South America Cancer Treatment Industry Volume (K Unit) Forecast, by Application 2019 & 2032
- Table 63: Global Cancer Treatment Industry Revenue Million Forecast, by Therapy Type 2019 & 2032
- Table 64: Global Cancer Treatment Industry Volume K Unit Forecast, by Therapy Type 2019 & 2032
- Table 65: Global Cancer Treatment Industry Revenue Million Forecast, by Cancer Type 2019 & 2032
- Table 66: Global Cancer Treatment Industry Volume K Unit Forecast, by Cancer Type 2019 & 2032
- Table 67: Global Cancer Treatment Industry Revenue Million Forecast, by End User 2019 & 2032
- Table 68: Global Cancer Treatment Industry Volume K Unit Forecast, by End User 2019 & 2032
- Table 69: Global Cancer Treatment Industry Revenue Million Forecast, by Country 2019 & 2032
- Table 70: Global Cancer Treatment Industry Volume K Unit Forecast, by Country 2019 & 2032
- Table 71: United States Cancer Treatment Industry Revenue (Million) Forecast, by Application 2019 & 2032
- Table 72: United States Cancer Treatment Industry Volume (K Unit) Forecast, by Application 2019 & 2032
- Table 73: Canada Cancer Treatment Industry Revenue (Million) Forecast, by Application 2019 & 2032
- Table 74: Canada Cancer Treatment Industry Volume (K Unit) Forecast, by Application 2019 & 2032
- Table 75: Mexico Cancer Treatment Industry Revenue (Million) Forecast, by Application 2019 & 2032
- Table 76: Mexico Cancer Treatment Industry Volume (K Unit) Forecast, by Application 2019 & 2032
- Table 77: Global Cancer Treatment Industry Revenue Million Forecast, by Therapy Type 2019 & 2032
- Table 78: Global Cancer Treatment Industry Volume K Unit Forecast, by Therapy Type 2019 & 2032
- Table 79: Global Cancer Treatment Industry Revenue Million Forecast, by Cancer Type 2019 & 2032
- Table 80: Global Cancer Treatment Industry Volume K Unit Forecast, by Cancer Type 2019 & 2032
- Table 81: Global Cancer Treatment Industry Revenue Million Forecast, by End User 2019 & 2032
- Table 82: Global Cancer Treatment Industry Volume K Unit Forecast, by End User 2019 & 2032
- Table 83: Global Cancer Treatment Industry Revenue Million Forecast, by Country 2019 & 2032
- Table 84: Global Cancer Treatment Industry Volume K Unit Forecast, by Country 2019 & 2032
- Table 85: Germany Cancer Treatment Industry Revenue (Million) Forecast, by Application 2019 & 2032
- Table 86: Germany Cancer Treatment Industry Volume (K Unit) Forecast, by Application 2019 & 2032
- Table 87: United Kingdom Cancer Treatment Industry Revenue (Million) Forecast, by Application 2019 & 2032
- Table 88: United Kingdom Cancer Treatment Industry Volume (K Unit) Forecast, by Application 2019 & 2032
- Table 89: France Cancer Treatment Industry Revenue (Million) Forecast, by Application 2019 & 2032
- Table 90: France Cancer Treatment Industry Volume (K Unit) Forecast, by Application 2019 & 2032
- Table 91: Italy Cancer Treatment Industry Revenue (Million) Forecast, by Application 2019 & 2032
- Table 92: Italy Cancer Treatment Industry Volume (K Unit) Forecast, by Application 2019 & 2032
- Table 93: Spain Cancer Treatment Industry Revenue (Million) Forecast, by Application 2019 & 2032
- Table 94: Spain Cancer Treatment Industry Volume (K Unit) Forecast, by Application 2019 & 2032
- Table 95: Rest of Europe Cancer Treatment Industry Revenue (Million) Forecast, by Application 2019 & 2032
- Table 96: Rest of Europe Cancer Treatment Industry Volume (K Unit) Forecast, by Application 2019 & 2032
- Table 97: Global Cancer Treatment Industry Revenue Million Forecast, by Therapy Type 2019 & 2032
- Table 98: Global Cancer Treatment Industry Volume K Unit Forecast, by Therapy Type 2019 & 2032
- Table 99: Global Cancer Treatment Industry Revenue Million Forecast, by Cancer Type 2019 & 2032
- Table 100: Global Cancer Treatment Industry Volume K Unit Forecast, by Cancer Type 2019 & 2032
- Table 101: Global Cancer Treatment Industry Revenue Million Forecast, by End User 2019 & 2032
- Table 102: Global Cancer Treatment Industry Volume K Unit Forecast, by End User 2019 & 2032
- Table 103: Global Cancer Treatment Industry Revenue Million Forecast, by Country 2019 & 2032
- Table 104: Global Cancer Treatment Industry Volume K Unit Forecast, by Country 2019 & 2032
- Table 105: China Cancer Treatment Industry Revenue (Million) Forecast, by Application 2019 & 2032
- Table 106: China Cancer Treatment Industry Volume (K Unit) Forecast, by Application 2019 & 2032
- Table 107: Japan Cancer Treatment Industry Revenue (Million) Forecast, by Application 2019 & 2032
- Table 108: Japan Cancer Treatment Industry Volume (K Unit) Forecast, by Application 2019 & 2032
- Table 109: India Cancer Treatment Industry Revenue (Million) Forecast, by Application 2019 & 2032
- Table 110: India Cancer Treatment Industry Volume (K Unit) Forecast, by Application 2019 & 2032
- Table 111: Australia Cancer Treatment Industry Revenue (Million) Forecast, by Application 2019 & 2032
- Table 112: Australia Cancer Treatment Industry Volume (K Unit) Forecast, by Application 2019 & 2032
- Table 113: South Korea Cancer Treatment Industry Revenue (Million) Forecast, by Application 2019 & 2032
- Table 114: South Korea Cancer Treatment Industry Volume (K Unit) Forecast, by Application 2019 & 2032
- Table 115: Rest of Asia Pacific Cancer Treatment Industry Revenue (Million) Forecast, by Application 2019 & 2032
- Table 116: Rest of Asia Pacific Cancer Treatment Industry Volume (K Unit) Forecast, by Application 2019 & 2032
- Table 117: Global Cancer Treatment Industry Revenue Million Forecast, by Therapy Type 2019 & 2032
- Table 118: Global Cancer Treatment Industry Volume K Unit Forecast, by Therapy Type 2019 & 2032
- Table 119: Global Cancer Treatment Industry Revenue Million Forecast, by Cancer Type 2019 & 2032
- Table 120: Global Cancer Treatment Industry Volume K Unit Forecast, by Cancer Type 2019 & 2032
- Table 121: Global Cancer Treatment Industry Revenue Million Forecast, by End User 2019 & 2032
- Table 122: Global Cancer Treatment Industry Volume K Unit Forecast, by End User 2019 & 2032
- Table 123: Global Cancer Treatment Industry Revenue Million Forecast, by Country 2019 & 2032
- Table 124: Global Cancer Treatment Industry Volume K Unit Forecast, by Country 2019 & 2032
- Table 125: GCC Cancer Treatment Industry Revenue (Million) Forecast, by Application 2019 & 2032
- Table 126: GCC Cancer Treatment Industry Volume (K Unit) Forecast, by Application 2019 & 2032
- Table 127: South Africa Cancer Treatment Industry Revenue (Million) Forecast, by Application 2019 & 2032
- Table 128: South Africa Cancer Treatment Industry Volume (K Unit) Forecast, by Application 2019 & 2032
- Table 129: Rest of Middle East and Africa Cancer Treatment Industry Revenue (Million) Forecast, by Application 2019 & 2032
- Table 130: Rest of Middle East and Africa Cancer Treatment Industry Volume (K Unit) Forecast, by Application 2019 & 2032
- Table 131: Global Cancer Treatment Industry Revenue Million Forecast, by Therapy Type 2019 & 2032
- Table 132: Global Cancer Treatment Industry Volume K Unit Forecast, by Therapy Type 2019 & 2032
- Table 133: Global Cancer Treatment Industry Revenue Million Forecast, by Cancer Type 2019 & 2032
- Table 134: Global Cancer Treatment Industry Volume K Unit Forecast, by Cancer Type 2019 & 2032
- Table 135: Global Cancer Treatment Industry Revenue Million Forecast, by End User 2019 & 2032
- Table 136: Global Cancer Treatment Industry Volume K Unit Forecast, by End User 2019 & 2032
- Table 137: Global Cancer Treatment Industry Revenue Million Forecast, by Country 2019 & 2032
- Table 138: Global Cancer Treatment Industry Volume K Unit Forecast, by Country 2019 & 2032
- Table 139: Brazil Cancer Treatment Industry Revenue (Million) Forecast, by Application 2019 & 2032
- Table 140: Brazil Cancer Treatment Industry Volume (K Unit) Forecast, by Application 2019 & 2032
- Table 141: Argentina Cancer Treatment Industry Revenue (Million) Forecast, by Application 2019 & 2032
- Table 142: Argentina Cancer Treatment Industry Volume (K Unit) Forecast, by Application 2019 & 2032
- Table 143: Rest of South America Cancer Treatment Industry Revenue (Million) Forecast, by Application 2019 & 2032
- Table 144: Rest of South America Cancer Treatment Industry Volume (K Unit) Forecast, by Application 2019 & 2032
Frequently Asked Questions
1. What is the projected Compound Annual Growth Rate (CAGR) of the Cancer Treatment Industry?
The projected CAGR is approximately 10.64%.
2. Which companies are prominent players in the Cancer Treatment Industry?
Key companies in the market include F Hoffmann-La Roche AG, Celldex Therapeutics Inc , Gilead Sciences Inc (Kite Pharma), Bayer AG, Astellas Pharma Inc, Novartis AG, Amgen Inc, Merck & Co Inc, Takeda Pharmaceutical Company Limited, AstraZeneca, Abbvie Inc, GSK PLC, Lilly, Bristol Myers Squibb Company, Johnson & Johnson Services Inc, Alaunos Therapeutics Inc, Pfizer Inc.
3. What are the main segments of the Cancer Treatment Industry?
The market segments include Therapy Type, Cancer Type, End User.
4. Can you provide details about the market size?
The market size is estimated to be USD 220.24 Million as of 2022.
5. What are some drivers contributing to market growth?
Increasing Patient Assistance Programs (PAPs) and Rising Demand for Personalized Medicine; Growing Government Initiatives for Cancer Awareness; Rising Prevalence of Cancer Worldwide; Strong R&D Initiatives from Key Players.
6. What are the notable trends driving market growth?
The Targeted Therapy Segment is Expected to Witness Significant Growth during the the Forecast Period.
7. Are there any restraints impacting market growth?
Fluctuation in Reimbursement Policies; High Cost of Cancer Therapies.
8. Can you provide examples of recent developments in the market?
In May 2023, Genmab A/S received USFDA approval for its T-cell engaging bispecific antibody, EPKINLY (epcoritamab-bysp), which was intended for the treatment of relapsed or refractory (R/R) diffuse large B-cell lymphoma (DLBCL) in adult patients.
9. What pricing options are available for accessing the report?
Pricing options include single-user, multi-user, and enterprise licenses priced at USD 4750, USD 5250, and USD 8750 respectively.
10. Is the market size provided in terms of value or volume?
The market size is provided in terms of value, measured in Million and volume, measured in K Unit.
11. Are there any specific market keywords associated with the report?
Yes, the market keyword associated with the report is "Cancer Treatment Industry," which aids in identifying and referencing the specific market segment covered.
12. How do I determine which pricing option suits my needs best?
The pricing options vary based on user requirements and access needs. Individual users may opt for single-user licenses, while businesses requiring broader access may choose multi-user or enterprise licenses for cost-effective access to the report.
13. Are there any additional resources or data provided in the Cancer Treatment Industry report?
While the report offers comprehensive insights, it's advisable to review the specific contents or supplementary materials provided to ascertain if additional resources or data are available.
14. How can I stay updated on further developments or reports in the Cancer Treatment Industry?
To stay informed about further developments, trends, and reports in the Cancer Treatment Industry, consider subscribing to industry newsletters, following relevant companies and organizations, or regularly checking reputable industry news sources and publications.
Methodology
Step 1 - Identification of Relevant Samples Size from Population Database


Step 2 - Approaches for Defining Global Market Size (Value, Volume* & Price*)

Note*: In applicable scenarios
Step 3 - Data Sources
Primary Research
- Web Analytics
- Survey Reports
- Research Institute
- Latest Research Reports
- Opinion Leaders
Secondary Research
- Annual Reports
- White Paper
- Latest Press Release
- Industry Association
- Paid Database
- Investor Presentations

Step 4 - Data Triangulation
Involves using different sources of information in order to increase the validity of a study
These sources are likely to be stakeholders in a program - participants, other researchers, program staff, other community members, and so on.
Then we put all data in single framework & apply various statistical tools to find out the dynamic on the market.
During the analysis stage, feedback from the stakeholder groups would be compared to determine areas of agreement as well as areas of divergence
