

Key Insights
The global electroporation instruments market is experiencing robust growth, driven by the increasing adoption of electroporation techniques in biomedical research, therapeutic delivery, and protein production. The market's expansion is fueled by several factors, including the rising prevalence of chronic diseases necessitating advanced therapeutic approaches, the increasing demand for efficient gene and drug delivery systems, and the growing investments in research and development within the biotechnology and pharmaceutical sectors. The reagent-based method currently dominates the market due to its cost-effectiveness and ease of use, but the instrument-based method segment is projected to witness significant growth driven by advancements in instrument technology leading to improved precision and efficiency. North America holds a significant market share currently, owing to the presence of major research institutions and well-established biotechnology companies. However, the Asia Pacific region is poised for substantial growth due to increasing investments in healthcare infrastructure and a rising focus on biopharmaceutical research within the region. Competitive dynamics are characterized by the presence of both large multinational corporations and specialized smaller companies, fostering innovation and competition. While regulatory hurdles and the high cost associated with some advanced instrument-based methods pose certain restraints, ongoing technological advancements are expected to overcome these limitations, ensuring the sustained growth of the electroporation instruments market.
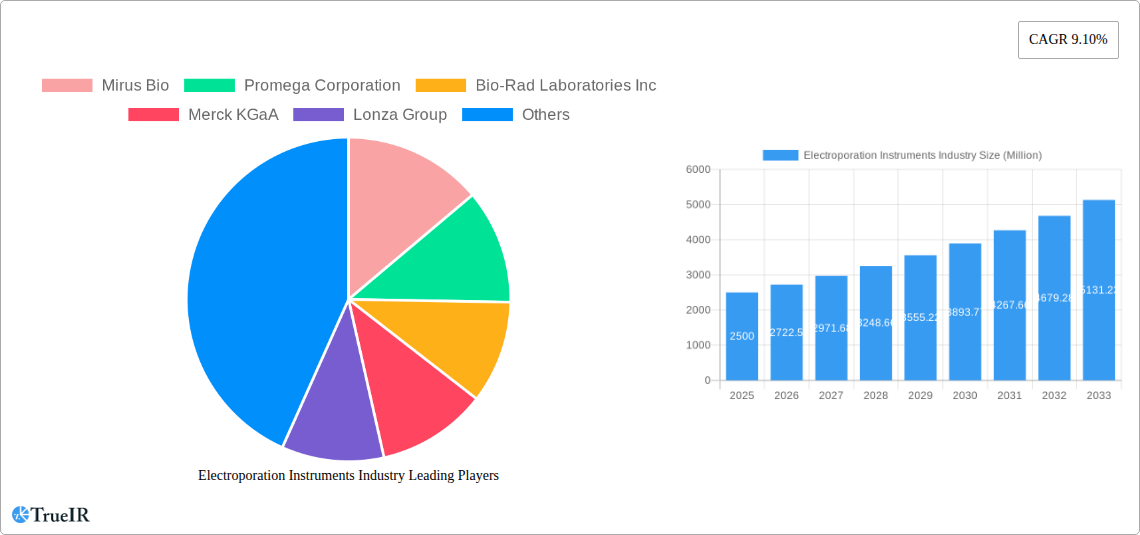
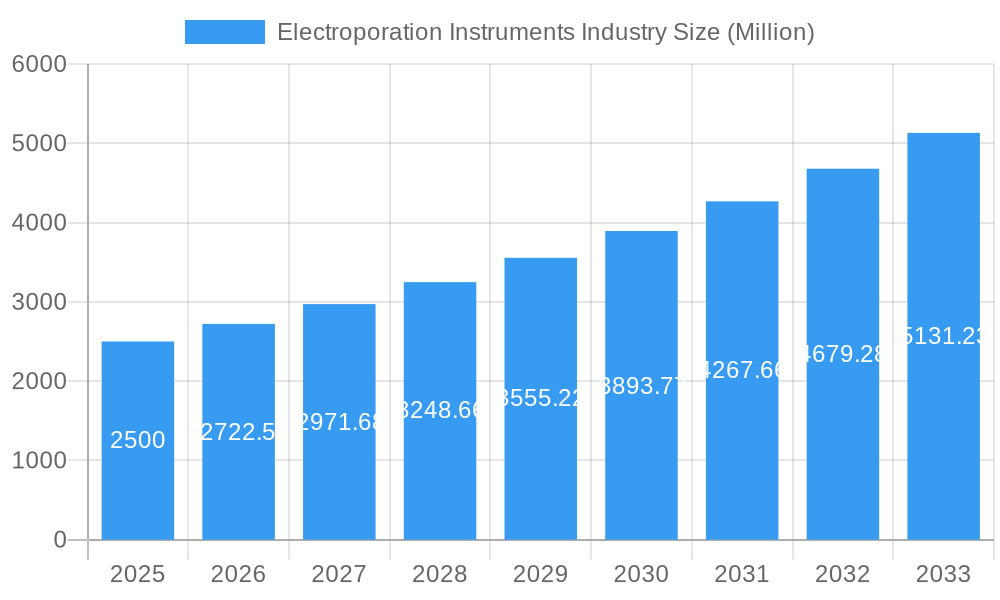
Electroporation Instruments Industry Market Size (In Billion)
The forecast period (2025-2033) anticipates a continued upward trajectory, with the CAGR of 9.10% suggesting substantial market expansion. This growth will be further propelled by the increasing adoption of electroporation in personalized medicine, where tailored therapies require precise and efficient delivery mechanisms. The market segmentation by application highlights the significant role of biomedical research, but the therapeutic delivery segment is expected to experience the fastest growth due to the ongoing development of novel gene therapies and targeted drug delivery systems using electroporation. Future market trends indicate a shift towards more sophisticated and automated electroporation instruments, integration with other laboratory technologies, and the development of user-friendly, miniaturized devices for point-of-care applications. This evolution will likely lead to a higher adoption rate across various research settings and clinical applications, further bolstering market growth.
Electroporation Instruments Industry Company Market Share
Electroporation Instruments Industry Market Report: 2019-2033
This comprehensive report provides a detailed analysis of the global electroporation instruments market, offering invaluable insights for industry stakeholders, investors, and researchers. Covering the period from 2019 to 2033, with a focus on 2025, this report meticulously examines market structure, competitive dynamics, technological advancements, and future growth prospects. The market is projected to reach xx Million by 2033, exhibiting a CAGR of xx% during the forecast period (2025-2033).
Electroporation Instruments Industry Market Structure & Competitive Landscape
The global electroporation instruments market is moderately concentrated, with several key players dominating the landscape. The Herfindahl-Hirschman Index (HHI) for 2024 is estimated at xx, indicating a moderately consolidated market. However, the market is characterized by significant innovation, particularly in reagent-based methods and advanced instrument designs. Regulatory approvals, particularly for therapeutic applications, play a crucial role in market access. Product substitutes, such as other gene delivery methods (e.g., viral vectors), exert competitive pressure. The market comprises diverse end-users, including academic research institutions, pharmaceutical companies, and biotechnology firms. The past five years have witnessed a moderate level of mergers and acquisitions (M&A) activity, with a total estimated transaction value of xx Million.
- Market Concentration: Moderately concentrated, with an estimated HHI of xx in 2024.
- Innovation Drivers: Advancements in reagent formulations, miniaturization of instruments, and development of high-throughput systems.
- Regulatory Impacts: Stringent regulatory approvals for therapeutic applications influence market growth.
- Product Substitutes: Viral vectors and other gene delivery methods pose competitive challenges.
- End-User Segmentation: Academic research, pharmaceutical companies, and biotechnology firms are key end-users.
- M&A Trends: Moderate M&A activity observed, with an estimated total transaction value of xx Million in the last five years.
Electroporation Instruments Industry Market Trends & Opportunities
The global electroporation instruments market is experiencing robust growth, driven by the increasing demand for advanced gene editing technologies and cell-based therapies. Technological advancements in electroporation techniques, such as microfluidic electroporation and pulsed electric field (PEF) technologies, are expanding application possibilities. Consumer preference for faster, more efficient, and less invasive gene delivery methods fuels market expansion. The increasing prevalence of chronic diseases and growing investments in biomedical research are key factors underpinning market growth. Intense competition among key players stimulates innovation and drives down prices, leading to broader market penetration. The market is expected to witness significant growth in the coming years, driven by factors such as the expanding applications of electroporation in various fields.
Dominant Markets & Segments in Electroporation Instruments Industry
The North American region currently holds a dominant position in the global electroporation instruments market, driven by substantial investment in biomedical research and the presence of key players. Within the segments, the instrument-based method segment dominates due to its high throughput capabilities and suitability for various applications. The biomedical research application segment is the largest, propelled by extensive R&D activities and increased adoption of electroporation technologies in drug discovery and development.
- Leading Region: North America
- Leading Method: Instrument-based Method
- Leading Application: Biomedical Research
Key Growth Drivers (North America):
- Robust funding for biomedical research and development.
- Presence of major electroporation instrument manufacturers.
- Well-established regulatory frameworks supporting clinical trials.
- Strong intellectual property protection.
Electroporation Instruments Industry Product Analysis
Electroporation instruments are evolving toward enhanced precision, higher throughput, and improved user-friendliness. Innovations include microfluidic devices enabling single-cell electroporation and automated systems improving efficiency. Reagent-based methods continue to improve with enhanced transfection efficiencies and reduced cytotoxicity. The market is witnessing the emergence of integrated systems combining instruments and reagents for streamlined workflows. These advancements expand the range of applications, contributing to wider adoption across research and therapeutic settings.
Key Drivers, Barriers & Challenges in Electroporation Instruments Industry
Key Drivers:
- The burgeoning field of cell and gene therapy fuels significant demand for electroporation instruments.
- Technological advancements continue to improve the efficiency and precision of electroporation techniques.
- Increasing government funding and private investment in biomedical research boost market growth.
Key Challenges & Restraints:
- Stringent regulatory hurdles for therapeutic applications pose challenges to market expansion.
- Supply chain disruptions can impact the availability of critical components and reagents.
- Intense competition among existing and emerging players creates pricing pressures.
Growth Drivers in the Electroporation Instruments Industry Market
The increasing prevalence of chronic diseases like cancer and genetic disorders fuels a high demand for effective gene therapies and cellular treatments where electroporation plays a crucial role. Advances in electroporation technologies, such as microfluidic systems and high-throughput platforms, enhance efficiency and broaden applications. Significant investments in biotechnology and pharmaceutical research significantly accelerate adoption across various sectors.
Challenges Impacting Electroporation Instruments Industry Growth
High initial investment costs of electroporation instruments can limit accessibility, particularly for smaller research groups. The need for specialized training and expertise can hinder broader adoption. Regulatory pathways for therapeutic applications remain complex and time-consuming, creating hurdles for market entry.
Key Players Shaping the Electroporation Instruments Industry Market
- Mirus Bio
- Promega Corporation
- Bio-Rad Laboratories Inc
- Merck KGaA
- Lonza Group
- Altogen Biosystems
- Polyplus-transfection SA
- SignaGen Laboratories
- Qiagen NV
- Thermo Fisher Scientific
Significant Electroporation Instruments Industry Industry Milestones
- February 2022: Mirus Bio launched TransIT-VirusGEN SELECT Transfection Kits for large-scale viral vector production, bolstering capabilities in cell and gene therapy.
- September 2022: Polyplus launched in vivo-jetRNA+ transfection reagent for in vivo mRNA delivery, expanding the mRNA therapeutic delivery landscape.
Future Outlook for Electroporation Instruments Industry Market
The electroporation instruments market is poised for continued growth driven by ongoing advancements in gene editing technologies, increasing investments in personalized medicine, and the growing adoption of electroporation in diverse therapeutic areas. Strategic collaborations between instrument manufacturers and biotechnology companies will drive further innovation and expansion. The market presents significant opportunities for companies specializing in developing advanced electroporation systems and reagents tailored for specific therapeutic applications.
Electroporation Instruments Industry Segmentation
-
1. Method
- 1.1. Reagent-based Method
- 1.2. Instrument-based Method
- 1.3. Other Methods
-
2. Application
- 2.1. Biomedical Research
- 2.2. Therapeutic Delivery
- 2.3. Protein Production
Electroporation Instruments Industry Segmentation By Geography
-
1. North America
- 1.1. United States
- 1.2. Canada
- 1.3. Mexico
-
2. Europe
- 2.1. Germany
- 2.2. United Kingdom
- 2.3. France
- 2.4. Italy
- 2.5. Spain
- 2.6. Rest of Europe
-
3. Asia Pacific
- 3.1. China
- 3.2. Japan
- 3.3. India
- 3.4. Australia
- 3.5. South Korea
- 3.6. Rest of Asia Pacific
-
4. Middle East and Africa
- 4.1. GCC
- 4.2. South Africa
- 4.3. Rest of Middle East and Africa
-
5. South America
- 5.1. Brazil
- 5.2. Argentina
- 5.3. Rest of South America
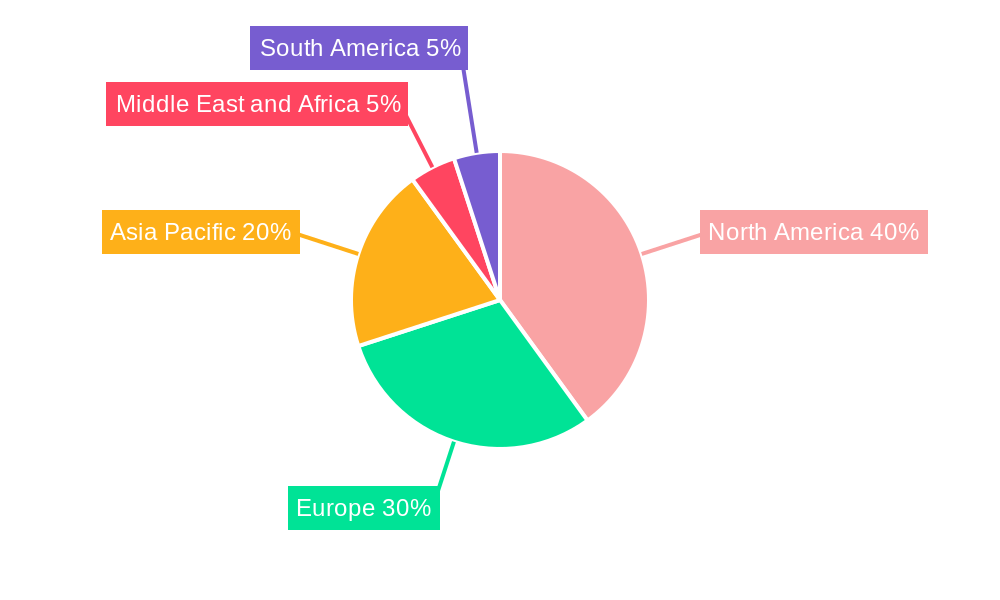
Electroporation Instruments Industry Regional Market Share
Geographic Coverage of Electroporation Instruments Industry
Electroporation Instruments Industry REPORT HIGHLIGHTS
| Aspects | Details |
|---|---|
| Study Period | 2020-2034 |
| Base Year | 2025 |
| Estimated Year | 2026 |
| Forecast Period | 2026-2034 |
| Historical Period | 2020-2025 |
| Growth Rate | CAGR of 7.73% from 2020-2034 |
| Segmentation |
|
Table of Contents
- 1. Introduction
- 1.1. Research Scope
- 1.2. Market Segmentation
- 1.3. Research Objective
- 1.4. Definitions and Assumptions
- 2. Executive Summary
- 2.1. Market Snapshot
- 3. Market Dynamics
- 3.1. Market Drivers
- 3.2. Market Restrains
- 3.3. Market Trends
- 3.4. Market Opportunities
- 4. Market Factor Analysis
- 4.1. Porters Five Forces
- 4.1.1. Bargaining Power of Suppliers
- 4.1.2. Bargaining Power of Buyers
- 4.1.3. Threat of New Entrants
- 4.1.4. Threat of Substitutes
- 4.1.5. Competitive Rivalry
- 4.2. PESTEL analysis
- 4.3. BCG Analysis
- 4.3.1. Stars (High Growth, High Market Share)
- 4.3.2. Cash Cows (Low Growth, High Market Share)
- 4.3.3. Question Mark (High Growth, Low Market Share)
- 4.3.4. Dogs (Low Growth, Low Market Share)
- 4.4. Ansoff Matrix Analysis
- 4.5. Supply Chain Analysis
- 4.6. Regulatory Landscape
- 4.7. Current Market Potential and Opportunity Assessment (TAM–SAM–SOM Framework)
- 4.8. TIR Analyst Note
- 4.1. Porters Five Forces
- 5. Market Analysis, Insights and Forecast 2021-2033
- 5.1. Market Analysis, Insights and Forecast - by Method
- 5.1.1. Reagent-based Method
- 5.1.2. Instrument-based Method
- 5.1.3. Other Methods
- 5.2. Market Analysis, Insights and Forecast - by Application
- 5.2.1. Biomedical Research
- 5.2.2. Therapeutic Delivery
- 5.2.3. Protein Production
- 5.3. Market Analysis, Insights and Forecast - by Region
- 5.3.1. North America
- 5.3.2. Europe
- 5.3.3. Asia Pacific
- 5.3.4. Middle East and Africa
- 5.3.5. South America
- 5.1. Market Analysis, Insights and Forecast - by Method
- 6. Global Electroporation Instruments Industry Analysis, Insights and Forecast, 2021-2033
- 6.1. Market Analysis, Insights and Forecast - by Method
- 6.1.1. Reagent-based Method
- 6.1.2. Instrument-based Method
- 6.1.3. Other Methods
- 6.2. Market Analysis, Insights and Forecast - by Application
- 6.2.1. Biomedical Research
- 6.2.2. Therapeutic Delivery
- 6.2.3. Protein Production
- 6.1. Market Analysis, Insights and Forecast - by Method
- 7. North America Electroporation Instruments Industry Analysis, Insights and Forecast, 2020-2032
- 7.1. Market Analysis, Insights and Forecast - by Method
- 7.1.1. Reagent-based Method
- 7.1.2. Instrument-based Method
- 7.1.3. Other Methods
- 7.2. Market Analysis, Insights and Forecast - by Application
- 7.2.1. Biomedical Research
- 7.2.2. Therapeutic Delivery
- 7.2.3. Protein Production
- 7.1. Market Analysis, Insights and Forecast - by Method
- 8. Europe Electroporation Instruments Industry Analysis, Insights and Forecast, 2020-2032
- 8.1. Market Analysis, Insights and Forecast - by Method
- 8.1.1. Reagent-based Method
- 8.1.2. Instrument-based Method
- 8.1.3. Other Methods
- 8.2. Market Analysis, Insights and Forecast - by Application
- 8.2.1. Biomedical Research
- 8.2.2. Therapeutic Delivery
- 8.2.3. Protein Production
- 8.1. Market Analysis, Insights and Forecast - by Method
- 9. Asia Pacific Electroporation Instruments Industry Analysis, Insights and Forecast, 2020-2032
- 9.1. Market Analysis, Insights and Forecast - by Method
- 9.1.1. Reagent-based Method
- 9.1.2. Instrument-based Method
- 9.1.3. Other Methods
- 9.2. Market Analysis, Insights and Forecast - by Application
- 9.2.1. Biomedical Research
- 9.2.2. Therapeutic Delivery
- 9.2.3. Protein Production
- 9.1. Market Analysis, Insights and Forecast - by Method
- 10. Middle East and Africa Electroporation Instruments Industry Analysis, Insights and Forecast, 2020-2032
- 10.1. Market Analysis, Insights and Forecast - by Method
- 10.1.1. Reagent-based Method
- 10.1.2. Instrument-based Method
- 10.1.3. Other Methods
- 10.2. Market Analysis, Insights and Forecast - by Application
- 10.2.1. Biomedical Research
- 10.2.2. Therapeutic Delivery
- 10.2.3. Protein Production
- 10.1. Market Analysis, Insights and Forecast - by Method
- 11. South America Electroporation Instruments Industry Analysis, Insights and Forecast, 2020-2032
- 11.1. Market Analysis, Insights and Forecast - by Method
- 11.1.1. Reagent-based Method
- 11.1.2. Instrument-based Method
- 11.1.3. Other Methods
- 11.2. Market Analysis, Insights and Forecast - by Application
- 11.2.1. Biomedical Research
- 11.2.2. Therapeutic Delivery
- 11.2.3. Protein Production
- 11.1. Market Analysis, Insights and Forecast - by Method
- 12. Competitive Analysis
- 12.1. Company Profiles
- 12.1.1 Mirus Bio
- 12.1.1.1. Company Overview
- 12.1.1.2. Products
- 12.1.1.3. Company Financials
- 12.1.1.4. SWOT Analysis
- 12.1.2 Promega Corporation
- 12.1.2.1. Company Overview
- 12.1.2.2. Products
- 12.1.2.3. Company Financials
- 12.1.2.4. SWOT Analysis
- 12.1.3 Bio-Rad Laboratories Inc
- 12.1.3.1. Company Overview
- 12.1.3.2. Products
- 12.1.3.3. Company Financials
- 12.1.3.4. SWOT Analysis
- 12.1.4 Merck KGaA
- 12.1.4.1. Company Overview
- 12.1.4.2. Products
- 12.1.4.3. Company Financials
- 12.1.4.4. SWOT Analysis
- 12.1.5 Lonza Group
- 12.1.5.1. Company Overview
- 12.1.5.2. Products
- 12.1.5.3. Company Financials
- 12.1.5.4. SWOT Analysis
- 12.1.6 Altogen Biosystems
- 12.1.6.1. Company Overview
- 12.1.6.2. Products
- 12.1.6.3. Company Financials
- 12.1.6.4. SWOT Analysis
- 12.1.7 Polyplus-transfection SA
- 12.1.7.1. Company Overview
- 12.1.7.2. Products
- 12.1.7.3. Company Financials
- 12.1.7.4. SWOT Analysis
- 12.1.8 SignaGen Laboratories
- 12.1.8.1. Company Overview
- 12.1.8.2. Products
- 12.1.8.3. Company Financials
- 12.1.8.4. SWOT Analysis
- 12.1.9 Qiagen NV
- 12.1.9.1. Company Overview
- 12.1.9.2. Products
- 12.1.9.3. Company Financials
- 12.1.9.4. SWOT Analysis
- 12.1.10 Thermo Fisher Scientific
- 12.1.10.1. Company Overview
- 12.1.10.2. Products
- 12.1.10.3. Company Financials
- 12.1.10.4. SWOT Analysis
- 12.1.1 Mirus Bio
- 12.2. Market Entropy
- 12.2.1 Company's Key Areas Served
- 12.2.2 Recent Developments
- 12.3. Company Market Share Analysis 2025
- 12.3.1 Top 5 Companies Market Share Analysis
- 12.3.2 Top 3 Companies Market Share Analysis
- 12.4. List of Potential Customers
- 13. Research Methodology
List of Figures
- Figure 1: Global Electroporation Instruments Industry Revenue Breakdown (million, %) by Region 2025 & 2033
- Figure 2: Global Electroporation Instruments Industry Volume Breakdown (K Unit, %) by Region 2025 & 2033
- Figure 3: North America Electroporation Instruments Industry Revenue (million), by Method 2025 & 2033
- Figure 4: North America Electroporation Instruments Industry Volume (K Unit), by Method 2025 & 2033
- Figure 5: North America Electroporation Instruments Industry Revenue Share (%), by Method 2025 & 2033
- Figure 6: North America Electroporation Instruments Industry Volume Share (%), by Method 2025 & 2033
- Figure 7: North America Electroporation Instruments Industry Revenue (million), by Application 2025 & 2033
- Figure 8: North America Electroporation Instruments Industry Volume (K Unit), by Application 2025 & 2033
- Figure 9: North America Electroporation Instruments Industry Revenue Share (%), by Application 2025 & 2033
- Figure 10: North America Electroporation Instruments Industry Volume Share (%), by Application 2025 & 2033
- Figure 11: North America Electroporation Instruments Industry Revenue (million), by Country 2025 & 2033
- Figure 12: North America Electroporation Instruments Industry Volume (K Unit), by Country 2025 & 2033
- Figure 13: North America Electroporation Instruments Industry Revenue Share (%), by Country 2025 & 2033
- Figure 14: North America Electroporation Instruments Industry Volume Share (%), by Country 2025 & 2033
- Figure 15: Europe Electroporation Instruments Industry Revenue (million), by Method 2025 & 2033
- Figure 16: Europe Electroporation Instruments Industry Volume (K Unit), by Method 2025 & 2033
- Figure 17: Europe Electroporation Instruments Industry Revenue Share (%), by Method 2025 & 2033
- Figure 18: Europe Electroporation Instruments Industry Volume Share (%), by Method 2025 & 2033
- Figure 19: Europe Electroporation Instruments Industry Revenue (million), by Application 2025 & 2033
- Figure 20: Europe Electroporation Instruments Industry Volume (K Unit), by Application 2025 & 2033
- Figure 21: Europe Electroporation Instruments Industry Revenue Share (%), by Application 2025 & 2033
- Figure 22: Europe Electroporation Instruments Industry Volume Share (%), by Application 2025 & 2033
- Figure 23: Europe Electroporation Instruments Industry Revenue (million), by Country 2025 & 2033
- Figure 24: Europe Electroporation Instruments Industry Volume (K Unit), by Country 2025 & 2033
- Figure 25: Europe Electroporation Instruments Industry Revenue Share (%), by Country 2025 & 2033
- Figure 26: Europe Electroporation Instruments Industry Volume Share (%), by Country 2025 & 2033
- Figure 27: Asia Pacific Electroporation Instruments Industry Revenue (million), by Method 2025 & 2033
- Figure 28: Asia Pacific Electroporation Instruments Industry Volume (K Unit), by Method 2025 & 2033
- Figure 29: Asia Pacific Electroporation Instruments Industry Revenue Share (%), by Method 2025 & 2033
- Figure 30: Asia Pacific Electroporation Instruments Industry Volume Share (%), by Method 2025 & 2033
- Figure 31: Asia Pacific Electroporation Instruments Industry Revenue (million), by Application 2025 & 2033
- Figure 32: Asia Pacific Electroporation Instruments Industry Volume (K Unit), by Application 2025 & 2033
- Figure 33: Asia Pacific Electroporation Instruments Industry Revenue Share (%), by Application 2025 & 2033
- Figure 34: Asia Pacific Electroporation Instruments Industry Volume Share (%), by Application 2025 & 2033
- Figure 35: Asia Pacific Electroporation Instruments Industry Revenue (million), by Country 2025 & 2033
- Figure 36: Asia Pacific Electroporation Instruments Industry Volume (K Unit), by Country 2025 & 2033
- Figure 37: Asia Pacific Electroporation Instruments Industry Revenue Share (%), by Country 2025 & 2033
- Figure 38: Asia Pacific Electroporation Instruments Industry Volume Share (%), by Country 2025 & 2033
- Figure 39: Middle East and Africa Electroporation Instruments Industry Revenue (million), by Method 2025 & 2033
- Figure 40: Middle East and Africa Electroporation Instruments Industry Volume (K Unit), by Method 2025 & 2033
- Figure 41: Middle East and Africa Electroporation Instruments Industry Revenue Share (%), by Method 2025 & 2033
- Figure 42: Middle East and Africa Electroporation Instruments Industry Volume Share (%), by Method 2025 & 2033
- Figure 43: Middle East and Africa Electroporation Instruments Industry Revenue (million), by Application 2025 & 2033
- Figure 44: Middle East and Africa Electroporation Instruments Industry Volume (K Unit), by Application 2025 & 2033
- Figure 45: Middle East and Africa Electroporation Instruments Industry Revenue Share (%), by Application 2025 & 2033
- Figure 46: Middle East and Africa Electroporation Instruments Industry Volume Share (%), by Application 2025 & 2033
- Figure 47: Middle East and Africa Electroporation Instruments Industry Revenue (million), by Country 2025 & 2033
- Figure 48: Middle East and Africa Electroporation Instruments Industry Volume (K Unit), by Country 2025 & 2033
- Figure 49: Middle East and Africa Electroporation Instruments Industry Revenue Share (%), by Country 2025 & 2033
- Figure 50: Middle East and Africa Electroporation Instruments Industry Volume Share (%), by Country 2025 & 2033
- Figure 51: South America Electroporation Instruments Industry Revenue (million), by Method 2025 & 2033
- Figure 52: South America Electroporation Instruments Industry Volume (K Unit), by Method 2025 & 2033
- Figure 53: South America Electroporation Instruments Industry Revenue Share (%), by Method 2025 & 2033
- Figure 54: South America Electroporation Instruments Industry Volume Share (%), by Method 2025 & 2033
- Figure 55: South America Electroporation Instruments Industry Revenue (million), by Application 2025 & 2033
- Figure 56: South America Electroporation Instruments Industry Volume (K Unit), by Application 2025 & 2033
- Figure 57: South America Electroporation Instruments Industry Revenue Share (%), by Application 2025 & 2033
- Figure 58: South America Electroporation Instruments Industry Volume Share (%), by Application 2025 & 2033
- Figure 59: South America Electroporation Instruments Industry Revenue (million), by Country 2025 & 2033
- Figure 60: South America Electroporation Instruments Industry Volume (K Unit), by Country 2025 & 2033
- Figure 61: South America Electroporation Instruments Industry Revenue Share (%), by Country 2025 & 2033
- Figure 62: South America Electroporation Instruments Industry Volume Share (%), by Country 2025 & 2033
List of Tables
- Table 1: Global Electroporation Instruments Industry Revenue million Forecast, by Method 2020 & 2033
- Table 2: Global Electroporation Instruments Industry Volume K Unit Forecast, by Method 2020 & 2033
- Table 3: Global Electroporation Instruments Industry Revenue million Forecast, by Application 2020 & 2033
- Table 4: Global Electroporation Instruments Industry Volume K Unit Forecast, by Application 2020 & 2033
- Table 5: Global Electroporation Instruments Industry Revenue million Forecast, by Region 2020 & 2033
- Table 6: Global Electroporation Instruments Industry Volume K Unit Forecast, by Region 2020 & 2033
- Table 7: Global Electroporation Instruments Industry Revenue million Forecast, by Method 2020 & 2033
- Table 8: Global Electroporation Instruments Industry Volume K Unit Forecast, by Method 2020 & 2033
- Table 9: Global Electroporation Instruments Industry Revenue million Forecast, by Application 2020 & 2033
- Table 10: Global Electroporation Instruments Industry Volume K Unit Forecast, by Application 2020 & 2033
- Table 11: Global Electroporation Instruments Industry Revenue million Forecast, by Country 2020 & 2033
- Table 12: Global Electroporation Instruments Industry Volume K Unit Forecast, by Country 2020 & 2033
- Table 13: United States Electroporation Instruments Industry Revenue (million) Forecast, by Application 2020 & 2033
- Table 14: United States Electroporation Instruments Industry Volume (K Unit) Forecast, by Application 2020 & 2033
- Table 15: Canada Electroporation Instruments Industry Revenue (million) Forecast, by Application 2020 & 2033
- Table 16: Canada Electroporation Instruments Industry Volume (K Unit) Forecast, by Application 2020 & 2033
- Table 17: Mexico Electroporation Instruments Industry Revenue (million) Forecast, by Application 2020 & 2033
- Table 18: Mexico Electroporation Instruments Industry Volume (K Unit) Forecast, by Application 2020 & 2033
- Table 19: Global Electroporation Instruments Industry Revenue million Forecast, by Method 2020 & 2033
- Table 20: Global Electroporation Instruments Industry Volume K Unit Forecast, by Method 2020 & 2033
- Table 21: Global Electroporation Instruments Industry Revenue million Forecast, by Application 2020 & 2033
- Table 22: Global Electroporation Instruments Industry Volume K Unit Forecast, by Application 2020 & 2033
- Table 23: Global Electroporation Instruments Industry Revenue million Forecast, by Country 2020 & 2033
- Table 24: Global Electroporation Instruments Industry Volume K Unit Forecast, by Country 2020 & 2033
- Table 25: Germany Electroporation Instruments Industry Revenue (million) Forecast, by Application 2020 & 2033
- Table 26: Germany Electroporation Instruments Industry Volume (K Unit) Forecast, by Application 2020 & 2033
- Table 27: United Kingdom Electroporation Instruments Industry Revenue (million) Forecast, by Application 2020 & 2033
- Table 28: United Kingdom Electroporation Instruments Industry Volume (K Unit) Forecast, by Application 2020 & 2033
- Table 29: France Electroporation Instruments Industry Revenue (million) Forecast, by Application 2020 & 2033
- Table 30: France Electroporation Instruments Industry Volume (K Unit) Forecast, by Application 2020 & 2033
- Table 31: Italy Electroporation Instruments Industry Revenue (million) Forecast, by Application 2020 & 2033
- Table 32: Italy Electroporation Instruments Industry Volume (K Unit) Forecast, by Application 2020 & 2033
- Table 33: Spain Electroporation Instruments Industry Revenue (million) Forecast, by Application 2020 & 2033
- Table 34: Spain Electroporation Instruments Industry Volume (K Unit) Forecast, by Application 2020 & 2033
- Table 35: Rest of Europe Electroporation Instruments Industry Revenue (million) Forecast, by Application 2020 & 2033
- Table 36: Rest of Europe Electroporation Instruments Industry Volume (K Unit) Forecast, by Application 2020 & 2033
- Table 37: Global Electroporation Instruments Industry Revenue million Forecast, by Method 2020 & 2033
- Table 38: Global Electroporation Instruments Industry Volume K Unit Forecast, by Method 2020 & 2033
- Table 39: Global Electroporation Instruments Industry Revenue million Forecast, by Application 2020 & 2033
- Table 40: Global Electroporation Instruments Industry Volume K Unit Forecast, by Application 2020 & 2033
- Table 41: Global Electroporation Instruments Industry Revenue million Forecast, by Country 2020 & 2033
- Table 42: Global Electroporation Instruments Industry Volume K Unit Forecast, by Country 2020 & 2033
- Table 43: China Electroporation Instruments Industry Revenue (million) Forecast, by Application 2020 & 2033
- Table 44: China Electroporation Instruments Industry Volume (K Unit) Forecast, by Application 2020 & 2033
- Table 45: Japan Electroporation Instruments Industry Revenue (million) Forecast, by Application 2020 & 2033
- Table 46: Japan Electroporation Instruments Industry Volume (K Unit) Forecast, by Application 2020 & 2033
- Table 47: India Electroporation Instruments Industry Revenue (million) Forecast, by Application 2020 & 2033
- Table 48: India Electroporation Instruments Industry Volume (K Unit) Forecast, by Application 2020 & 2033
- Table 49: Australia Electroporation Instruments Industry Revenue (million) Forecast, by Application 2020 & 2033
- Table 50: Australia Electroporation Instruments Industry Volume (K Unit) Forecast, by Application 2020 & 2033
- Table 51: South Korea Electroporation Instruments Industry Revenue (million) Forecast, by Application 2020 & 2033
- Table 52: South Korea Electroporation Instruments Industry Volume (K Unit) Forecast, by Application 2020 & 2033
- Table 53: Rest of Asia Pacific Electroporation Instruments Industry Revenue (million) Forecast, by Application 2020 & 2033
- Table 54: Rest of Asia Pacific Electroporation Instruments Industry Volume (K Unit) Forecast, by Application 2020 & 2033
- Table 55: Global Electroporation Instruments Industry Revenue million Forecast, by Method 2020 & 2033
- Table 56: Global Electroporation Instruments Industry Volume K Unit Forecast, by Method 2020 & 2033
- Table 57: Global Electroporation Instruments Industry Revenue million Forecast, by Application 2020 & 2033
- Table 58: Global Electroporation Instruments Industry Volume K Unit Forecast, by Application 2020 & 2033
- Table 59: Global Electroporation Instruments Industry Revenue million Forecast, by Country 2020 & 2033
- Table 60: Global Electroporation Instruments Industry Volume K Unit Forecast, by Country 2020 & 2033
- Table 61: GCC Electroporation Instruments Industry Revenue (million) Forecast, by Application 2020 & 2033
- Table 62: GCC Electroporation Instruments Industry Volume (K Unit) Forecast, by Application 2020 & 2033
- Table 63: South Africa Electroporation Instruments Industry Revenue (million) Forecast, by Application 2020 & 2033
- Table 64: South Africa Electroporation Instruments Industry Volume (K Unit) Forecast, by Application 2020 & 2033
- Table 65: Rest of Middle East and Africa Electroporation Instruments Industry Revenue (million) Forecast, by Application 2020 & 2033
- Table 66: Rest of Middle East and Africa Electroporation Instruments Industry Volume (K Unit) Forecast, by Application 2020 & 2033
- Table 67: Global Electroporation Instruments Industry Revenue million Forecast, by Method 2020 & 2033
- Table 68: Global Electroporation Instruments Industry Volume K Unit Forecast, by Method 2020 & 2033
- Table 69: Global Electroporation Instruments Industry Revenue million Forecast, by Application 2020 & 2033
- Table 70: Global Electroporation Instruments Industry Volume K Unit Forecast, by Application 2020 & 2033
- Table 71: Global Electroporation Instruments Industry Revenue million Forecast, by Country 2020 & 2033
- Table 72: Global Electroporation Instruments Industry Volume K Unit Forecast, by Country 2020 & 2033
- Table 73: Brazil Electroporation Instruments Industry Revenue (million) Forecast, by Application 2020 & 2033
- Table 74: Brazil Electroporation Instruments Industry Volume (K Unit) Forecast, by Application 2020 & 2033
- Table 75: Argentina Electroporation Instruments Industry Revenue (million) Forecast, by Application 2020 & 2033
- Table 76: Argentina Electroporation Instruments Industry Volume (K Unit) Forecast, by Application 2020 & 2033
- Table 77: Rest of South America Electroporation Instruments Industry Revenue (million) Forecast, by Application 2020 & 2033
- Table 78: Rest of South America Electroporation Instruments Industry Volume (K Unit) Forecast, by Application 2020 & 2033
Frequently Asked Questions
1. What is the projected Compound Annual Growth Rate (CAGR) of the Electroporation Instruments Industry?
The projected CAGR is approximately 7.73%.
2. Which companies are prominent players in the Electroporation Instruments Industry?
Key companies in the market include Mirus Bio, Promega Corporation, Bio-Rad Laboratories Inc, Merck KGaA, Lonza Group, Altogen Biosystems, Polyplus-transfection SA, SignaGen Laboratories, Qiagen NV, Thermo Fisher Scientific.
3. What are the main segments of the Electroporation Instruments Industry?
The market segments include Method, Application.
4. Can you provide details about the market size?
The market size is estimated to be USD 974.92 million as of 2022.
5. What are some drivers contributing to market growth?
Rising Incidences of Chronic Diseases; Increase in Research & Development in the Field of Cell Based Therapies.
6. What are the notable trends driving market growth?
Reagent-based Method is Showing Significant Growth in the Transfection Technologies Market.
7. Are there any restraints impacting market growth?
High Cost of Transfection Technology Instruments.
8. Can you provide examples of recent developments in the market?
September 2022: Polyplus, a leading upstream solutions provider for advanced biologic and cell and gene therapy production from research to commercial grade, continues to build out the mRNA support portfolio. The team has launched the in vivo-jetRNA+ transfection reagent for in vivo mRNA delivery using a preformed liposome.
9. What pricing options are available for accessing the report?
Pricing options include single-user, multi-user, and enterprise licenses priced at USD 4750, USD 5250, and USD 8750 respectively.
10. Is the market size provided in terms of value or volume?
The market size is provided in terms of value, measured in million and volume, measured in K Unit.
11. Are there any specific market keywords associated with the report?
Yes, the market keyword associated with the report is "Electroporation Instruments Industry," which aids in identifying and referencing the specific market segment covered.
12. How do I determine which pricing option suits my needs best?
The pricing options vary based on user requirements and access needs. Individual users may opt for single-user licenses, while businesses requiring broader access may choose multi-user or enterprise licenses for cost-effective access to the report.
13. Are there any additional resources or data provided in the Electroporation Instruments Industry report?
While the report offers comprehensive insights, it's advisable to review the specific contents or supplementary materials provided to ascertain if additional resources or data are available.
14. How can I stay updated on further developments or reports in the Electroporation Instruments Industry?
To stay informed about further developments, trends, and reports in the Electroporation Instruments Industry, consider subscribing to industry newsletters, following relevant companies and organizations, or regularly checking reputable industry news sources and publications.
Methodology
Step 1 - Identification of Relevant Samples Size from Population Database


Step 2 - Approaches for Defining Global Market Size (Value, Volume* & Price*)

Note*: In applicable scenarios
Step 3 - Data Sources
Primary Research
- Web Analytics
- Survey Reports
- Research Institute
- Latest Research Reports
- Opinion Leaders
Secondary Research
- Annual Reports
- White Paper
- Latest Press Release
- Industry Association
- Paid Database
- Investor Presentations

Step 4 - Data Triangulation
Involves using different sources of information in order to increase the validity of a study
These sources are likely to be stakeholders in a program - participants, other researchers, program staff, other community members, and so on.
Then we put all data in single framework & apply various statistical tools to find out the dynamic on the market.
During the analysis stage, feedback from the stakeholder groups would be compared to determine areas of agreement as well as areas of divergence