

Key Insights
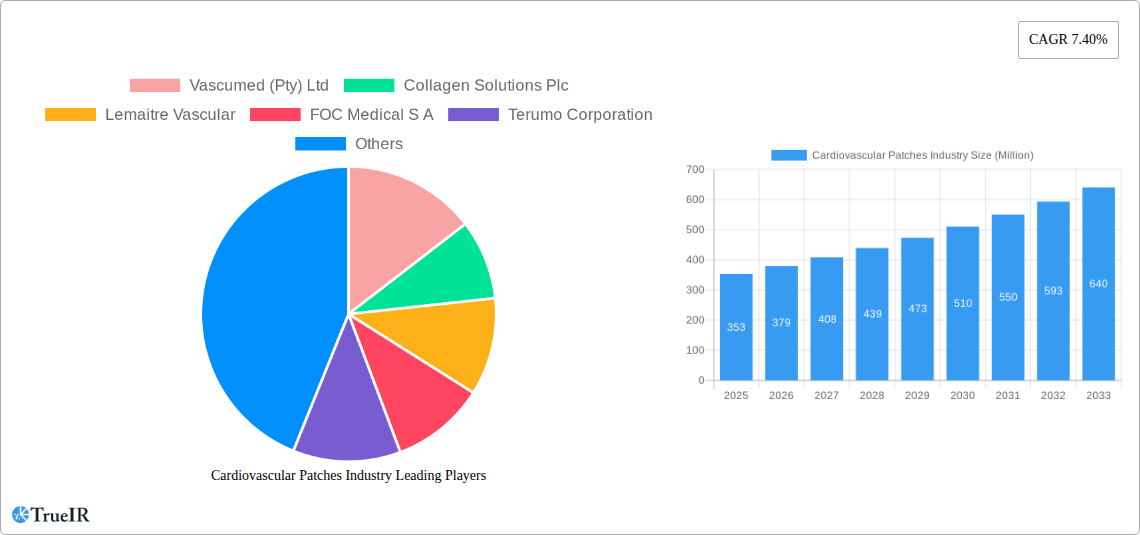
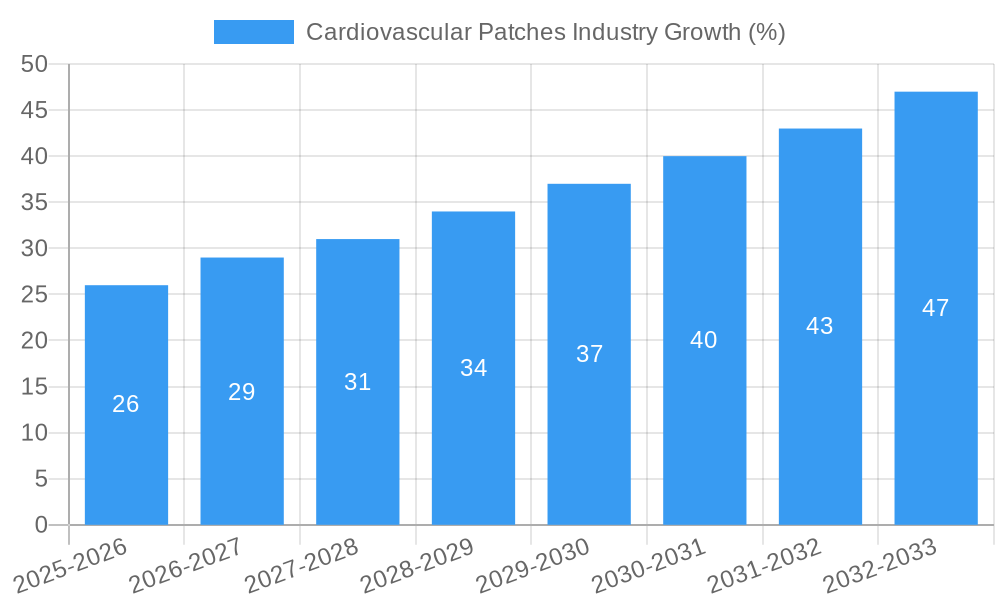
The global cardiovascular patches market, valued at $353 million in 2025, is projected to experience robust growth, driven by a compound annual growth rate (CAGR) of 7.40% from 2025 to 2033. This expansion is fueled by several key factors. The rising prevalence of cardiovascular diseases, including aortic aneurysms and peripheral artery disease, necessitates increased surgical interventions, thereby boosting demand for vascular patches. Advancements in patch materials, such as the development of biocompatible and biodegradable options like biologic vascular patches, are improving surgical outcomes and patient recovery times, further stimulating market growth. Furthermore, the growing adoption of minimally invasive surgical techniques is streamlining procedures and reducing hospital stays, contributing to market expansion. The increasing geriatric population, susceptible to cardiovascular complications, also significantly contributes to the market's upward trajectory. Geographic expansion, particularly in emerging economies with increasing healthcare expenditure, presents lucrative opportunities for market players.
However, the market faces certain challenges. High costs associated with advanced cardiovascular patch technologies can limit accessibility, particularly in low- and middle-income countries. Stringent regulatory approvals and the potential for complications post-surgery can also hinder market growth. Competition among established players and emerging market entrants is intensifying, necessitating continuous innovation and product differentiation. Nevertheless, the overall market outlook remains positive, driven by the unmet clinical needs, technological advancements, and a growing awareness of cardiovascular health. The market segmentation by material (biologic vs. synthetic) and application (carotid endarterectomy, aortic aneurysms, vascular bypass surgery, etc.) offers valuable insights for targeted market strategies. Companies such as Vascumed, Collagen Solutions, Lemaitre Vascular, and others are well-positioned to capitalize on the expanding market opportunities.
Cardiovascular Patches Industry Report: 2019-2033
This comprehensive report provides a detailed analysis of the global cardiovascular patches market, covering market size, growth drivers, competitive landscape, and future outlook from 2019 to 2033. The study period is 2019-2033, with 2025 as the base and estimated year. The forecast period spans 2025-2033, and the historical period encompasses 2019-2024. This in-depth analysis will equip stakeholders with the insights needed to navigate this dynamic market.
Cardiovascular Patches Industry Market Structure & Competitive Landscape
The cardiovascular patches market is characterized by a moderately concentrated structure, with a few large multinational corporations dominating alongside several smaller specialized players. The Herfindahl-Hirschman Index (HHI) is estimated at xx, indicating a moderately competitive landscape. Key innovation drivers include advancements in biomaterials, minimally invasive surgical techniques, and the rising prevalence of cardiovascular diseases. Regulatory approvals, particularly from bodies like the FDA, significantly impact market entry and product adoption. Substitute products, such as stents and other endovascular devices, present competitive pressure. The market is segmented by end-users, primarily hospitals and cardiac surgery centers. Mergers and acquisitions (M&A) activity has been moderate, with xx major transactions recorded between 2019 and 2024, primarily driven by strategic acquisitions aimed at expanding product portfolios and geographical reach.
- Market Concentration: Moderately concentrated, with an estimated HHI of xx.
- Innovation Drivers: Advancements in biomaterials, minimally invasive surgery, and increasing prevalence of cardiovascular diseases.
- Regulatory Impacts: Significant influence on market entry and product adoption.
- Product Substitutes: Stents and other endovascular devices.
- End-User Segmentation: Primarily hospitals and cardiac surgery centers.
- M&A Trends: Moderate activity, xx major transactions (2019-2024), driven by portfolio expansion and geographical reach.
Cardiovascular Patches Industry Market Trends & Opportunities
The global cardiovascular patches market is experiencing robust growth, driven by factors such as the rising prevalence of cardiovascular diseases, increasing geriatric population, technological advancements in patch materials and delivery systems, and growing adoption of minimally invasive surgical procedures. The market size is projected to reach xx Million by 2033, exhibiting a Compound Annual Growth Rate (CAGR) of xx% during the forecast period (2025-2033). Market penetration rates vary significantly across different regions and applications, with the highest penetration observed in developed markets like North America and Europe. The shift towards biocompatible and biodegradable materials is a significant trend, alongside the development of patches with enhanced hemostatic properties. Competitive dynamics are shaped by technological innovation, strategic partnerships, and geographical expansion.
Dominant Markets & Segments in Cardiovascular Patches Industry
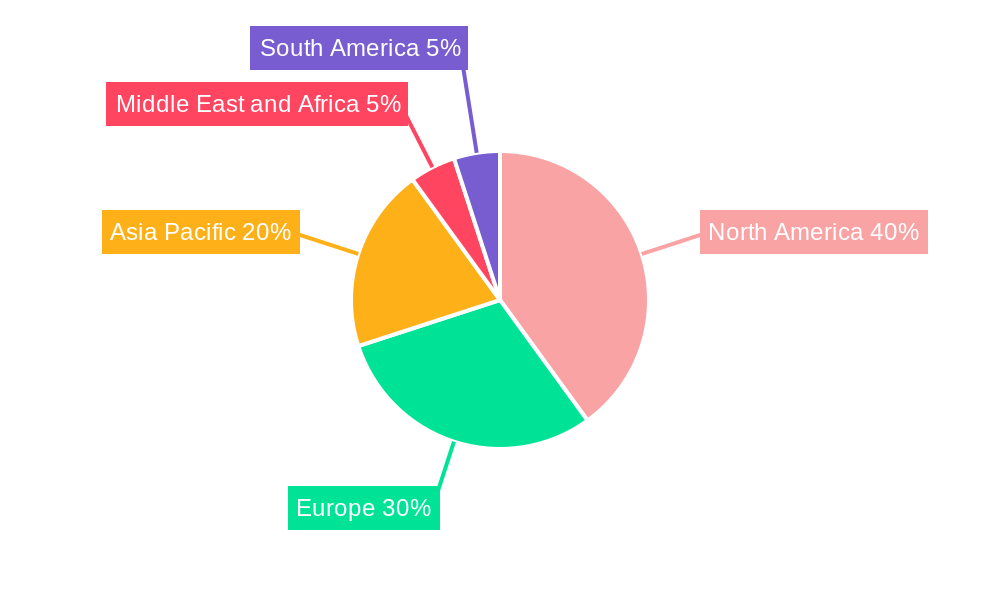
The North American region currently dominates the cardiovascular patches market, driven by factors such as high healthcare expenditure, advanced healthcare infrastructure, and a large patient pool. Within the material segment, synthetic vascular patches currently hold the largest market share, owing to their superior durability and cost-effectiveness. However, the biologic vascular patch segment is experiencing faster growth due to its enhanced biocompatibility and reduced risk of thrombosis. In terms of application, vascular bypass surgery accounts for the largest segment, followed by aortic aneurysms and carotid endarterectomy.
- Key Growth Drivers (North America): Advanced healthcare infrastructure, high healthcare expenditure, large patient pool.
- Key Growth Drivers (Biologic Patches): Enhanced biocompatibility, reduced risk of thrombosis.
- Key Growth Drivers (Synthetic Patches): Superior durability, cost-effectiveness.
- Key Growth Drivers (Vascular Bypass Surgery): Increasing prevalence of peripheral artery disease, growing demand for minimally invasive procedures.
Cardiovascular Patches Industry Product Analysis
Significant advancements in cardiovascular patch technology have led to the development of biocompatible, biodegradable, and customizable patches. These innovations offer improved clinical outcomes, reduced complications, and enhanced patient comfort. The market is witnessing the introduction of patches with integrated drug delivery systems for targeted therapy and faster healing. Products are differentiated based on material properties, size, shape, and specific applications, leading to a diverse product portfolio catering to various patient needs and clinical settings. The market is experiencing a shift towards less invasive and faster recovery techniques, which has greatly improved patient satisfaction.
Key Drivers, Barriers & Challenges in Cardiovascular Patches Industry
Key Drivers:
- Rising prevalence of cardiovascular diseases.
- Technological advancements in biomaterials and minimally invasive procedures.
- Increasing geriatric population.
- Favorable regulatory environment in key markets.
Challenges:
- Stringent regulatory requirements and approval processes.
- High cost of production and associated healthcare expenses.
- Intense competition from established players and emerging companies.
- Potential for complications and adverse events associated with patch implantation.
Growth Drivers in the Cardiovascular Patches Industry Market
The market's growth is primarily propelled by the escalating prevalence of cardiovascular diseases globally. Technological advancements resulting in more biocompatible and effective patches, alongside the expanding geriatric population requiring such treatments, are significant factors. Favorable regulatory environments in key markets further stimulate growth.
Challenges Impacting Cardiovascular Patches Industry Growth
The cardiovascular patches market faces challenges such as stringent regulatory hurdles, increasing production costs, and intense competition. These factors can potentially impede market growth and profitability. Supply chain disruptions also contribute to the difficulties faced by players in the market.
Key Players Shaping the Cardiovascular Patches Industry Market
- Vascumed (Pty) Ltd
- Collagen Solutions Plc
- Lemaitre Vascular
- FOC Medical S A
- Terumo Corporation
- Getinge AB
- Edwards Lifesciences
- Baxter International
- B Braun SE
- BD
- Artivion
- W L Gore & Associates
Significant Cardiovascular Patches Industry Industry Milestones
- June 2021: Axio Biosolutions received FDA approval for its hemostatic Axiostat patch.
- May 2022: Vivasure Medical secured USD 22 Million in Series D financing for its absorbable patch devices.
Future Outlook for Cardiovascular Patches Industry Market
The cardiovascular patches market is poised for continued growth, driven by technological innovations, expanding applications, and a rising prevalence of cardiovascular diseases. Strategic partnerships, mergers and acquisitions, and a focus on developing advanced biomaterials will shape the market's future. The market presents significant opportunities for companies that can offer innovative products with improved efficacy, safety, and cost-effectiveness.
Cardiovascular Patches Industry Segmentation
-
1. Material
- 1.1. Biologic Vascular Patches
- 1.2. Synthetic Vascular Patches
-
2. Application
- 2.1. Carotid Endarterectomy
- 2.2. Aortic Aneurysms
- 2.3. Profundaplasty
- 2.4. Other Applications
Cardiovascular Patches Industry Segmentation By Geography
-
1. North America
- 1.1. United States
- 1.2. Canada
- 1.3. Mexico
-
2. Europe
- 2.1. United Kingdom
- 2.2. Germany
- 2.3. France
- 2.4. Italy
- 2.5. Spain
- 2.6. Rest of Europe
-
3. Asia Pacific
- 3.1. China
- 3.2. Japan
- 3.3. India
- 3.4. Australia
- 3.5. South Korea
- 3.6. Rest of Asia Pacific
-
4. Middle East and Africa
- 4.1. GCC
- 4.2. South Africa
- 4.3. Rest of Middle East and Africa
-
5. South America
- 5.1. Brazil
- 5.2. Argentina
- 5.3. Rest of South America
Cardiovascular Patches Industry REPORT HIGHLIGHTS
| Aspects | Details |
|---|---|
| Study Period | 2019-2033 |
| Base Year | 2024 |
| Estimated Year | 2025 |
| Forecast Period | 2025-2033 |
| Historical Period | 2019-2024 |
| Growth Rate | CAGR of 7.40% from 2019-2033 |
| Segmentation |
|
Table of Contents
- 1. Introduction
- 1.1. Research Scope
- 1.2. Market Segmentation
- 1.3. Research Methodology
- 1.4. Definitions and Assumptions
- 2. Executive Summary
- 2.1. Introduction
- 3. Market Dynamics
- 3.1. Introduction
- 3.2. Market Drivers
- 3.2.1. Rapidly Growing Geriatric Population and Increase in the Prevalence of Vascular Diseases; Increasing Adoption of Biological Patches
- 3.3. Market Restrains
- 3.3.1. Risk of Immune Response and Serious Complications; Product Failures and Recalls
- 3.4. Market Trends
- 3.4.1. Aortic Aneurysms Segment Expects to Register a Significant Growth Over the Forecast Period
- 4. Market Factor Analysis
- 4.1. Porters Five Forces
- 4.2. Supply/Value Chain
- 4.3. PESTEL analysis
- 4.4. Market Entropy
- 4.5. Patent/Trademark Analysis
- 5. Global Cardiovascular Patches Industry Analysis, Insights and Forecast, 2019-2031
- 5.1. Market Analysis, Insights and Forecast - by Material
- 5.1.1. Biologic Vascular Patches
- 5.1.2. Synthetic Vascular Patches
- 5.2. Market Analysis, Insights and Forecast - by Application
- 5.2.1. Carotid Endarterectomy
- 5.2.2. Aortic Aneurysms
- 5.2.3. Profundaplasty
- 5.2.4. Other Applications
- 5.3. Market Analysis, Insights and Forecast - by Region
- 5.3.1. North America
- 5.3.2. Europe
- 5.3.3. Asia Pacific
- 5.3.4. Middle East and Africa
- 5.3.5. South America
- 5.1. Market Analysis, Insights and Forecast - by Material
- 6. North America Cardiovascular Patches Industry Analysis, Insights and Forecast, 2019-2031
- 6.1. Market Analysis, Insights and Forecast - by Material
- 6.1.1. Biologic Vascular Patches
- 6.1.2. Synthetic Vascular Patches
- 6.2. Market Analysis, Insights and Forecast - by Application
- 6.2.1. Carotid Endarterectomy
- 6.2.2. Aortic Aneurysms
- 6.2.3. Profundaplasty
- 6.2.4. Other Applications
- 6.1. Market Analysis, Insights and Forecast - by Material
- 7. Europe Cardiovascular Patches Industry Analysis, Insights and Forecast, 2019-2031
- 7.1. Market Analysis, Insights and Forecast - by Material
- 7.1.1. Biologic Vascular Patches
- 7.1.2. Synthetic Vascular Patches
- 7.2. Market Analysis, Insights and Forecast - by Application
- 7.2.1. Carotid Endarterectomy
- 7.2.2. Aortic Aneurysms
- 7.2.3. Profundaplasty
- 7.2.4. Other Applications
- 7.1. Market Analysis, Insights and Forecast - by Material
- 8. Asia Pacific Cardiovascular Patches Industry Analysis, Insights and Forecast, 2019-2031
- 8.1. Market Analysis, Insights and Forecast - by Material
- 8.1.1. Biologic Vascular Patches
- 8.1.2. Synthetic Vascular Patches
- 8.2. Market Analysis, Insights and Forecast - by Application
- 8.2.1. Carotid Endarterectomy
- 8.2.2. Aortic Aneurysms
- 8.2.3. Profundaplasty
- 8.2.4. Other Applications
- 8.1. Market Analysis, Insights and Forecast - by Material
- 9. Middle East and Africa Cardiovascular Patches Industry Analysis, Insights and Forecast, 2019-2031
- 9.1. Market Analysis, Insights and Forecast - by Material
- 9.1.1. Biologic Vascular Patches
- 9.1.2. Synthetic Vascular Patches
- 9.2. Market Analysis, Insights and Forecast - by Application
- 9.2.1. Carotid Endarterectomy
- 9.2.2. Aortic Aneurysms
- 9.2.3. Profundaplasty
- 9.2.4. Other Applications
- 9.1. Market Analysis, Insights and Forecast - by Material
- 10. South America Cardiovascular Patches Industry Analysis, Insights and Forecast, 2019-2031
- 10.1. Market Analysis, Insights and Forecast - by Material
- 10.1.1. Biologic Vascular Patches
- 10.1.2. Synthetic Vascular Patches
- 10.2. Market Analysis, Insights and Forecast - by Application
- 10.2.1. Carotid Endarterectomy
- 10.2.2. Aortic Aneurysms
- 10.2.3. Profundaplasty
- 10.2.4. Other Applications
- 10.1. Market Analysis, Insights and Forecast - by Material
- 11. North America Cardiovascular Patches Industry Analysis, Insights and Forecast, 2019-2031
- 11.1. Market Analysis, Insights and Forecast - By Country/Sub-region
- 11.1.1 United States
- 11.1.2 Canada
- 11.1.3 Mexico
- 12. Europe Cardiovascular Patches Industry Analysis, Insights and Forecast, 2019-2031
- 12.1. Market Analysis, Insights and Forecast - By Country/Sub-region
- 12.1.1 United Kingdom
- 12.1.2 Germany
- 12.1.3 France
- 12.1.4 Italy
- 12.1.5 Spain
- 12.1.6 Rest of Europe
- 13. Asia Pacific Cardiovascular Patches Industry Analysis, Insights and Forecast, 2019-2031
- 13.1. Market Analysis, Insights and Forecast - By Country/Sub-region
- 13.1.1 China
- 13.1.2 Japan
- 13.1.3 India
- 13.1.4 Australia
- 13.1.5 South Korea
- 13.1.6 Rest of Asia Pacific
- 14. Middle East and Africa Cardiovascular Patches Industry Analysis, Insights and Forecast, 2019-2031
- 14.1. Market Analysis, Insights and Forecast - By Country/Sub-region
- 14.1.1 GCC
- 14.1.2 South Africa
- 14.1.3 Rest of Middle East and Africa
- 15. South America Cardiovascular Patches Industry Analysis, Insights and Forecast, 2019-2031
- 15.1. Market Analysis, Insights and Forecast - By Country/Sub-region
- 15.1.1 Brazil
- 15.1.2 Argentina
- 15.1.3 Rest of South America
- 16. Competitive Analysis
- 16.1. Global Market Share Analysis 2024
- 16.2. Company Profiles
- 16.2.1 Vascumed (Pty) Ltd
- 16.2.1.1. Overview
- 16.2.1.2. Products
- 16.2.1.3. SWOT Analysis
- 16.2.1.4. Recent Developments
- 16.2.1.5. Financials (Based on Availability)
- 16.2.2 Collagen Solutions Plc
- 16.2.2.1. Overview
- 16.2.2.2. Products
- 16.2.2.3. SWOT Analysis
- 16.2.2.4. Recent Developments
- 16.2.2.5. Financials (Based on Availability)
- 16.2.3 Lemaitre Vascular
- 16.2.3.1. Overview
- 16.2.3.2. Products
- 16.2.3.3. SWOT Analysis
- 16.2.3.4. Recent Developments
- 16.2.3.5. Financials (Based on Availability)
- 16.2.4 FOC Medical S A
- 16.2.4.1. Overview
- 16.2.4.2. Products
- 16.2.4.3. SWOT Analysis
- 16.2.4.4. Recent Developments
- 16.2.4.5. Financials (Based on Availability)
- 16.2.5 Terumo Corporation
- 16.2.5.1. Overview
- 16.2.5.2. Products
- 16.2.5.3. SWOT Analysis
- 16.2.5.4. Recent Developments
- 16.2.5.5. Financials (Based on Availability)
- 16.2.6 Getinge AB
- 16.2.6.1. Overview
- 16.2.6.2. Products
- 16.2.6.3. SWOT Analysis
- 16.2.6.4. Recent Developments
- 16.2.6.5. Financials (Based on Availability)
- 16.2.7 Edwards Lifesciences
- 16.2.7.1. Overview
- 16.2.7.2. Products
- 16.2.7.3. SWOT Analysis
- 16.2.7.4. Recent Developments
- 16.2.7.5. Financials (Based on Availability)
- 16.2.8 Baxter International
- 16.2.8.1. Overview
- 16.2.8.2. Products
- 16.2.8.3. SWOT Analysis
- 16.2.8.4. Recent Developments
- 16.2.8.5. Financials (Based on Availability)
- 16.2.9 B Braun SE
- 16.2.9.1. Overview
- 16.2.9.2. Products
- 16.2.9.3. SWOT Analysis
- 16.2.9.4. Recent Developments
- 16.2.9.5. Financials (Based on Availability)
- 16.2.10 BD
- 16.2.10.1. Overview
- 16.2.10.2. Products
- 16.2.10.3. SWOT Analysis
- 16.2.10.4. Recent Developments
- 16.2.10.5. Financials (Based on Availability)
- 16.2.11 Artivion
- 16.2.11.1. Overview
- 16.2.11.2. Products
- 16.2.11.3. SWOT Analysis
- 16.2.11.4. Recent Developments
- 16.2.11.5. Financials (Based on Availability)
- 16.2.12 W L Gore & Associates
- 16.2.12.1. Overview
- 16.2.12.2. Products
- 16.2.12.3. SWOT Analysis
- 16.2.12.4. Recent Developments
- 16.2.12.5. Financials (Based on Availability)
- 16.2.1 Vascumed (Pty) Ltd
List of Figures
- Figure 1: Global Cardiovascular Patches Industry Revenue Breakdown (Million, %) by Region 2024 & 2032
- Figure 2: North America Cardiovascular Patches Industry Revenue (Million), by Country 2024 & 2032
- Figure 3: North America Cardiovascular Patches Industry Revenue Share (%), by Country 2024 & 2032
- Figure 4: Europe Cardiovascular Patches Industry Revenue (Million), by Country 2024 & 2032
- Figure 5: Europe Cardiovascular Patches Industry Revenue Share (%), by Country 2024 & 2032
- Figure 6: Asia Pacific Cardiovascular Patches Industry Revenue (Million), by Country 2024 & 2032
- Figure 7: Asia Pacific Cardiovascular Patches Industry Revenue Share (%), by Country 2024 & 2032
- Figure 8: Middle East and Africa Cardiovascular Patches Industry Revenue (Million), by Country 2024 & 2032
- Figure 9: Middle East and Africa Cardiovascular Patches Industry Revenue Share (%), by Country 2024 & 2032
- Figure 10: South America Cardiovascular Patches Industry Revenue (Million), by Country 2024 & 2032
- Figure 11: South America Cardiovascular Patches Industry Revenue Share (%), by Country 2024 & 2032
- Figure 12: North America Cardiovascular Patches Industry Revenue (Million), by Material 2024 & 2032
- Figure 13: North America Cardiovascular Patches Industry Revenue Share (%), by Material 2024 & 2032
- Figure 14: North America Cardiovascular Patches Industry Revenue (Million), by Application 2024 & 2032
- Figure 15: North America Cardiovascular Patches Industry Revenue Share (%), by Application 2024 & 2032
- Figure 16: North America Cardiovascular Patches Industry Revenue (Million), by Country 2024 & 2032
- Figure 17: North America Cardiovascular Patches Industry Revenue Share (%), by Country 2024 & 2032
- Figure 18: Europe Cardiovascular Patches Industry Revenue (Million), by Material 2024 & 2032
- Figure 19: Europe Cardiovascular Patches Industry Revenue Share (%), by Material 2024 & 2032
- Figure 20: Europe Cardiovascular Patches Industry Revenue (Million), by Application 2024 & 2032
- Figure 21: Europe Cardiovascular Patches Industry Revenue Share (%), by Application 2024 & 2032
- Figure 22: Europe Cardiovascular Patches Industry Revenue (Million), by Country 2024 & 2032
- Figure 23: Europe Cardiovascular Patches Industry Revenue Share (%), by Country 2024 & 2032
- Figure 24: Asia Pacific Cardiovascular Patches Industry Revenue (Million), by Material 2024 & 2032
- Figure 25: Asia Pacific Cardiovascular Patches Industry Revenue Share (%), by Material 2024 & 2032
- Figure 26: Asia Pacific Cardiovascular Patches Industry Revenue (Million), by Application 2024 & 2032
- Figure 27: Asia Pacific Cardiovascular Patches Industry Revenue Share (%), by Application 2024 & 2032
- Figure 28: Asia Pacific Cardiovascular Patches Industry Revenue (Million), by Country 2024 & 2032
- Figure 29: Asia Pacific Cardiovascular Patches Industry Revenue Share (%), by Country 2024 & 2032
- Figure 30: Middle East and Africa Cardiovascular Patches Industry Revenue (Million), by Material 2024 & 2032
- Figure 31: Middle East and Africa Cardiovascular Patches Industry Revenue Share (%), by Material 2024 & 2032
- Figure 32: Middle East and Africa Cardiovascular Patches Industry Revenue (Million), by Application 2024 & 2032
- Figure 33: Middle East and Africa Cardiovascular Patches Industry Revenue Share (%), by Application 2024 & 2032
- Figure 34: Middle East and Africa Cardiovascular Patches Industry Revenue (Million), by Country 2024 & 2032
- Figure 35: Middle East and Africa Cardiovascular Patches Industry Revenue Share (%), by Country 2024 & 2032
- Figure 36: South America Cardiovascular Patches Industry Revenue (Million), by Material 2024 & 2032
- Figure 37: South America Cardiovascular Patches Industry Revenue Share (%), by Material 2024 & 2032
- Figure 38: South America Cardiovascular Patches Industry Revenue (Million), by Application 2024 & 2032
- Figure 39: South America Cardiovascular Patches Industry Revenue Share (%), by Application 2024 & 2032
- Figure 40: South America Cardiovascular Patches Industry Revenue (Million), by Country 2024 & 2032
- Figure 41: South America Cardiovascular Patches Industry Revenue Share (%), by Country 2024 & 2032
List of Tables
- Table 1: Global Cardiovascular Patches Industry Revenue Million Forecast, by Region 2019 & 2032
- Table 2: Global Cardiovascular Patches Industry Revenue Million Forecast, by Material 2019 & 2032
- Table 3: Global Cardiovascular Patches Industry Revenue Million Forecast, by Application 2019 & 2032
- Table 4: Global Cardiovascular Patches Industry Revenue Million Forecast, by Region 2019 & 2032
- Table 5: Global Cardiovascular Patches Industry Revenue Million Forecast, by Country 2019 & 2032
- Table 6: United States Cardiovascular Patches Industry Revenue (Million) Forecast, by Application 2019 & 2032
- Table 7: Canada Cardiovascular Patches Industry Revenue (Million) Forecast, by Application 2019 & 2032
- Table 8: Mexico Cardiovascular Patches Industry Revenue (Million) Forecast, by Application 2019 & 2032
- Table 9: Global Cardiovascular Patches Industry Revenue Million Forecast, by Country 2019 & 2032
- Table 10: United Kingdom Cardiovascular Patches Industry Revenue (Million) Forecast, by Application 2019 & 2032
- Table 11: Germany Cardiovascular Patches Industry Revenue (Million) Forecast, by Application 2019 & 2032
- Table 12: France Cardiovascular Patches Industry Revenue (Million) Forecast, by Application 2019 & 2032
- Table 13: Italy Cardiovascular Patches Industry Revenue (Million) Forecast, by Application 2019 & 2032
- Table 14: Spain Cardiovascular Patches Industry Revenue (Million) Forecast, by Application 2019 & 2032
- Table 15: Rest of Europe Cardiovascular Patches Industry Revenue (Million) Forecast, by Application 2019 & 2032
- Table 16: Global Cardiovascular Patches Industry Revenue Million Forecast, by Country 2019 & 2032
- Table 17: China Cardiovascular Patches Industry Revenue (Million) Forecast, by Application 2019 & 2032
- Table 18: Japan Cardiovascular Patches Industry Revenue (Million) Forecast, by Application 2019 & 2032
- Table 19: India Cardiovascular Patches Industry Revenue (Million) Forecast, by Application 2019 & 2032
- Table 20: Australia Cardiovascular Patches Industry Revenue (Million) Forecast, by Application 2019 & 2032
- Table 21: South Korea Cardiovascular Patches Industry Revenue (Million) Forecast, by Application 2019 & 2032
- Table 22: Rest of Asia Pacific Cardiovascular Patches Industry Revenue (Million) Forecast, by Application 2019 & 2032
- Table 23: Global Cardiovascular Patches Industry Revenue Million Forecast, by Country 2019 & 2032
- Table 24: GCC Cardiovascular Patches Industry Revenue (Million) Forecast, by Application 2019 & 2032
- Table 25: South Africa Cardiovascular Patches Industry Revenue (Million) Forecast, by Application 2019 & 2032
- Table 26: Rest of Middle East and Africa Cardiovascular Patches Industry Revenue (Million) Forecast, by Application 2019 & 2032
- Table 27: Global Cardiovascular Patches Industry Revenue Million Forecast, by Country 2019 & 2032
- Table 28: Brazil Cardiovascular Patches Industry Revenue (Million) Forecast, by Application 2019 & 2032
- Table 29: Argentina Cardiovascular Patches Industry Revenue (Million) Forecast, by Application 2019 & 2032
- Table 30: Rest of South America Cardiovascular Patches Industry Revenue (Million) Forecast, by Application 2019 & 2032
- Table 31: Global Cardiovascular Patches Industry Revenue Million Forecast, by Material 2019 & 2032
- Table 32: Global Cardiovascular Patches Industry Revenue Million Forecast, by Application 2019 & 2032
- Table 33: Global Cardiovascular Patches Industry Revenue Million Forecast, by Country 2019 & 2032
- Table 34: United States Cardiovascular Patches Industry Revenue (Million) Forecast, by Application 2019 & 2032
- Table 35: Canada Cardiovascular Patches Industry Revenue (Million) Forecast, by Application 2019 & 2032
- Table 36: Mexico Cardiovascular Patches Industry Revenue (Million) Forecast, by Application 2019 & 2032
- Table 37: Global Cardiovascular Patches Industry Revenue Million Forecast, by Material 2019 & 2032
- Table 38: Global Cardiovascular Patches Industry Revenue Million Forecast, by Application 2019 & 2032
- Table 39: Global Cardiovascular Patches Industry Revenue Million Forecast, by Country 2019 & 2032
- Table 40: United Kingdom Cardiovascular Patches Industry Revenue (Million) Forecast, by Application 2019 & 2032
- Table 41: Germany Cardiovascular Patches Industry Revenue (Million) Forecast, by Application 2019 & 2032
- Table 42: France Cardiovascular Patches Industry Revenue (Million) Forecast, by Application 2019 & 2032
- Table 43: Italy Cardiovascular Patches Industry Revenue (Million) Forecast, by Application 2019 & 2032
- Table 44: Spain Cardiovascular Patches Industry Revenue (Million) Forecast, by Application 2019 & 2032
- Table 45: Rest of Europe Cardiovascular Patches Industry Revenue (Million) Forecast, by Application 2019 & 2032
- Table 46: Global Cardiovascular Patches Industry Revenue Million Forecast, by Material 2019 & 2032
- Table 47: Global Cardiovascular Patches Industry Revenue Million Forecast, by Application 2019 & 2032
- Table 48: Global Cardiovascular Patches Industry Revenue Million Forecast, by Country 2019 & 2032
- Table 49: China Cardiovascular Patches Industry Revenue (Million) Forecast, by Application 2019 & 2032
- Table 50: Japan Cardiovascular Patches Industry Revenue (Million) Forecast, by Application 2019 & 2032
- Table 51: India Cardiovascular Patches Industry Revenue (Million) Forecast, by Application 2019 & 2032
- Table 52: Australia Cardiovascular Patches Industry Revenue (Million) Forecast, by Application 2019 & 2032
- Table 53: South Korea Cardiovascular Patches Industry Revenue (Million) Forecast, by Application 2019 & 2032
- Table 54: Rest of Asia Pacific Cardiovascular Patches Industry Revenue (Million) Forecast, by Application 2019 & 2032
- Table 55: Global Cardiovascular Patches Industry Revenue Million Forecast, by Material 2019 & 2032
- Table 56: Global Cardiovascular Patches Industry Revenue Million Forecast, by Application 2019 & 2032
- Table 57: Global Cardiovascular Patches Industry Revenue Million Forecast, by Country 2019 & 2032
- Table 58: GCC Cardiovascular Patches Industry Revenue (Million) Forecast, by Application 2019 & 2032
- Table 59: South Africa Cardiovascular Patches Industry Revenue (Million) Forecast, by Application 2019 & 2032
- Table 60: Rest of Middle East and Africa Cardiovascular Patches Industry Revenue (Million) Forecast, by Application 2019 & 2032
- Table 61: Global Cardiovascular Patches Industry Revenue Million Forecast, by Material 2019 & 2032
- Table 62: Global Cardiovascular Patches Industry Revenue Million Forecast, by Application 2019 & 2032
- Table 63: Global Cardiovascular Patches Industry Revenue Million Forecast, by Country 2019 & 2032
- Table 64: Brazil Cardiovascular Patches Industry Revenue (Million) Forecast, by Application 2019 & 2032
- Table 65: Argentina Cardiovascular Patches Industry Revenue (Million) Forecast, by Application 2019 & 2032
- Table 66: Rest of South America Cardiovascular Patches Industry Revenue (Million) Forecast, by Application 2019 & 2032
Frequently Asked Questions
1. What is the projected Compound Annual Growth Rate (CAGR) of the Cardiovascular Patches Industry?
The projected CAGR is approximately 7.40%.
2. Which companies are prominent players in the Cardiovascular Patches Industry?
Key companies in the market include Vascumed (Pty) Ltd, Collagen Solutions Plc, Lemaitre Vascular, FOC Medical S A, Terumo Corporation, Getinge AB, Edwards Lifesciences, Baxter International, B Braun SE, BD , Artivion, W L Gore & Associates.
3. What are the main segments of the Cardiovascular Patches Industry?
The market segments include Material, Application.
4. Can you provide details about the market size?
The market size is estimated to be USD 353 Million as of 2022.
5. What are some drivers contributing to market growth?
Rapidly Growing Geriatric Population and Increase in the Prevalence of Vascular Diseases; Increasing Adoption of Biological Patches.
6. What are the notable trends driving market growth?
Aortic Aneurysms Segment Expects to Register a Significant Growth Over the Forecast Period.
7. Are there any restraints impacting market growth?
Risk of Immune Response and Serious Complications; Product Failures and Recalls.
8. Can you provide examples of recent developments in the market?
May 2022: Vivasure Medical closed the first tranche of USD 22 million (USD 23 million) as part of its Series D financing round led by a multi-national strategic corporation. The funding supports the United States and European clinical development and regulatory approval of the company's portfolio of fully absorbable, patch-based, large-bore percutaneous vessel closure devices for transcatheter endovascular and cardiovascular procedures.
9. What pricing options are available for accessing the report?
Pricing options include single-user, multi-user, and enterprise licenses priced at USD 4750, USD 5250, and USD 8750 respectively.
10. Is the market size provided in terms of value or volume?
The market size is provided in terms of value, measured in Million.
11. Are there any specific market keywords associated with the report?
Yes, the market keyword associated with the report is "Cardiovascular Patches Industry," which aids in identifying and referencing the specific market segment covered.
12. How do I determine which pricing option suits my needs best?
The pricing options vary based on user requirements and access needs. Individual users may opt for single-user licenses, while businesses requiring broader access may choose multi-user or enterprise licenses for cost-effective access to the report.
13. Are there any additional resources or data provided in the Cardiovascular Patches Industry report?
While the report offers comprehensive insights, it's advisable to review the specific contents or supplementary materials provided to ascertain if additional resources or data are available.
14. How can I stay updated on further developments or reports in the Cardiovascular Patches Industry?
To stay informed about further developments, trends, and reports in the Cardiovascular Patches Industry, consider subscribing to industry newsletters, following relevant companies and organizations, or regularly checking reputable industry news sources and publications.
Methodology
Step 1 - Identification of Relevant Samples Size from Population Database


Step 2 - Approaches for Defining Global Market Size (Value, Volume* & Price*)

Note*: In applicable scenarios
Step 3 - Data Sources
Primary Research
- Web Analytics
- Survey Reports
- Research Institute
- Latest Research Reports
- Opinion Leaders
Secondary Research
- Annual Reports
- White Paper
- Latest Press Release
- Industry Association
- Paid Database
- Investor Presentations

Step 4 - Data Triangulation
Involves using different sources of information in order to increase the validity of a study
These sources are likely to be stakeholders in a program - participants, other researchers, program staff, other community members, and so on.
Then we put all data in single framework & apply various statistical tools to find out the dynamic on the market.
During the analysis stage, feedback from the stakeholder groups would be compared to determine areas of agreement as well as areas of divergence
