

Key Insights
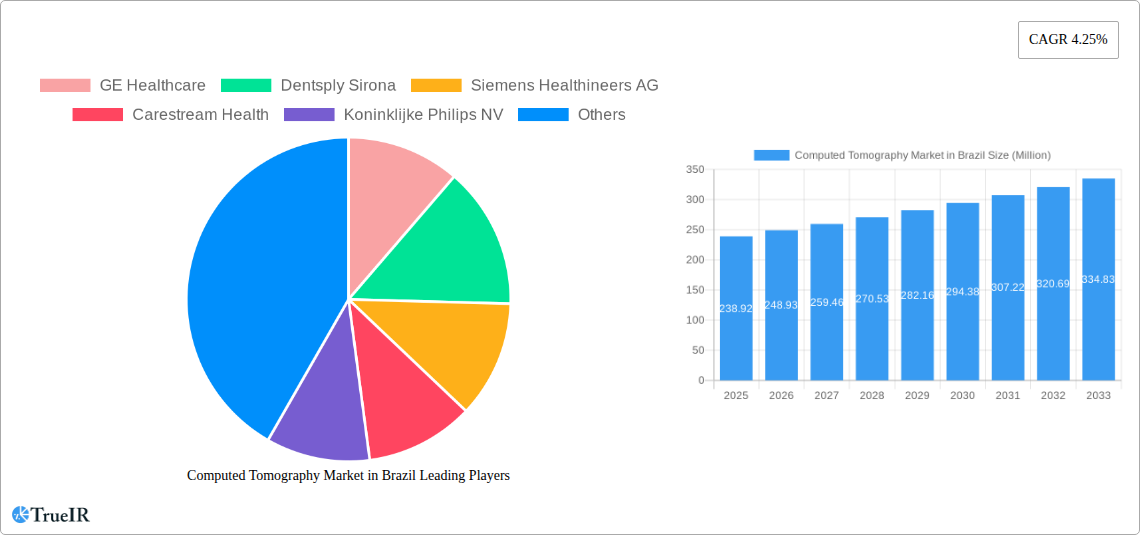
The Brazilian Computed Tomography (CT) market, valued at $238.92 million in 2025, is projected to experience robust growth, driven by a rising prevalence of chronic diseases like cancer and cardiovascular conditions necessitating advanced diagnostic imaging. This expanding need for precise and rapid diagnoses fuels the demand for CT scans, particularly within hospitals and diagnostic centers. Technological advancements, such as multi-slice CT scanners offering faster scan times and improved image quality, further stimulate market expansion. The market segmentation reveals a significant share held by high-slice CT scanners, reflecting a preference for superior image resolution and diagnostic accuracy among healthcare providers. Oncology, neurology, and cardiovascular applications constitute the major segments, reflecting the prevalence of related diseases in Brazil. While growth is expected, challenges remain, including high equipment costs and the need for skilled technicians. Nevertheless, government initiatives promoting healthcare infrastructure development and increasing healthcare expenditure are poised to support market expansion. The forecast period (2025-2033) anticipates a sustained CAGR of 4.25%, indicating considerable potential for market players.
The competitive landscape comprises both established international players like GE Healthcare, Siemens Healthineers AG, and Philips, and regional players. These companies are actively engaged in strategic initiatives such as technological innovation, partnerships, and expansions to capture market share. The market's growth will be influenced by factors like the country's economic development, improvements in healthcare infrastructure, and advancements in CT technology. The increasing adoption of minimally invasive procedures and the growing preference for faster and more accurate diagnostic tools contribute to the market's overall positive outlook. The market's diverse segments—categorized by slice count (low, medium, high), application (oncology, neurology, cardiovascular, musculoskeletal, and others), and end-user (hospitals, diagnostic centers, and others)—provide opportunities for specialized players to cater to specific needs.
Computed Tomography (CT) Market in Brazil: A Comprehensive Market Report (2019-2033)
This dynamic report provides a detailed analysis of the Computed Tomography (CT) market in Brazil, offering invaluable insights for stakeholders across the healthcare industry. With a comprehensive study period spanning from 2019 to 2033, including a base year of 2025 and a forecast period from 2025 to 2033, this report leverages extensive data and expert analysis to illuminate the market's trajectory. Expect in-depth coverage of market size, segmentation by type (Low Slice, Medium Slice, High Slice), application (Oncology, Neurology, Cardiovascular, Musculoskeletal, Other), and end-user (Hospitals, Diagnostic Centers, Other), along with competitive landscape analysis and future growth projections. The report also includes key industry developments impacting market growth.
Computed Tomography Market in Brazil Market Structure & Competitive Landscape
The Brazilian CT market exhibits a moderately concentrated structure, with a Herfindahl-Hirschman Index (HHI) estimated at xx in 2025. Key players, including GE Healthcare, Siemens Healthineers AG, Philips, and Canon Medical Systems Corporation, hold significant market share, driving innovation and shaping competitive dynamics. The market is characterized by ongoing technological advancements, particularly in multi-slice CT technology and AI-driven image analysis. Regulatory approvals from ANVISA (Agência Nacional de Vigilância Sanitária) play a crucial role, influencing market entry and product adoption. Substitutes, such as MRI, exist but CT's speed and cost-effectiveness maintain its dominance for many applications.
The end-user segment is primarily dominated by hospitals (xx% market share in 2025), followed by diagnostic centers. The M&A activity has been relatively moderate in recent years, with xx deals recorded between 2019 and 2024, primarily focused on smaller players being acquired by larger multinational corporations. This trend reflects the need for consolidation and expansion in the face of increasing competition. Further driving the competitive environment are strategic partnerships which accelerate innovation and market penetration.
- Market Concentration: HHI estimated at xx in 2025
- Innovation Drivers: Advancements in multi-slice technology, AI integration
- Regulatory Impact: ANVISA approvals crucial for market entry and product adoption
- Product Substitutes: MRI, but CT remains dominant due to speed and cost-effectiveness
- End-User Segmentation: Hospitals (xx%), Diagnostic Centers (xx%), Other (xx%)
- M&A Activity: xx deals between 2019 and 2024
Computed Tomography Market in Brazil Market Trends & Opportunities
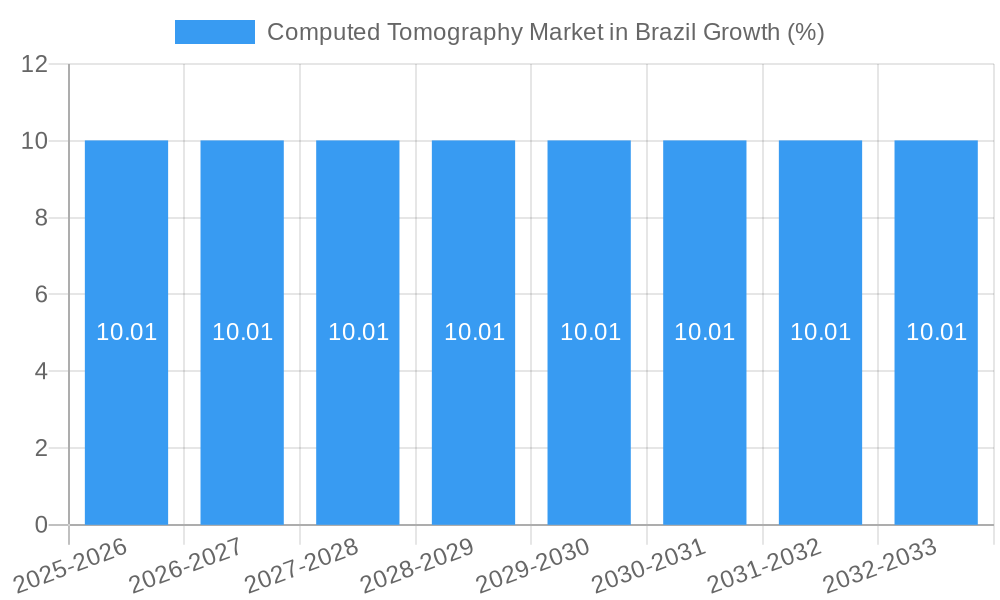
The Brazilian CT market is poised for robust growth, driven by several key factors. The market size is projected to reach xx Million by 2033, exhibiting a CAGR of xx% during the forecast period (2025-2033). This growth is fueled by rising prevalence of chronic diseases, increasing demand for advanced diagnostic imaging, expanding healthcare infrastructure, and government initiatives promoting healthcare access. Technological advancements, such as the introduction of faster scan times, improved image quality, and AI-powered diagnostic tools are boosting market penetration and driving market expansion, with specific penetration rates for specific technologies exceeding xx% in certain regions by 2033. Consumer preferences lean towards improved speed and accuracy of imaging, leading to demand for higher-slice CT scanners. The competitive landscape remains highly dynamic, with ongoing investments in R&D and strategic partnerships shaping the market.
Dominant Markets & Segments in Computed Tomography Market in Brazil
While data on specific regional dominance is limited, the Southeast region of Brazil, including major cities like São Paulo and Rio de Janeiro, is anticipated to hold the largest market share due to higher healthcare infrastructure investment and concentration of diagnostic centers and hospitals. Within the segments:
- Type: High-slice CT scanners are expected to witness the most significant growth, driven by the demand for enhanced image quality and faster scan times.
- Application: Oncology remains the largest application segment, followed by cardiology and neurology. This reflects the high prevalence of cancer and cardiovascular diseases in Brazil.
- End User: Hospitals constitute the largest end-user segment.
Key Growth Drivers:
- Increasing prevalence of chronic diseases
- Expanding healthcare infrastructure, particularly in underserved regions
- Government initiatives to improve healthcare access and quality
- Technological advancements in CT scan technology
- Growing adoption of advanced imaging techniques
Computed Tomography Market in Brazil Product Analysis
Technological advancements in CT scanner technology are driving market innovation. Newer models offer faster scan times, reduced radiation exposure, improved image quality, and advanced reconstruction techniques. This enhances diagnostic accuracy and workflow efficiency, catering to the rising demand for faster and more precise diagnoses in busy healthcare environments. The integration of artificial intelligence (AI) and machine learning (ML) is further improving image analysis and diagnostic capabilities, adding a competitive advantage for manufacturers offering these features.
Key Drivers, Barriers & Challenges in Computed Tomography Market in Brazil
Key Drivers:
- The rising prevalence of chronic diseases like cancer, cardiovascular diseases, and neurological disorders is significantly driving demand for advanced diagnostic tools like CT scanners.
- The government's increasing focus on improving healthcare infrastructure and access is creating favorable conditions for market growth.
- Technological advancements in CT scanner technology such as faster scan times, improved image quality, and AI-driven diagnostics are further boosting the market.
Challenges and Restraints:
High acquisition and maintenance costs associated with CT scanners, coupled with a relatively small number of trained professionals, hinder widespread adoption. Furthermore, regulatory hurdles and bureaucratic processes impact market entry and expansion, slowing the process of incorporating new technologies. These factors, combined with challenges in supply chain efficiency and uneven distribution of healthcare resources across different regions of the country, lead to a more fragmented and slower growing market than in other developed nations.
Growth Drivers in the Computed Tomography Market in Brazil Market
The Brazilian CT market is driven by the increasing prevalence of chronic diseases necessitating advanced diagnostic imaging, coupled with government initiatives focused on enhancing healthcare infrastructure and access. Technological advancements in CT scanner technology (faster scan times, improved image quality, AI integration) further fuel growth. Rising disposable incomes and increasing health insurance coverage also contribute positively.
Challenges Impacting Computed Tomography Market in Brazil Growth
High equipment costs, limited skilled personnel, complex regulatory approvals, uneven regional distribution of healthcare resources, and supply chain inefficiencies pose significant challenges. These factors, in addition to the competitive dynamics and fluctuating economic conditions, impact overall market growth.
Key Players Shaping the Computed Tomography Market in Brazil Market
- GE Healthcare
- Dentsply Sirona
- Siemens Healthineers AG
- Carestream Health
- Koninklijke Philips NV
- Canon Medical Systems Corporation
- Samsung Medison
- Planmeca Group (Planmed OY)
Significant Computed Tomography Market in Brazil Industry Milestones
- November 2020: Samsung NeuroLogica Mobile Stroke CT scanner donated to Santa Lucia Hospital Network in Brasilia. This highlights increased focus on stroke care and the adoption of mobile CT technology.
- June 2020: Agfa and VMI Technologies partnership to launch CT production in Brazil. This signifies a move towards local manufacturing and potentially lower costs.
Future Outlook for Computed Tomography Market in Brazil Market
The Brazilian CT market exhibits strong growth potential, driven by favorable demographics, increasing healthcare expenditure, and ongoing technological innovations. Strategic investments in infrastructure development, coupled with government initiatives to improve healthcare access, will further propel market expansion. The adoption of AI and machine learning in CT imaging is set to revolutionize diagnostic capabilities and workflow efficiency, promising increased market penetration. The market will see continued consolidation through M&A activity, leading to a more concentrated yet more innovative landscape.
Computed Tomography Market in Brazil Segmentation
-
1. Type
- 1.1. Low Slice
- 1.2. Medium Slice
- 1.3. High Slice
-
2. Application
- 2.1. Oncology
- 2.2. Neurology
- 2.3. Cardiovascular
- 2.4. Musculoskeletal
- 2.5. Other Applications
-
3. End User
- 3.1. Hospitals
- 3.2. Diagnostic Centers
- 3.3. Other End Users
Computed Tomography Market in Brazil Segmentation By Geography
-
1. North America
- 1.1. United States
- 1.2. Canada
- 1.3. Mexico
-
2. South America
- 2.1. Brazil
- 2.2. Argentina
- 2.3. Rest of South America
-
3. Europe
- 3.1. United Kingdom
- 3.2. Germany
- 3.3. France
- 3.4. Italy
- 3.5. Spain
- 3.6. Russia
- 3.7. Benelux
- 3.8. Nordics
- 3.9. Rest of Europe
-
4. Middle East & Africa
- 4.1. Turkey
- 4.2. Israel
- 4.3. GCC
- 4.4. North Africa
- 4.5. South Africa
- 4.6. Rest of Middle East & Africa
-
5. Asia Pacific
- 5.1. China
- 5.2. India
- 5.3. Japan
- 5.4. South Korea
- 5.5. ASEAN
- 5.6. Oceania
- 5.7. Rest of Asia Pacific
Computed Tomography Market in Brazil REPORT HIGHLIGHTS
| Aspects | Details |
|---|---|
| Study Period | 2019-2033 |
| Base Year | 2024 |
| Estimated Year | 2025 |
| Forecast Period | 2025-2033 |
| Historical Period | 2019-2024 |
| Growth Rate | CAGR of 4.25% from 2019-2033 |
| Segmentation |
|
Table of Contents
- 1. Introduction
- 1.1. Research Scope
- 1.2. Market Segmentation
- 1.3. Research Methodology
- 1.4. Definitions and Assumptions
- 2. Executive Summary
- 2.1. Introduction
- 3. Market Dynamics
- 3.1. Introduction
- 3.2. Market Drivers
- 3.2.1. Increasing Prevalence of Chronic Diseases; Rising Geriatric Population; Increasing Technological Advancements
- 3.3. Market Restrains
- 3.3.1. Lack Of Proper Reimbursement And Stringent Regulatory Approval Procedures; High Cost of Equipment
- 3.4. Market Trends
- 3.4.1. Oncology Segment is Expected to Hold a Significant Market Share Over the Forecast Period
- 4. Market Factor Analysis
- 4.1. Porters Five Forces
- 4.2. Supply/Value Chain
- 4.3. PESTEL analysis
- 4.4. Market Entropy
- 4.5. Patent/Trademark Analysis
- 5. Global Computed Tomography Market in Brazil Analysis, Insights and Forecast, 2019-2031
- 5.1. Market Analysis, Insights and Forecast - by Type
- 5.1.1. Low Slice
- 5.1.2. Medium Slice
- 5.1.3. High Slice
- 5.2. Market Analysis, Insights and Forecast - by Application
- 5.2.1. Oncology
- 5.2.2. Neurology
- 5.2.3. Cardiovascular
- 5.2.4. Musculoskeletal
- 5.2.5. Other Applications
- 5.3. Market Analysis, Insights and Forecast - by End User
- 5.3.1. Hospitals
- 5.3.2. Diagnostic Centers
- 5.3.3. Other End Users
- 5.4. Market Analysis, Insights and Forecast - by Region
- 5.4.1. North America
- 5.4.2. South America
- 5.4.3. Europe
- 5.4.4. Middle East & Africa
- 5.4.5. Asia Pacific
- 5.1. Market Analysis, Insights and Forecast - by Type
- 6. North America Computed Tomography Market in Brazil Analysis, Insights and Forecast, 2019-2031
- 6.1. Market Analysis, Insights and Forecast - by Type
- 6.1.1. Low Slice
- 6.1.2. Medium Slice
- 6.1.3. High Slice
- 6.2. Market Analysis, Insights and Forecast - by Application
- 6.2.1. Oncology
- 6.2.2. Neurology
- 6.2.3. Cardiovascular
- 6.2.4. Musculoskeletal
- 6.2.5. Other Applications
- 6.3. Market Analysis, Insights and Forecast - by End User
- 6.3.1. Hospitals
- 6.3.2. Diagnostic Centers
- 6.3.3. Other End Users
- 6.1. Market Analysis, Insights and Forecast - by Type
- 7. South America Computed Tomography Market in Brazil Analysis, Insights and Forecast, 2019-2031
- 7.1. Market Analysis, Insights and Forecast - by Type
- 7.1.1. Low Slice
- 7.1.2. Medium Slice
- 7.1.3. High Slice
- 7.2. Market Analysis, Insights and Forecast - by Application
- 7.2.1. Oncology
- 7.2.2. Neurology
- 7.2.3. Cardiovascular
- 7.2.4. Musculoskeletal
- 7.2.5. Other Applications
- 7.3. Market Analysis, Insights and Forecast - by End User
- 7.3.1. Hospitals
- 7.3.2. Diagnostic Centers
- 7.3.3. Other End Users
- 7.1. Market Analysis, Insights and Forecast - by Type
- 8. Europe Computed Tomography Market in Brazil Analysis, Insights and Forecast, 2019-2031
- 8.1. Market Analysis, Insights and Forecast - by Type
- 8.1.1. Low Slice
- 8.1.2. Medium Slice
- 8.1.3. High Slice
- 8.2. Market Analysis, Insights and Forecast - by Application
- 8.2.1. Oncology
- 8.2.2. Neurology
- 8.2.3. Cardiovascular
- 8.2.4. Musculoskeletal
- 8.2.5. Other Applications
- 8.3. Market Analysis, Insights and Forecast - by End User
- 8.3.1. Hospitals
- 8.3.2. Diagnostic Centers
- 8.3.3. Other End Users
- 8.1. Market Analysis, Insights and Forecast - by Type
- 9. Middle East & Africa Computed Tomography Market in Brazil Analysis, Insights and Forecast, 2019-2031
- 9.1. Market Analysis, Insights and Forecast - by Type
- 9.1.1. Low Slice
- 9.1.2. Medium Slice
- 9.1.3. High Slice
- 9.2. Market Analysis, Insights and Forecast - by Application
- 9.2.1. Oncology
- 9.2.2. Neurology
- 9.2.3. Cardiovascular
- 9.2.4. Musculoskeletal
- 9.2.5. Other Applications
- 9.3. Market Analysis, Insights and Forecast - by End User
- 9.3.1. Hospitals
- 9.3.2. Diagnostic Centers
- 9.3.3. Other End Users
- 9.1. Market Analysis, Insights and Forecast - by Type
- 10. Asia Pacific Computed Tomography Market in Brazil Analysis, Insights and Forecast, 2019-2031
- 10.1. Market Analysis, Insights and Forecast - by Type
- 10.1.1. Low Slice
- 10.1.2. Medium Slice
- 10.1.3. High Slice
- 10.2. Market Analysis, Insights and Forecast - by Application
- 10.2.1. Oncology
- 10.2.2. Neurology
- 10.2.3. Cardiovascular
- 10.2.4. Musculoskeletal
- 10.2.5. Other Applications
- 10.3. Market Analysis, Insights and Forecast - by End User
- 10.3.1. Hospitals
- 10.3.2. Diagnostic Centers
- 10.3.3. Other End Users
- 10.1. Market Analysis, Insights and Forecast - by Type
- 11. Competitive Analysis
- 11.1. Global Market Share Analysis 2024
- 11.2. Company Profiles
- 11.2.1 GE Healthcare
- 11.2.1.1. Overview
- 11.2.1.2. Products
- 11.2.1.3. SWOT Analysis
- 11.2.1.4. Recent Developments
- 11.2.1.5. Financials (Based on Availability)
- 11.2.2 Dentsply Sirona
- 11.2.2.1. Overview
- 11.2.2.2. Products
- 11.2.2.3. SWOT Analysis
- 11.2.2.4. Recent Developments
- 11.2.2.5. Financials (Based on Availability)
- 11.2.3 Siemens Healthineers AG
- 11.2.3.1. Overview
- 11.2.3.2. Products
- 11.2.3.3. SWOT Analysis
- 11.2.3.4. Recent Developments
- 11.2.3.5. Financials (Based on Availability)
- 11.2.4 Carestream Health
- 11.2.4.1. Overview
- 11.2.4.2. Products
- 11.2.4.3. SWOT Analysis
- 11.2.4.4. Recent Developments
- 11.2.4.5. Financials (Based on Availability)
- 11.2.5 Koninklijke Philips NV
- 11.2.5.1. Overview
- 11.2.5.2. Products
- 11.2.5.3. SWOT Analysis
- 11.2.5.4. Recent Developments
- 11.2.5.5. Financials (Based on Availability)
- 11.2.6 Canon Medical Systems Corporation
- 11.2.6.1. Overview
- 11.2.6.2. Products
- 11.2.6.3. SWOT Analysis
- 11.2.6.4. Recent Developments
- 11.2.6.5. Financials (Based on Availability)
- 11.2.7 Samsung Medison
- 11.2.7.1. Overview
- 11.2.7.2. Products
- 11.2.7.3. SWOT Analysis
- 11.2.7.4. Recent Developments
- 11.2.7.5. Financials (Based on Availability)
- 11.2.8 Planmeca Group (Planmed OY)
- 11.2.8.1. Overview
- 11.2.8.2. Products
- 11.2.8.3. SWOT Analysis
- 11.2.8.4. Recent Developments
- 11.2.8.5. Financials (Based on Availability)
- 11.2.1 GE Healthcare
List of Figures
- Figure 1: Global Computed Tomography Market in Brazil Revenue Breakdown (Million, %) by Region 2024 & 2032
- Figure 2: Brazil Computed Tomography Market in Brazil Revenue (Million), by Country 2024 & 2032
- Figure 3: Brazil Computed Tomography Market in Brazil Revenue Share (%), by Country 2024 & 2032
- Figure 4: North America Computed Tomography Market in Brazil Revenue (Million), by Type 2024 & 2032
- Figure 5: North America Computed Tomography Market in Brazil Revenue Share (%), by Type 2024 & 2032
- Figure 6: North America Computed Tomography Market in Brazil Revenue (Million), by Application 2024 & 2032
- Figure 7: North America Computed Tomography Market in Brazil Revenue Share (%), by Application 2024 & 2032
- Figure 8: North America Computed Tomography Market in Brazil Revenue (Million), by End User 2024 & 2032
- Figure 9: North America Computed Tomography Market in Brazil Revenue Share (%), by End User 2024 & 2032
- Figure 10: North America Computed Tomography Market in Brazil Revenue (Million), by Country 2024 & 2032
- Figure 11: North America Computed Tomography Market in Brazil Revenue Share (%), by Country 2024 & 2032
- Figure 12: South America Computed Tomography Market in Brazil Revenue (Million), by Type 2024 & 2032
- Figure 13: South America Computed Tomography Market in Brazil Revenue Share (%), by Type 2024 & 2032
- Figure 14: South America Computed Tomography Market in Brazil Revenue (Million), by Application 2024 & 2032
- Figure 15: South America Computed Tomography Market in Brazil Revenue Share (%), by Application 2024 & 2032
- Figure 16: South America Computed Tomography Market in Brazil Revenue (Million), by End User 2024 & 2032
- Figure 17: South America Computed Tomography Market in Brazil Revenue Share (%), by End User 2024 & 2032
- Figure 18: South America Computed Tomography Market in Brazil Revenue (Million), by Country 2024 & 2032
- Figure 19: South America Computed Tomography Market in Brazil Revenue Share (%), by Country 2024 & 2032
- Figure 20: Europe Computed Tomography Market in Brazil Revenue (Million), by Type 2024 & 2032
- Figure 21: Europe Computed Tomography Market in Brazil Revenue Share (%), by Type 2024 & 2032
- Figure 22: Europe Computed Tomography Market in Brazil Revenue (Million), by Application 2024 & 2032
- Figure 23: Europe Computed Tomography Market in Brazil Revenue Share (%), by Application 2024 & 2032
- Figure 24: Europe Computed Tomography Market in Brazil Revenue (Million), by End User 2024 & 2032
- Figure 25: Europe Computed Tomography Market in Brazil Revenue Share (%), by End User 2024 & 2032
- Figure 26: Europe Computed Tomography Market in Brazil Revenue (Million), by Country 2024 & 2032
- Figure 27: Europe Computed Tomography Market in Brazil Revenue Share (%), by Country 2024 & 2032
- Figure 28: Middle East & Africa Computed Tomography Market in Brazil Revenue (Million), by Type 2024 & 2032
- Figure 29: Middle East & Africa Computed Tomography Market in Brazil Revenue Share (%), by Type 2024 & 2032
- Figure 30: Middle East & Africa Computed Tomography Market in Brazil Revenue (Million), by Application 2024 & 2032
- Figure 31: Middle East & Africa Computed Tomography Market in Brazil Revenue Share (%), by Application 2024 & 2032
- Figure 32: Middle East & Africa Computed Tomography Market in Brazil Revenue (Million), by End User 2024 & 2032
- Figure 33: Middle East & Africa Computed Tomography Market in Brazil Revenue Share (%), by End User 2024 & 2032
- Figure 34: Middle East & Africa Computed Tomography Market in Brazil Revenue (Million), by Country 2024 & 2032
- Figure 35: Middle East & Africa Computed Tomography Market in Brazil Revenue Share (%), by Country 2024 & 2032
- Figure 36: Asia Pacific Computed Tomography Market in Brazil Revenue (Million), by Type 2024 & 2032
- Figure 37: Asia Pacific Computed Tomography Market in Brazil Revenue Share (%), by Type 2024 & 2032
- Figure 38: Asia Pacific Computed Tomography Market in Brazil Revenue (Million), by Application 2024 & 2032
- Figure 39: Asia Pacific Computed Tomography Market in Brazil Revenue Share (%), by Application 2024 & 2032
- Figure 40: Asia Pacific Computed Tomography Market in Brazil Revenue (Million), by End User 2024 & 2032
- Figure 41: Asia Pacific Computed Tomography Market in Brazil Revenue Share (%), by End User 2024 & 2032
- Figure 42: Asia Pacific Computed Tomography Market in Brazil Revenue (Million), by Country 2024 & 2032
- Figure 43: Asia Pacific Computed Tomography Market in Brazil Revenue Share (%), by Country 2024 & 2032
List of Tables
- Table 1: Global Computed Tomography Market in Brazil Revenue Million Forecast, by Region 2019 & 2032
- Table 2: Global Computed Tomography Market in Brazil Revenue Million Forecast, by Type 2019 & 2032
- Table 3: Global Computed Tomography Market in Brazil Revenue Million Forecast, by Application 2019 & 2032
- Table 4: Global Computed Tomography Market in Brazil Revenue Million Forecast, by End User 2019 & 2032
- Table 5: Global Computed Tomography Market in Brazil Revenue Million Forecast, by Region 2019 & 2032
- Table 6: Global Computed Tomography Market in Brazil Revenue Million Forecast, by Country 2019 & 2032
- Table 7: Global Computed Tomography Market in Brazil Revenue Million Forecast, by Type 2019 & 2032
- Table 8: Global Computed Tomography Market in Brazil Revenue Million Forecast, by Application 2019 & 2032
- Table 9: Global Computed Tomography Market in Brazil Revenue Million Forecast, by End User 2019 & 2032
- Table 10: Global Computed Tomography Market in Brazil Revenue Million Forecast, by Country 2019 & 2032
- Table 11: United States Computed Tomography Market in Brazil Revenue (Million) Forecast, by Application 2019 & 2032
- Table 12: Canada Computed Tomography Market in Brazil Revenue (Million) Forecast, by Application 2019 & 2032
- Table 13: Mexico Computed Tomography Market in Brazil Revenue (Million) Forecast, by Application 2019 & 2032
- Table 14: Global Computed Tomography Market in Brazil Revenue Million Forecast, by Type 2019 & 2032
- Table 15: Global Computed Tomography Market in Brazil Revenue Million Forecast, by Application 2019 & 2032
- Table 16: Global Computed Tomography Market in Brazil Revenue Million Forecast, by End User 2019 & 2032
- Table 17: Global Computed Tomography Market in Brazil Revenue Million Forecast, by Country 2019 & 2032
- Table 18: Brazil Computed Tomography Market in Brazil Revenue (Million) Forecast, by Application 2019 & 2032
- Table 19: Argentina Computed Tomography Market in Brazil Revenue (Million) Forecast, by Application 2019 & 2032
- Table 20: Rest of South America Computed Tomography Market in Brazil Revenue (Million) Forecast, by Application 2019 & 2032
- Table 21: Global Computed Tomography Market in Brazil Revenue Million Forecast, by Type 2019 & 2032
- Table 22: Global Computed Tomography Market in Brazil Revenue Million Forecast, by Application 2019 & 2032
- Table 23: Global Computed Tomography Market in Brazil Revenue Million Forecast, by End User 2019 & 2032
- Table 24: Global Computed Tomography Market in Brazil Revenue Million Forecast, by Country 2019 & 2032
- Table 25: United Kingdom Computed Tomography Market in Brazil Revenue (Million) Forecast, by Application 2019 & 2032
- Table 26: Germany Computed Tomography Market in Brazil Revenue (Million) Forecast, by Application 2019 & 2032
- Table 27: France Computed Tomography Market in Brazil Revenue (Million) Forecast, by Application 2019 & 2032
- Table 28: Italy Computed Tomography Market in Brazil Revenue (Million) Forecast, by Application 2019 & 2032
- Table 29: Spain Computed Tomography Market in Brazil Revenue (Million) Forecast, by Application 2019 & 2032
- Table 30: Russia Computed Tomography Market in Brazil Revenue (Million) Forecast, by Application 2019 & 2032
- Table 31: Benelux Computed Tomography Market in Brazil Revenue (Million) Forecast, by Application 2019 & 2032
- Table 32: Nordics Computed Tomography Market in Brazil Revenue (Million) Forecast, by Application 2019 & 2032
- Table 33: Rest of Europe Computed Tomography Market in Brazil Revenue (Million) Forecast, by Application 2019 & 2032
- Table 34: Global Computed Tomography Market in Brazil Revenue Million Forecast, by Type 2019 & 2032
- Table 35: Global Computed Tomography Market in Brazil Revenue Million Forecast, by Application 2019 & 2032
- Table 36: Global Computed Tomography Market in Brazil Revenue Million Forecast, by End User 2019 & 2032
- Table 37: Global Computed Tomography Market in Brazil Revenue Million Forecast, by Country 2019 & 2032
- Table 38: Turkey Computed Tomography Market in Brazil Revenue (Million) Forecast, by Application 2019 & 2032
- Table 39: Israel Computed Tomography Market in Brazil Revenue (Million) Forecast, by Application 2019 & 2032
- Table 40: GCC Computed Tomography Market in Brazil Revenue (Million) Forecast, by Application 2019 & 2032
- Table 41: North Africa Computed Tomography Market in Brazil Revenue (Million) Forecast, by Application 2019 & 2032
- Table 42: South Africa Computed Tomography Market in Brazil Revenue (Million) Forecast, by Application 2019 & 2032
- Table 43: Rest of Middle East & Africa Computed Tomography Market in Brazil Revenue (Million) Forecast, by Application 2019 & 2032
- Table 44: Global Computed Tomography Market in Brazil Revenue Million Forecast, by Type 2019 & 2032
- Table 45: Global Computed Tomography Market in Brazil Revenue Million Forecast, by Application 2019 & 2032
- Table 46: Global Computed Tomography Market in Brazil Revenue Million Forecast, by End User 2019 & 2032
- Table 47: Global Computed Tomography Market in Brazil Revenue Million Forecast, by Country 2019 & 2032
- Table 48: China Computed Tomography Market in Brazil Revenue (Million) Forecast, by Application 2019 & 2032
- Table 49: India Computed Tomography Market in Brazil Revenue (Million) Forecast, by Application 2019 & 2032
- Table 50: Japan Computed Tomography Market in Brazil Revenue (Million) Forecast, by Application 2019 & 2032
- Table 51: South Korea Computed Tomography Market in Brazil Revenue (Million) Forecast, by Application 2019 & 2032
- Table 52: ASEAN Computed Tomography Market in Brazil Revenue (Million) Forecast, by Application 2019 & 2032
- Table 53: Oceania Computed Tomography Market in Brazil Revenue (Million) Forecast, by Application 2019 & 2032
- Table 54: Rest of Asia Pacific Computed Tomography Market in Brazil Revenue (Million) Forecast, by Application 2019 & 2032
Frequently Asked Questions
1. What is the projected Compound Annual Growth Rate (CAGR) of the Computed Tomography Market in Brazil?
The projected CAGR is approximately 4.25%.
2. Which companies are prominent players in the Computed Tomography Market in Brazil?
Key companies in the market include GE Healthcare, Dentsply Sirona, Siemens Healthineers AG, Carestream Health, Koninklijke Philips NV, Canon Medical Systems Corporation, Samsung Medison, Planmeca Group (Planmed OY).
3. What are the main segments of the Computed Tomography Market in Brazil?
The market segments include Type, Application, End User.
4. Can you provide details about the market size?
The market size is estimated to be USD 238.92 Million as of 2022.
5. What are some drivers contributing to market growth?
Increasing Prevalence of Chronic Diseases; Rising Geriatric Population; Increasing Technological Advancements.
6. What are the notable trends driving market growth?
Oncology Segment is Expected to Hold a Significant Market Share Over the Forecast Period.
7. Are there any restraints impacting market growth?
Lack Of Proper Reimbursement And Stringent Regulatory Approval Procedures; High Cost of Equipment.
8. Can you provide examples of recent developments in the market?
In November 2020, a Samsung NeuroLogica Mobile Stroke CT scanner was given to the Santa Lucia Hospital Network in Brasilia, Brazil.
9. What pricing options are available for accessing the report?
Pricing options include single-user, multi-user, and enterprise licenses priced at USD 3800, USD 4500, and USD 5800 respectively.
10. Is the market size provided in terms of value or volume?
The market size is provided in terms of value, measured in Million.
11. Are there any specific market keywords associated with the report?
Yes, the market keyword associated with the report is "Computed Tomography Market in Brazil," which aids in identifying and referencing the specific market segment covered.
12. How do I determine which pricing option suits my needs best?
The pricing options vary based on user requirements and access needs. Individual users may opt for single-user licenses, while businesses requiring broader access may choose multi-user or enterprise licenses for cost-effective access to the report.
13. Are there any additional resources or data provided in the Computed Tomography Market in Brazil report?
While the report offers comprehensive insights, it's advisable to review the specific contents or supplementary materials provided to ascertain if additional resources or data are available.
14. How can I stay updated on further developments or reports in the Computed Tomography Market in Brazil?
To stay informed about further developments, trends, and reports in the Computed Tomography Market in Brazil, consider subscribing to industry newsletters, following relevant companies and organizations, or regularly checking reputable industry news sources and publications.
Methodology
Step 1 - Identification of Relevant Samples Size from Population Database


Step 2 - Approaches for Defining Global Market Size (Value, Volume* & Price*)

Note*: In applicable scenarios
Step 3 - Data Sources
Primary Research
- Web Analytics
- Survey Reports
- Research Institute
- Latest Research Reports
- Opinion Leaders
Secondary Research
- Annual Reports
- White Paper
- Latest Press Release
- Industry Association
- Paid Database
- Investor Presentations

Step 4 - Data Triangulation
Involves using different sources of information in order to increase the validity of a study
These sources are likely to be stakeholders in a program - participants, other researchers, program staff, other community members, and so on.
Then we put all data in single framework & apply various statistical tools to find out the dynamic on the market.
During the analysis stage, feedback from the stakeholder groups would be compared to determine areas of agreement as well as areas of divergence
