

Key Insights
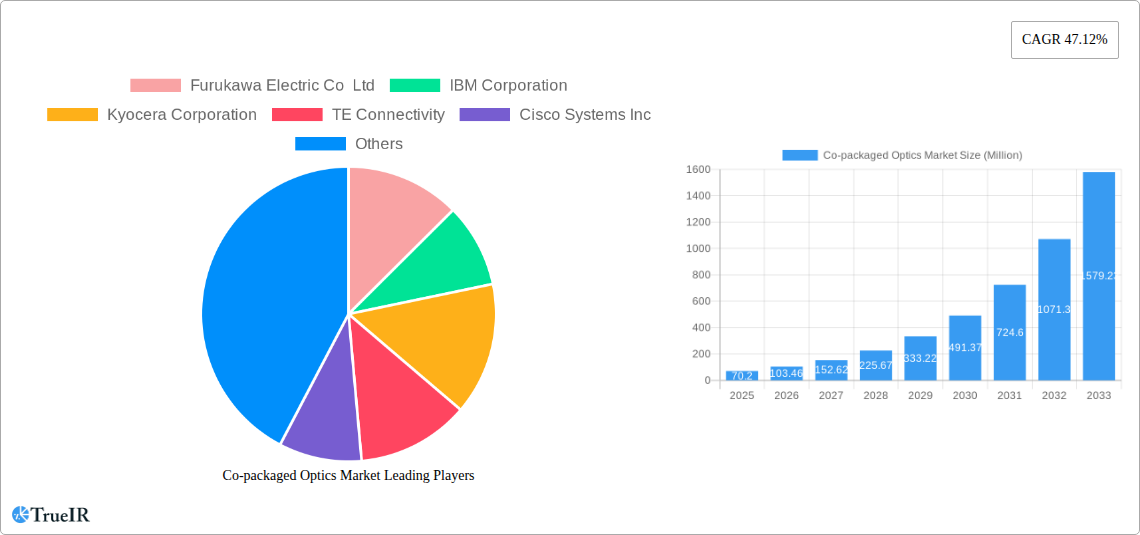
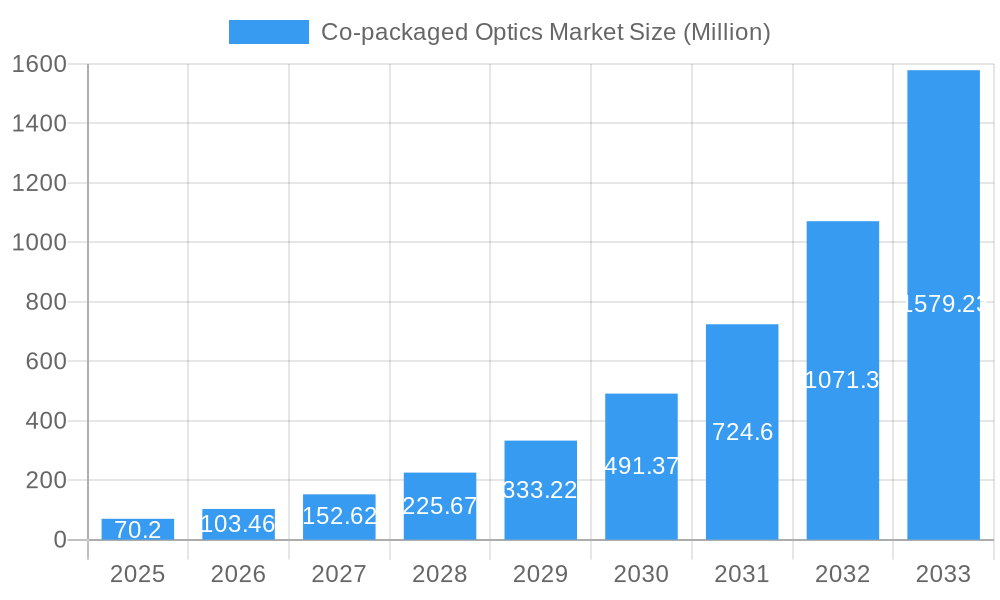
The co-packaged optics market is experiencing explosive growth, projected to reach $70.20 million in 2025 and exhibiting a remarkable Compound Annual Growth Rate (CAGR) of 47.12%. This surge is driven primarily by the increasing demand for higher bandwidth and faster data transmission speeds in data centers and high-performance computing environments. The miniaturization and integration offered by co-packaged optics significantly improve system performance, reduce latency, and lower power consumption, making them highly attractive to cloud providers, telecom operators, and enterprise businesses. Key trends include the adoption of advanced packaging technologies like silicon photonics and the integration of co-packaged optics with next-generation networking standards. While the initial high cost of implementation poses a restraint, the long-term cost savings and performance benefits are expected to outweigh this factor, driving wider adoption. Furthermore, technological advancements in optical transceivers and the development of more efficient manufacturing processes are also contributing to market expansion. Competition among established players like Cisco, IBM, and Huawei, along with innovative entrants like Ayar Labs, fuels further innovation and price competitiveness. Geographical expansion, particularly in rapidly developing economies in Asia-Pacific and other regions, represents a significant growth opportunity.
Co-packaged Optics Market Market Size (In Million)
The forecast period (2025-2033) anticipates continued strong growth, fueled by ongoing advancements in 5G and beyond-5G networks, the proliferation of artificial intelligence and machine learning applications demanding high bandwidth, and the increasing adoption of cloud-based services. North America and Europe currently dominate the market due to early adoption and robust infrastructure. However, the Asia-Pacific region is poised for substantial growth, driven by increasing investments in data center infrastructure and expanding digital economies. This regional shift necessitates strategic investments and adaptation from market players to capitalize on emerging opportunities. The market segmentation by data rates (less than x Gbps, x-y Gbps, etc.) further highlights the evolving demands and opportunities for different optical communication needs. Companies need to focus on strategic partnerships, technological innovations, and efficient supply chains to sustain market leadership and tap into the substantial growth potential.
Co-packaged Optics Market Company Market Share
Co-packaged Optics Market Report: A Comprehensive Analysis (2019-2033)
This in-depth report provides a comprehensive analysis of the Co-packaged Optics (CPO) market, offering invaluable insights for businesses and investors navigating this rapidly evolving landscape. The report covers the period 2019-2033, with a focus on the 2025-2033 forecast period. The market is projected to reach xx Million by 2033, demonstrating significant growth potential.
Co-packaged Optics Market Market Structure & Competitive Landscape
The Co-packaged Optics market exhibits a moderately concentrated structure, with several key players holding significant market share. The Herfindahl-Hirschman Index (HHI) is estimated at xx, indicating a moderately consolidated market. However, the market is characterized by intense innovation, particularly driven by advancements in silicon photonics and the increasing demand for high-bandwidth data transmission fueled by the growth of artificial intelligence (AI) and cloud computing. Regulatory impacts, while currently minimal, are expected to increase as the technology matures and its applications broaden. Product substitutes, such as traditional optical transceivers, are gradually losing ground due to CPO's superior performance and cost-effectiveness in high-bandwidth applications. The end-user segmentation is dominated by data centers and high-performance computing (HPC) segments. M&A activity has been relatively moderate in the recent past, with xx major mergers and acquisitions recorded between 2019 and 2024. Future M&A activity is anticipated to increase, especially as smaller, specialized CPO companies seek partnerships with larger players to scale their operations.
- Market Concentration: Moderately concentrated, HHI estimated at xx.
- Innovation Drivers: Advancements in silicon photonics, AI, and cloud computing.
- Regulatory Impacts: Currently minimal, expected to increase in the future.
- Product Substitutes: Traditional optical transceivers.
- End-User Segmentation: Data centers, HPC, others.
- M&A Trends: Moderate activity in 2019-2024, with xx major deals.
Co-packaged Optics Market Market Trends & Opportunities
The Co-packaged Optics market is experiencing robust growth, driven primarily by the escalating demand for high-bandwidth data transmission in data centers and high-performance computing environments. The market size is projected to grow at a Compound Annual Growth Rate (CAGR) of xx% from 2025 to 2033, reaching xx Million by the end of the forecast period. This growth is fueled by several key trends, including the widespread adoption of cloud computing, the proliferation of 5G networks, and the exponential rise of AI applications. Technological advancements in silicon photonics are significantly enhancing the capabilities and cost-effectiveness of CPO solutions, driving further market penetration. Consumer preferences are shifting towards solutions that offer higher bandwidth, lower latency, and improved energy efficiency, all of which are key advantages of CPO technology. Competitive dynamics are characterized by intense R&D activity, strategic partnerships, and an ongoing race to develop more efficient and cost-effective CPO solutions. The market penetration rate is expected to increase from xx% in 2025 to xx% by 2033, reflecting the growing adoption of this technology across various applications.
Dominant Markets & Segments in Co-packaged Optics Market
The North American region continues its leadership in the Co-packaged Optics (CPO) market, primarily fueled by aggressive investments in state-of-the-art data center infrastructure and the significant presence of pioneering technology giants. Within North America, the United States remains the dominant market share holder. The high data rates segment, particularly for speeds exceeding 1.6 Tbps, is exhibiting exceptional growth. This surge is directly attributable to the escalating demand for ultra-high-bandwidth connectivity solutions essential for powering advanced AI workloads, massive cloud computing environments, and next-generation networking. The drive for faster, more efficient data transmission is a key catalyst for this segment's expansion.
- Key Growth Drivers (North America):
- Substantial capital expenditure in cutting-edge data center infrastructure.
- Strategic presence and innovation from leading global technology companies.
- Supportive regulatory frameworks and incentives for technological advancement.
- Key Growth Drivers (High Data Rates Segment):
- Explosive demand for high-bandwidth connectivity driven by AI, machine learning, and expansive cloud services.
- Breakthroughs in silicon photonics and integrated photonics enabling unprecedented data rates and energy efficiency.
- Rapid adoption of high-speed networking technologies across enterprise and telecommunications sectors.
While North America is projected to maintain its leading position throughout the forecast period, the Asia-Pacific and European markets are anticipated to witness robust growth. This expansion will be propelled by increasing investments in digital infrastructure development, the burgeoning adoption of cloud computing services, and a growing emphasis on high-performance computing across these regions.
Co-packaged Optics Market Product Analysis
Co-packaged optics solutions are rapidly evolving, incorporating advancements in silicon photonics, integrated circuits, and packaging technologies. This leads to a range of products with varying data rates, power consumption, and form factors. Key competitive advantages include higher bandwidth, lower latency, reduced power consumption, and smaller footprints compared to traditional optical transceivers. This makes them particularly well-suited for data centers, high-performance computing systems, and other applications requiring high-speed connectivity.
Key Drivers, Barriers & Challenges in Co-packaged Optics Market
Key Drivers:
- The relentless expansion of data centers and the pervasive adoption of cloud computing are creating an insatiable demand for higher bandwidth, lower latency, and improved energy efficiency, making CPO a critical enabler.
- Pioneering advancements in silicon photonics and advanced packaging techniques are continuously enhancing the performance, integration capabilities, and cost-effectiveness of CPO solutions, accelerating their market penetration.
- Proactive government initiatives, research funding, and policies aimed at fostering the development and widespread adoption of next-generation networking technologies are significantly stimulating market growth and innovation.
Key Barriers & Challenges:
- The significant initial capital expenditure required for implementing CPO technology presents a considerable barrier, particularly for smaller enterprises and organizations with budget constraints.
- Navigating complex global supply chains, ensuring component availability, and mitigating potential disruptions remain critical challenges that can impact production timelines and the overall cost of CPO solutions.
- The highly competitive landscape, characterized by intense rivalry among established industry giants and agile new entrants, is driving rapid innovation but also creating pressure on pricing, profit margins, and market differentiation.
Growth Drivers in the Co-packaged Optics Market Market
The Co-packaged Optics market is being propelled by the convergence of several factors. The expanding data center infrastructure, fueled by cloud computing and AI, demands higher bandwidth capabilities, making CPO a crucial solution. Technological innovations in silicon photonics continuously improve the performance and cost-effectiveness of CPOs, increasing their attractiveness. Furthermore, favorable government policies and funding initiatives directed towards the development and deployment of advanced networking technologies contribute significantly to the market’s expansion.
Challenges Impacting Co-packaged Optics Market Growth
Several factors pose challenges to the growth of the Co-packaged Optics market. High initial investment costs for adopting this technology can be prohibitive for some businesses. The complex supply chain involved in the manufacturing process makes the market susceptible to disruptions, affecting production and delivery. Lastly, significant competitive pressures among various players result in pricing constraints and impact profit margins.
Key Players Shaping the Co-packaged Optics Market Market
- Furukawa Electric Co Ltd
- IBM Corporation
- Kyocera Corporation
- TE Connectivity
- Cisco Systems Inc
- Broadcom Inc
- Microsoft Corporation
- Ayar Labs Inc
- Huawei Technologies Co Ltd
- SENKO Advanced Components Inc
- Hisense Broadband Multimedia Technology Co Ltd
- Sumitomo Electric Industries Lt
- Intel Corporation
- POET Technologies
Significant Co-packaged Optics Market Industry Milestones
- March 2024: Intel achieved a significant breakthrough with the development of a 4 Tbps bidirectional fully integrated Optical Chiplet Interconnect (OCI) chiplet, leveraging its advanced in-house silicon photonics technology. This innovation represents a substantial leap forward in the performance and integration capabilities of CPO technology, paving the way for more powerful and efficient optical interconnects.
- September 2023: A major collaborative effort between TSMC, Broadcom, and Nvidia to advance silicon photonics and co-packaged optics (CPO) was announced. This strategic partnership underscores the accelerating importance of CPO solutions in meeting the burgeoning demands of the high-speed computing, AI, and data center markets, highlighting a shared vision for future optical interconnect architectures.
Future Outlook for Co-packaged Optics Market Market
The Co-packaged Optics market is poised for continued strong growth, driven by the unrelenting demand for high-bandwidth, low-latency connectivity in data centers, AI infrastructure, and high-performance computing applications. Strategic partnerships between technology giants and emerging CPO companies will further accelerate innovation and market penetration. The market’s potential is vast, with significant opportunities for companies that can effectively address the challenges of cost reduction, supply chain optimization, and technological advancements in silicon photonics.
Co-packaged Optics Market Segmentation
-
1. Data Rates
- 1.1. Less than 1.6 T
- 1.2. 3.2 T
- 1.3. 6.4 T
Co-packaged Optics Market Segmentation By Geography
- 1. North America
- 2. Europe
- 3. Asia
- 4. Australia and New Zealand
- 5. Latin America
- 6. Middle East and Africa
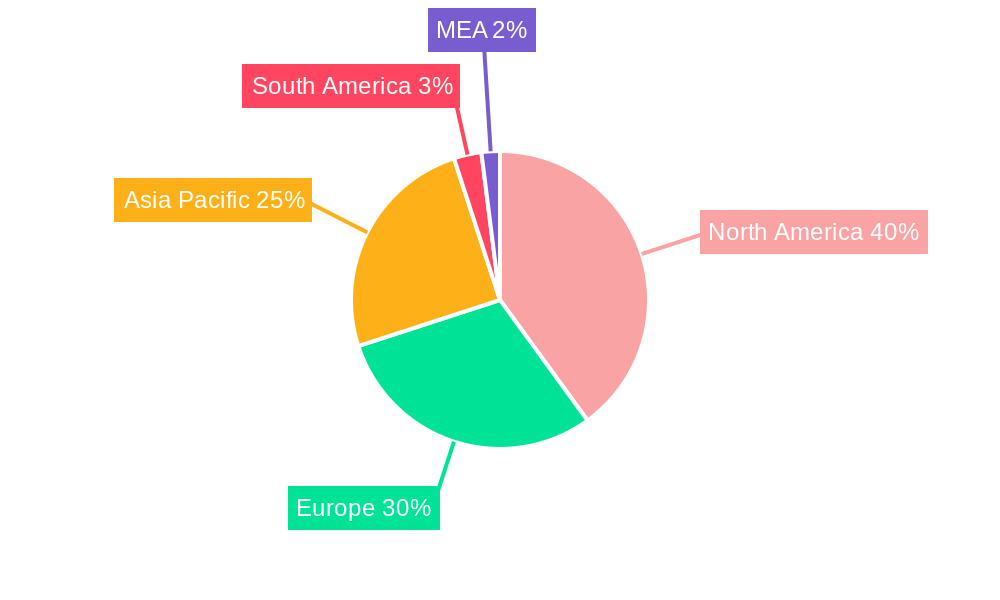
Co-packaged Optics Market Regional Market Share
Geographic Coverage of Co-packaged Optics Market
Co-packaged Optics Market REPORT HIGHLIGHTS
| Aspects | Details |
|---|---|
| Study Period | 2020-2034 |
| Base Year | 2025 |
| Estimated Year | 2026 |
| Forecast Period | 2026-2034 |
| Historical Period | 2020-2025 |
| Growth Rate | CAGR of 47.12% from 2020-2034 |
| Segmentation |
|
Table of Contents
- 1. Introduction
- 1.1. Research Scope
- 1.2. Market Segmentation
- 1.3. Research Objective
- 1.4. Definitions and Assumptions
- 2. Executive Summary
- 2.1. Market Snapshot
- 3. Market Dynamics
- 3.1. Market Drivers
- 3.2. Market Restrains
- 3.3. Market Trends
- 3.4. Market Opportunities
- 4. Market Factor Analysis
- 4.1. Porters Five Forces
- 4.1.1. Bargaining Power of Suppliers
- 4.1.2. Bargaining Power of Buyers
- 4.1.3. Threat of New Entrants
- 4.1.4. Threat of Substitutes
- 4.1.5. Competitive Rivalry
- 4.2. PESTEL analysis
- 4.3. BCG Analysis
- 4.3.1. Stars (High Growth, High Market Share)
- 4.3.2. Cash Cows (Low Growth, High Market Share)
- 4.3.3. Question Mark (High Growth, Low Market Share)
- 4.3.4. Dogs (Low Growth, Low Market Share)
- 4.4. Ansoff Matrix Analysis
- 4.5. Supply Chain Analysis
- 4.6. Regulatory Landscape
- 4.7. Current Market Potential and Opportunity Assessment (TAM–SAM–SOM Framework)
- 4.8. TIR Analyst Note
- 4.1. Porters Five Forces
- 5. Market Analysis, Insights and Forecast 2021-2033
- 5.1. Market Analysis, Insights and Forecast - by Data Rates
- 5.1.1. Less than 1.6 T
- 5.1.2. 3.2 T
- 5.1.3. 6.4 T
- 5.2. Market Analysis, Insights and Forecast - by Region
- 5.2.1. North America
- 5.2.2. Europe
- 5.2.3. Asia
- 5.2.4. Australia and New Zealand
- 5.2.5. Latin America
- 5.2.6. Middle East and Africa
- 5.1. Market Analysis, Insights and Forecast - by Data Rates
- 6. Global Co-packaged Optics Market Analysis, Insights and Forecast, 2021-2033
- 6.1. Market Analysis, Insights and Forecast - by Data Rates
- 6.1.1. Less than 1.6 T
- 6.1.2. 3.2 T
- 6.1.3. 6.4 T
- 6.1. Market Analysis, Insights and Forecast - by Data Rates
- 7. North America Co-packaged Optics Market Analysis, Insights and Forecast, 2020-2032
- 7.1. Market Analysis, Insights and Forecast - by Data Rates
- 7.1.1. Less than 1.6 T
- 7.1.2. 3.2 T
- 7.1.3. 6.4 T
- 7.1. Market Analysis, Insights and Forecast - by Data Rates
- 8. Europe Co-packaged Optics Market Analysis, Insights and Forecast, 2020-2032
- 8.1. Market Analysis, Insights and Forecast - by Data Rates
- 8.1.1. Less than 1.6 T
- 8.1.2. 3.2 T
- 8.1.3. 6.4 T
- 8.1. Market Analysis, Insights and Forecast - by Data Rates
- 9. Asia Co-packaged Optics Market Analysis, Insights and Forecast, 2020-2032
- 9.1. Market Analysis, Insights and Forecast - by Data Rates
- 9.1.1. Less than 1.6 T
- 9.1.2. 3.2 T
- 9.1.3. 6.4 T
- 9.1. Market Analysis, Insights and Forecast - by Data Rates
- 10. Australia and New Zealand Co-packaged Optics Market Analysis, Insights and Forecast, 2020-2032
- 10.1. Market Analysis, Insights and Forecast - by Data Rates
- 10.1.1. Less than 1.6 T
- 10.1.2. 3.2 T
- 10.1.3. 6.4 T
- 10.1. Market Analysis, Insights and Forecast - by Data Rates
- 11. Latin America Co-packaged Optics Market Analysis, Insights and Forecast, 2020-2032
- 11.1. Market Analysis, Insights and Forecast - by Data Rates
- 11.1.1. Less than 1.6 T
- 11.1.2. 3.2 T
- 11.1.3. 6.4 T
- 11.1. Market Analysis, Insights and Forecast - by Data Rates
- 12. Middle East and Africa Co-packaged Optics Market Analysis, Insights and Forecast, 2020-2032
- 12.1. Market Analysis, Insights and Forecast - by Data Rates
- 12.1.1. Less than 1.6 T
- 12.1.2. 3.2 T
- 12.1.3. 6.4 T
- 12.1. Market Analysis, Insights and Forecast - by Data Rates
- 13. Competitive Analysis
- 13.1. Company Profiles
- 13.1.1 Furukawa Electric Co Ltd
- 13.1.1.1. Company Overview
- 13.1.1.2. Products
- 13.1.1.3. Company Financials
- 13.1.1.4. SWOT Analysis
- 13.1.2 IBM Corporation
- 13.1.2.1. Company Overview
- 13.1.2.2. Products
- 13.1.2.3. Company Financials
- 13.1.2.4. SWOT Analysis
- 13.1.3 Kyocera Corporation
- 13.1.3.1. Company Overview
- 13.1.3.2. Products
- 13.1.3.3. Company Financials
- 13.1.3.4. SWOT Analysis
- 13.1.4 TE Connectivity
- 13.1.4.1. Company Overview
- 13.1.4.2. Products
- 13.1.4.3. Company Financials
- 13.1.4.4. SWOT Analysis
- 13.1.5 Cisco Systems Inc
- 13.1.5.1. Company Overview
- 13.1.5.2. Products
- 13.1.5.3. Company Financials
- 13.1.5.4. SWOT Analysis
- 13.1.6 Broadcom Inc
- 13.1.6.1. Company Overview
- 13.1.6.2. Products
- 13.1.6.3. Company Financials
- 13.1.6.4. SWOT Analysis
- 13.1.7 Microsoft Corporation
- 13.1.7.1. Company Overview
- 13.1.7.2. Products
- 13.1.7.3. Company Financials
- 13.1.7.4. SWOT Analysis
- 13.1.8 Ayar Labs Inc
- 13.1.8.1. Company Overview
- 13.1.8.2. Products
- 13.1.8.3. Company Financials
- 13.1.8.4. SWOT Analysis
- 13.1.9 Huawei Technologies Co Ltd
- 13.1.9.1. Company Overview
- 13.1.9.2. Products
- 13.1.9.3. Company Financials
- 13.1.9.4. SWOT Analysis
- 13.1.10 SENKO Advanced Components Inc
- 13.1.10.1. Company Overview
- 13.1.10.2. Products
- 13.1.10.3. Company Financials
- 13.1.10.4. SWOT Analysis
- 13.1.11 Hisense Broadband Multimedia Technology Co Ltd
- 13.1.11.1. Company Overview
- 13.1.11.2. Products
- 13.1.11.3. Company Financials
- 13.1.11.4. SWOT Analysis
- 13.1.12 Sumitomo Electric Industries Lt
- 13.1.12.1. Company Overview
- 13.1.12.2. Products
- 13.1.12.3. Company Financials
- 13.1.12.4. SWOT Analysis
- 13.1.13 Intel Corporation
- 13.1.13.1. Company Overview
- 13.1.13.2. Products
- 13.1.13.3. Company Financials
- 13.1.13.4. SWOT Analysis
- 13.1.14 POET Technologies
- 13.1.14.1. Company Overview
- 13.1.14.2. Products
- 13.1.14.3. Company Financials
- 13.1.14.4. SWOT Analysis
- 13.1.1 Furukawa Electric Co Ltd
- 13.2. Market Entropy
- 13.2.1 Company's Key Areas Served
- 13.2.2 Recent Developments
- 13.3. Company Market Share Analysis 2025
- 13.3.1 Top 5 Companies Market Share Analysis
- 13.3.2 Top 3 Companies Market Share Analysis
- 13.4. List of Potential Customers
- 14. Research Methodology
List of Figures
- Figure 1: Global Co-packaged Optics Market Revenue Breakdown (Million, %) by Region 2025 & 2033
- Figure 2: Global Co-packaged Optics Market Volume Breakdown (K Unit, %) by Region 2025 & 2033
- Figure 3: North America Co-packaged Optics Market Revenue (Million), by Data Rates 2025 & 2033
- Figure 4: North America Co-packaged Optics Market Volume (K Unit), by Data Rates 2025 & 2033
- Figure 5: North America Co-packaged Optics Market Revenue Share (%), by Data Rates 2025 & 2033
- Figure 6: North America Co-packaged Optics Market Volume Share (%), by Data Rates 2025 & 2033
- Figure 7: North America Co-packaged Optics Market Revenue (Million), by Country 2025 & 2033
- Figure 8: North America Co-packaged Optics Market Volume (K Unit), by Country 2025 & 2033
- Figure 9: North America Co-packaged Optics Market Revenue Share (%), by Country 2025 & 2033
- Figure 10: North America Co-packaged Optics Market Volume Share (%), by Country 2025 & 2033
- Figure 11: Europe Co-packaged Optics Market Revenue (Million), by Data Rates 2025 & 2033
- Figure 12: Europe Co-packaged Optics Market Volume (K Unit), by Data Rates 2025 & 2033
- Figure 13: Europe Co-packaged Optics Market Revenue Share (%), by Data Rates 2025 & 2033
- Figure 14: Europe Co-packaged Optics Market Volume Share (%), by Data Rates 2025 & 2033
- Figure 15: Europe Co-packaged Optics Market Revenue (Million), by Country 2025 & 2033
- Figure 16: Europe Co-packaged Optics Market Volume (K Unit), by Country 2025 & 2033
- Figure 17: Europe Co-packaged Optics Market Revenue Share (%), by Country 2025 & 2033
- Figure 18: Europe Co-packaged Optics Market Volume Share (%), by Country 2025 & 2033
- Figure 19: Asia Co-packaged Optics Market Revenue (Million), by Data Rates 2025 & 2033
- Figure 20: Asia Co-packaged Optics Market Volume (K Unit), by Data Rates 2025 & 2033
- Figure 21: Asia Co-packaged Optics Market Revenue Share (%), by Data Rates 2025 & 2033
- Figure 22: Asia Co-packaged Optics Market Volume Share (%), by Data Rates 2025 & 2033
- Figure 23: Asia Co-packaged Optics Market Revenue (Million), by Country 2025 & 2033
- Figure 24: Asia Co-packaged Optics Market Volume (K Unit), by Country 2025 & 2033
- Figure 25: Asia Co-packaged Optics Market Revenue Share (%), by Country 2025 & 2033
- Figure 26: Asia Co-packaged Optics Market Volume Share (%), by Country 2025 & 2033
- Figure 27: Australia and New Zealand Co-packaged Optics Market Revenue (Million), by Data Rates 2025 & 2033
- Figure 28: Australia and New Zealand Co-packaged Optics Market Volume (K Unit), by Data Rates 2025 & 2033
- Figure 29: Australia and New Zealand Co-packaged Optics Market Revenue Share (%), by Data Rates 2025 & 2033
- Figure 30: Australia and New Zealand Co-packaged Optics Market Volume Share (%), by Data Rates 2025 & 2033
- Figure 31: Australia and New Zealand Co-packaged Optics Market Revenue (Million), by Country 2025 & 2033
- Figure 32: Australia and New Zealand Co-packaged Optics Market Volume (K Unit), by Country 2025 & 2033
- Figure 33: Australia and New Zealand Co-packaged Optics Market Revenue Share (%), by Country 2025 & 2033
- Figure 34: Australia and New Zealand Co-packaged Optics Market Volume Share (%), by Country 2025 & 2033
- Figure 35: Latin America Co-packaged Optics Market Revenue (Million), by Data Rates 2025 & 2033
- Figure 36: Latin America Co-packaged Optics Market Volume (K Unit), by Data Rates 2025 & 2033
- Figure 37: Latin America Co-packaged Optics Market Revenue Share (%), by Data Rates 2025 & 2033
- Figure 38: Latin America Co-packaged Optics Market Volume Share (%), by Data Rates 2025 & 2033
- Figure 39: Latin America Co-packaged Optics Market Revenue (Million), by Country 2025 & 2033
- Figure 40: Latin America Co-packaged Optics Market Volume (K Unit), by Country 2025 & 2033
- Figure 41: Latin America Co-packaged Optics Market Revenue Share (%), by Country 2025 & 2033
- Figure 42: Latin America Co-packaged Optics Market Volume Share (%), by Country 2025 & 2033
- Figure 43: Middle East and Africa Co-packaged Optics Market Revenue (Million), by Data Rates 2025 & 2033
- Figure 44: Middle East and Africa Co-packaged Optics Market Volume (K Unit), by Data Rates 2025 & 2033
- Figure 45: Middle East and Africa Co-packaged Optics Market Revenue Share (%), by Data Rates 2025 & 2033
- Figure 46: Middle East and Africa Co-packaged Optics Market Volume Share (%), by Data Rates 2025 & 2033
- Figure 47: Middle East and Africa Co-packaged Optics Market Revenue (Million), by Country 2025 & 2033
- Figure 48: Middle East and Africa Co-packaged Optics Market Volume (K Unit), by Country 2025 & 2033
- Figure 49: Middle East and Africa Co-packaged Optics Market Revenue Share (%), by Country 2025 & 2033
- Figure 50: Middle East and Africa Co-packaged Optics Market Volume Share (%), by Country 2025 & 2033
List of Tables
- Table 1: Global Co-packaged Optics Market Revenue Million Forecast, by Data Rates 2020 & 2033
- Table 2: Global Co-packaged Optics Market Volume K Unit Forecast, by Data Rates 2020 & 2033
- Table 3: Global Co-packaged Optics Market Revenue Million Forecast, by Region 2020 & 2033
- Table 4: Global Co-packaged Optics Market Volume K Unit Forecast, by Region 2020 & 2033
- Table 5: Global Co-packaged Optics Market Revenue Million Forecast, by Data Rates 2020 & 2033
- Table 6: Global Co-packaged Optics Market Volume K Unit Forecast, by Data Rates 2020 & 2033
- Table 7: Global Co-packaged Optics Market Revenue Million Forecast, by Country 2020 & 2033
- Table 8: Global Co-packaged Optics Market Volume K Unit Forecast, by Country 2020 & 2033
- Table 9: Global Co-packaged Optics Market Revenue Million Forecast, by Data Rates 2020 & 2033
- Table 10: Global Co-packaged Optics Market Volume K Unit Forecast, by Data Rates 2020 & 2033
- Table 11: Global Co-packaged Optics Market Revenue Million Forecast, by Country 2020 & 2033
- Table 12: Global Co-packaged Optics Market Volume K Unit Forecast, by Country 2020 & 2033
- Table 13: Global Co-packaged Optics Market Revenue Million Forecast, by Data Rates 2020 & 2033
- Table 14: Global Co-packaged Optics Market Volume K Unit Forecast, by Data Rates 2020 & 2033
- Table 15: Global Co-packaged Optics Market Revenue Million Forecast, by Country 2020 & 2033
- Table 16: Global Co-packaged Optics Market Volume K Unit Forecast, by Country 2020 & 2033
- Table 17: Global Co-packaged Optics Market Revenue Million Forecast, by Data Rates 2020 & 2033
- Table 18: Global Co-packaged Optics Market Volume K Unit Forecast, by Data Rates 2020 & 2033
- Table 19: Global Co-packaged Optics Market Revenue Million Forecast, by Country 2020 & 2033
- Table 20: Global Co-packaged Optics Market Volume K Unit Forecast, by Country 2020 & 2033
- Table 21: Global Co-packaged Optics Market Revenue Million Forecast, by Data Rates 2020 & 2033
- Table 22: Global Co-packaged Optics Market Volume K Unit Forecast, by Data Rates 2020 & 2033
- Table 23: Global Co-packaged Optics Market Revenue Million Forecast, by Country 2020 & 2033
- Table 24: Global Co-packaged Optics Market Volume K Unit Forecast, by Country 2020 & 2033
- Table 25: Global Co-packaged Optics Market Revenue Million Forecast, by Data Rates 2020 & 2033
- Table 26: Global Co-packaged Optics Market Volume K Unit Forecast, by Data Rates 2020 & 2033
- Table 27: Global Co-packaged Optics Market Revenue Million Forecast, by Country 2020 & 2033
- Table 28: Global Co-packaged Optics Market Volume K Unit Forecast, by Country 2020 & 2033
Frequently Asked Questions
1. What is the projected Compound Annual Growth Rate (CAGR) of the Co-packaged Optics Market?
The projected CAGR is approximately 47.12%.
2. Which companies are prominent players in the Co-packaged Optics Market?
Key companies in the market include Furukawa Electric Co Ltd, IBM Corporation, Kyocera Corporation, TE Connectivity, Cisco Systems Inc, Broadcom Inc, Microsoft Corporation, Ayar Labs Inc, Huawei Technologies Co Ltd, SENKO Advanced Components Inc, Hisense Broadband Multimedia Technology Co Ltd, Sumitomo Electric Industries Lt, Intel Corporation, POET Technologies.
3. What are the main segments of the Co-packaged Optics Market?
The market segments include Data Rates.
4. Can you provide details about the market size?
The market size is estimated to be USD 70.20 Million as of 2022.
5. What are some drivers contributing to market growth?
Increase in Adoption of Smart Devices and Rise in Data Traffic; Growth in the Importance of Mega Data Centers; Growth in High-performance Computing.
6. What are the notable trends driving market growth?
Growth in High-performance Computing.
7. Are there any restraints impacting market growth?
Increase in Network Complexity; Device Compatibility and Sustainability Issues.
8. Can you provide examples of recent developments in the market?
March 2024: Intel developed a 4 Tbps bidirectional fully integrated OCI chiplet based on Intel’s in-house silicon photonics technology. This chiplet, or tile, contains a single silicon photonics integrated circuit (PIC) with integrated lasers, an electrical IC (EIC), and a path to incorporate a detachable/re-usable optical connector. The purpose of this development is to address the AI infrastructure’s significant need for bandwidth and to enable future scalability.
9. What pricing options are available for accessing the report?
Pricing options include single-user, multi-user, and enterprise licenses priced at USD 4750, USD 5250, and USD 8750 respectively.
10. Is the market size provided in terms of value or volume?
The market size is provided in terms of value, measured in Million and volume, measured in K Unit.
11. Are there any specific market keywords associated with the report?
Yes, the market keyword associated with the report is "Co-packaged Optics Market," which aids in identifying and referencing the specific market segment covered.
12. How do I determine which pricing option suits my needs best?
The pricing options vary based on user requirements and access needs. Individual users may opt for single-user licenses, while businesses requiring broader access may choose multi-user or enterprise licenses for cost-effective access to the report.
13. Are there any additional resources or data provided in the Co-packaged Optics Market report?
While the report offers comprehensive insights, it's advisable to review the specific contents or supplementary materials provided to ascertain if additional resources or data are available.
14. How can I stay updated on further developments or reports in the Co-packaged Optics Market?
To stay informed about further developments, trends, and reports in the Co-packaged Optics Market, consider subscribing to industry newsletters, following relevant companies and organizations, or regularly checking reputable industry news sources and publications.
Methodology
Step 1 - Identification of Relevant Samples Size from Population Database


Step 2 - Approaches for Defining Global Market Size (Value, Volume* & Price*)

Note*: In applicable scenarios
Step 3 - Data Sources
Primary Research
- Web Analytics
- Survey Reports
- Research Institute
- Latest Research Reports
- Opinion Leaders
Secondary Research
- Annual Reports
- White Paper
- Latest Press Release
- Industry Association
- Paid Database
- Investor Presentations

Step 4 - Data Triangulation
Involves using different sources of information in order to increase the validity of a study
These sources are likely to be stakeholders in a program - participants, other researchers, program staff, other community members, and so on.
Then we put all data in single framework & apply various statistical tools to find out the dynamic on the market.
During the analysis stage, feedback from the stakeholder groups would be compared to determine areas of agreement as well as areas of divergence