

Key Insights
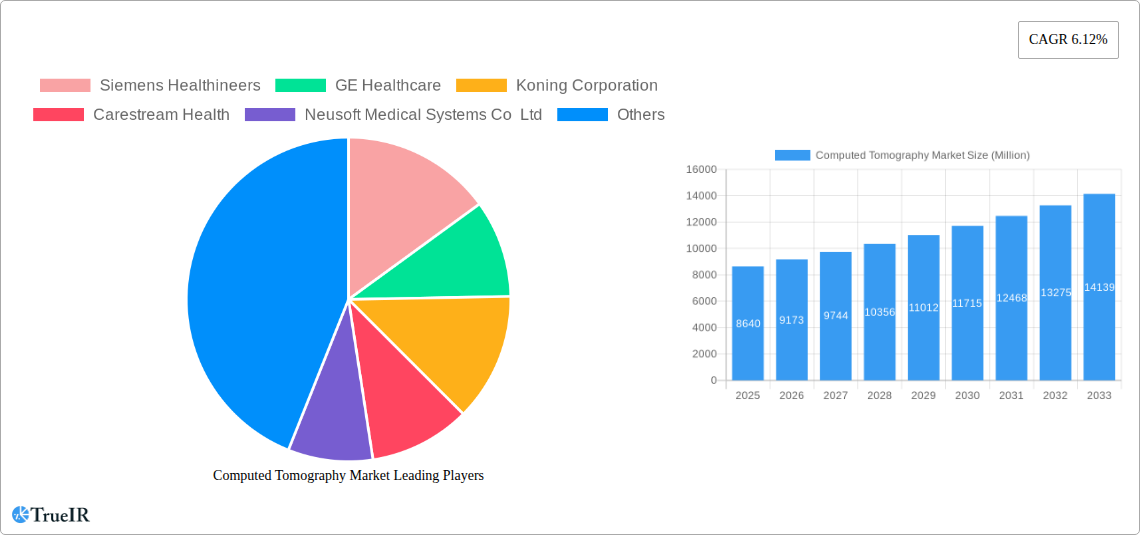
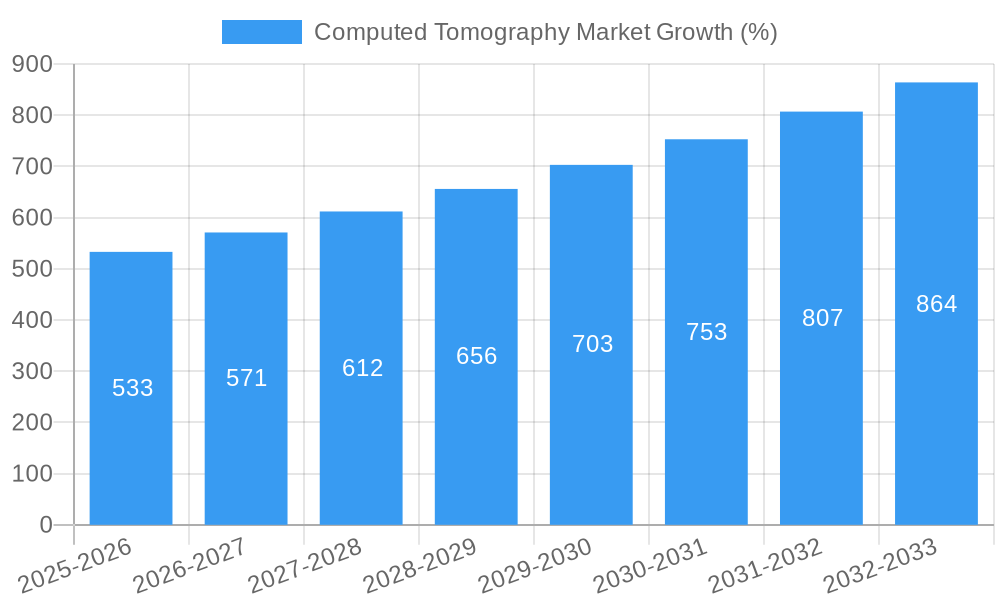
The Computed Tomography (CT) market, valued at $8.64 billion in 2025, is projected to experience robust growth, driven by a Compound Annual Growth Rate (CAGR) of 6.12% from 2025 to 2033. This expansion is fueled by several key factors. Technological advancements, such as multi-slice CT scanners offering faster scan times and improved image quality, are significantly enhancing diagnostic capabilities and driving market adoption. The rising prevalence of chronic diseases like cancer, cardiovascular diseases, and neurological disorders necessitates increased diagnostic imaging, further boosting demand for CT scans. Furthermore, the aging global population contributes to a higher incidence of these conditions, creating a larger patient pool requiring CT services. Growth is also spurred by the increasing adoption of advanced image reconstruction techniques and AI-powered diagnostic tools that improve accuracy and efficiency. The market segmentation reveals significant opportunities across different types of CT scanners (low, medium, and high slice), applications (oncology, neurology, cardiovascular, musculoskeletal), and end-users (hospitals, diagnostic centers). While advancements are driving the market, challenges remain. High capital costs associated with CT scanner acquisition and maintenance can limit adoption in resource-constrained settings. Regulatory hurdles and reimbursement policies also influence market growth.
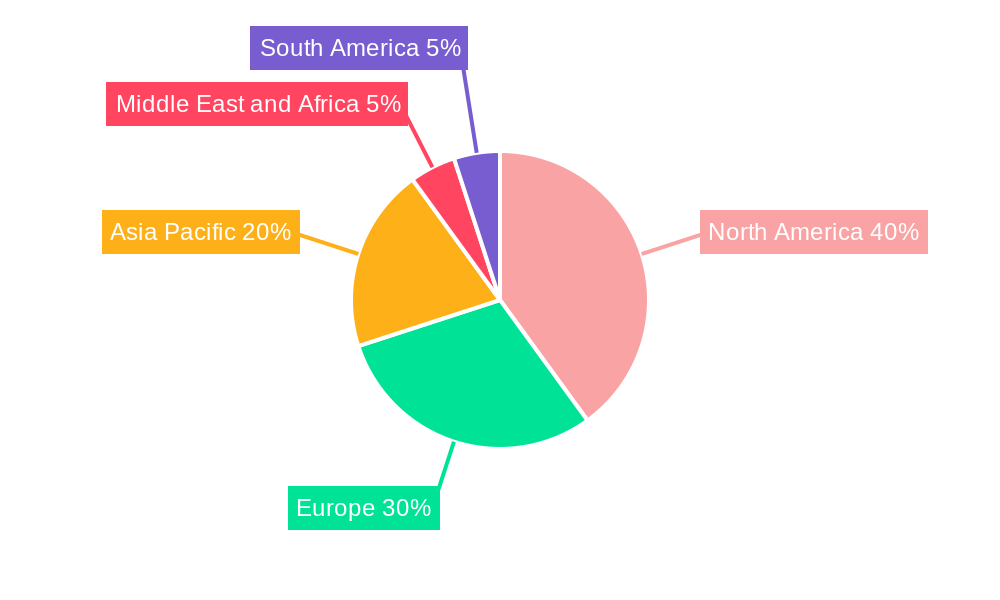
The geographical distribution of the CT market showcases significant regional variations. North America, with its advanced healthcare infrastructure and high adoption rates, currently holds a substantial market share. However, the Asia-Pacific region is expected to witness the fastest growth during the forecast period, driven by increasing healthcare expenditure, rising disposable incomes, and expanding diagnostic imaging infrastructure in developing economies like India and China. Europe also holds a significant share, attributed to a well-established healthcare system and a large aging population. Competition within the market is intense, with major players like Siemens Healthineers, GE Healthcare, and Canon Medical Systems continually innovating and expanding their product portfolios to maintain a competitive edge. Strategic collaborations, mergers, and acquisitions are expected to further shape the market landscape in the coming years. The future outlook for the CT market remains positive, with continuous technological improvements and increasing demand anticipated to drive substantial growth throughout the forecast period.
Computed Tomography (CT) Market: A Comprehensive Report (2019-2033)
This dynamic report provides a detailed analysis of the Computed Tomography (CT) market, offering invaluable insights for industry stakeholders, investors, and researchers. Covering the period from 2019 to 2033, with a focus on 2025, this study meticulously examines market size, segmentation, competitive landscape, technological advancements, and future growth potential. The report leverages extensive data analysis and expert insights to provide a holistic view of this rapidly evolving market, exceeding xx Million in 2025 and projected to reach xx Million by 2033.
Computed Tomography Market Market Structure & Competitive Landscape
The Computed Tomography (CT) market exhibits a moderately consolidated structure, with several key players dominating the global landscape. The market concentration ratio (CR4) is estimated at xx% in 2025, indicating the presence of a few dominant players. However, the market also accommodates numerous smaller players, especially in niche segments. Innovation is a crucial driver, with companies continually investing in technological advancements like photon-counting detectors and AI-powered image analysis to enhance diagnostic capabilities. Stringent regulatory frameworks, including those related to medical device approvals, significantly impact market dynamics. Product substitutes, primarily other medical imaging modalities like MRI and ultrasound, pose competitive pressure.
The market is largely segmented by end-users, primarily hospitals and diagnostic centers. The increasing adoption of CT scanners in these facilities accounts for the significant market growth. Mergers and acquisitions (M&A) activity is moderate but influential. The xx M&A deals reported between 2019 and 2024 indicate a trend toward consolidation and expansion of market share. This activity is primarily driven by companies aiming to enhance their technology portfolios and expand their global reach.
- Market Concentration: CR4 estimated at xx% in 2025.
- Innovation Drivers: Photon-counting detectors, AI-powered image analysis.
- Regulatory Impacts: Stringent medical device approval processes.
- Product Substitutes: MRI, Ultrasound.
- End-User Segmentation: Hospitals (xx%), Diagnostic Centers (xx%), Other End Users (xx%).
- M&A Trends: xx M&A deals between 2019 and 2024.
Computed Tomography Market Market Trends & Opportunities
The Computed Tomography (CT) market is experiencing robust growth, driven by several key factors. The market is projected to register a CAGR of xx% during the forecast period (2025-2033). This growth is fueled by several factors, including the rising prevalence of chronic diseases, technological advancements, increasing demand for early and accurate diagnosis, and expanding healthcare infrastructure globally. The market penetration rate of CT scanners is increasing steadily, particularly in emerging economies. Technological advancements, such as spectral CT and AI-integrated systems, are enhancing diagnostic accuracy and efficiency. Consumers increasingly prefer faster, more precise, and less invasive diagnostic methods, driving the adoption of advanced CT technologies.
The competitive landscape is dynamic, with companies constantly striving for innovation and market share expansion. This leads to improved product offerings, better cost-effectiveness, and a wider range of applications for CT scans. The growing integration of AI into CT systems opens new avenues for image analysis, diagnostic support, and personalized healthcare. This trend is expected to accelerate market growth and create new opportunities. The market is also witnessing increased adoption of cloud-based platforms for data storage and analysis, promoting greater efficiency and accessibility.
Dominant Markets & Segments in Computed Tomography Market
The North American region dominates the Computed Tomography market, driven by high healthcare expenditure, technological advancements, and a large installed base of CT scanners. However, the Asia-Pacific region is anticipated to exhibit the fastest growth rate during the forecast period due to rising healthcare expenditure, increasing prevalence of chronic diseases, and expanding healthcare infrastructure. Within segments:
- Type: High-slice CT scanners currently command the largest market share due to their superior imaging capabilities. However, medium-slice CT scanners are experiencing significant growth driven by cost effectiveness.
- Application: Oncology remains the largest application segment owing to the extensive use of CT scans in cancer diagnosis and treatment planning. However, the cardiovascular and musculoskeletal application segments are also experiencing notable growth.
- End-User: Hospitals constitute the largest end-user segment, due to their extensive diagnostic needs.
Key Growth Drivers:
- North America: High healthcare expenditure, advanced technology adoption.
- Asia-Pacific: Rising healthcare expenditure, increasing prevalence of chronic diseases, expanding healthcare infrastructure.
- High-Slice CT: Superior imaging capabilities.
- Oncology Application: Extensive use in cancer diagnosis and treatment.
Computed Tomography Market Product Analysis
Recent innovations in Computed Tomography have focused on enhancing image quality, reducing radiation exposure, and improving diagnostic capabilities. Photon-counting detectors, spectral CT, and AI-powered image analysis are transforming the field, enabling more accurate and precise diagnoses. These advancements are improving the market fit of CT scanners across various applications, from oncology and cardiology to neurology and musculoskeletal imaging. The competitive advantage lies in offering superior image quality, faster scan times, reduced radiation dose, and advanced software functionalities for efficient image analysis and reporting.
Key Drivers, Barriers & Challenges in Computed Tomography Market
Key Drivers:
- Technological advancements: Improved image quality, reduced radiation dose, AI integration.
- Rising prevalence of chronic diseases: Increased demand for early and accurate diagnosis.
- Expanding healthcare infrastructure: Increased accessibility to advanced medical imaging technologies.
- Favorable regulatory environment: Streamlined approval processes for innovative CT technologies in some regions.
Challenges & Restraints:
- High cost of equipment: Limits accessibility in resource-constrained settings.
- Complex regulatory landscape: Lengthy approval processes and stringent safety standards.
- Competition from alternative imaging modalities: MRI, ultrasound, and nuclear medicine.
- Supply chain disruptions: Potential impact on the availability and cost of components. Quantifiable impact estimated at xx% reduction in production during periods of disruption.
Growth Drivers in the Computed Tomography Market Market
Technological advancements, rising prevalence of chronic diseases, expansion of healthcare infrastructure, and favorable regulatory environments are key drivers. Specific examples include the development of AI-powered image analysis tools and photon-counting detectors that enhance diagnostic accuracy and reduce radiation exposure. Growing adoption in emerging markets represents significant growth potential.
Challenges Impacting Computed Tomography Market Growth
High equipment costs, regulatory complexities leading to prolonged approval times, competition from other imaging modalities, and supply chain disruptions represent significant challenges. These factors can constrain market expansion and impact affordability, especially in low-resource settings. Quantifiable impact of supply chain issues can lead to xx% price increase in certain components.
Key Players Shaping the Computed Tomography Market Market
- Siemens Healthineers
- GE Healthcare
- Koning Corporation
- Carestream Health
- Neusoft Medical Systems Co Ltd
- Stryker Corporation
- Koninklijke Philips NV
- Canon Medical Systems Corporation
- Planmeca Group (Planmed OY)
- Shimadzu Corporation
- Fujifilm Holdings Corporation
Significant Computed Tomography Market Industry Milestones
- May 2021: Royal Philips launched the spectral detector-based Spectral Computed Tomography (CT) 7500 for precision diagnostics.
- November 2021: Siemens Healthineers launched the Naeotom Alpha, a photon-counting CT scanner cleared for clinical use in the US and Europe.
- April 2022: Siemens commenced a new CT scanner production line in Bengaluru, India.
- April 2022: Wipro GE Healthcare launched the Revolution Aspire CT scanner, manufactured in India.
- June 2022: Trivitron Healthcare announced plans to launch made-in-India CT and MRI systems.
Future Outlook for Computed Tomography Market Market
The Computed Tomography market is poised for continued growth, driven by ongoing technological advancements, increasing demand in emerging markets, and the expanding applications of CT in various medical specialties. Strategic opportunities exist for companies focusing on innovation in areas like AI-powered image analysis, spectral CT, and miniaturization of CT scanners to improve accessibility and affordability. The market's future is bright, with substantial potential for expansion and diversification across diverse healthcare settings.
Computed Tomography Market Segmentation
-
1. Type
- 1.1. Low Slice
- 1.2. Medium Slice
- 1.3. High Slice
-
2. Application
- 2.1. Oncology
- 2.2. Neurology
- 2.3. Cardiovascular
- 2.4. Musculoskeletal
- 2.5. Other Applications
-
3. End User
- 3.1. Hospitals
- 3.2. Diagnostic Centers
- 3.3. Other End Users
Computed Tomography Market Segmentation By Geography
-
1. North America
- 1.1. United States
- 1.2. Canada
- 1.3. Mexico
-
2. Europe
- 2.1. Germany
- 2.2. United Kingdom
- 2.3. France
- 2.4. Italy
- 2.5. Spain
- 2.6. Rest of Europe
-
3. Asia Pacific
- 3.1. China
- 3.2. Japan
- 3.3. India
- 3.4. Australia
- 3.5. South Korea
- 3.6. Rest of Asia Pacific
-
4. Middle East and Africa
- 4.1. GCC
- 4.2. South Africa
- 4.3. Rest of Middle East and Africa
-
5. South America
- 5.1. Brazil
- 5.2. Argentina
- 5.3. Rest of South America
Computed Tomography Market REPORT HIGHLIGHTS
| Aspects | Details |
|---|---|
| Study Period | 2019-2033 |
| Base Year | 2024 |
| Estimated Year | 2025 |
| Forecast Period | 2025-2033 |
| Historical Period | 2019-2024 |
| Growth Rate | CAGR of 6.12% from 2019-2033 |
| Segmentation |
|
Table of Contents
- 1. Introduction
- 1.1. Research Scope
- 1.2. Market Segmentation
- 1.3. Research Methodology
- 1.4. Definitions and Assumptions
- 2. Executive Summary
- 2.1. Introduction
- 3. Market Dynamics
- 3.1. Introduction
- 3.2. Market Drivers
- 3.2.1. Rising Geriatric Population and Increasing Incidences of Chronic Diseases; Shifting Medical Care Toward Image-guided Interventions; Technological Advancements
- 3.3. Market Restrains
- 3.3.1. Lack of Adequate Reimbursement; Stringent Regulatory Framework
- 3.4. Market Trends
- 3.4.1. The High Slice Segment is Expected to Observe Healthy Growth
- 4. Market Factor Analysis
- 4.1. Porters Five Forces
- 4.2. Supply/Value Chain
- 4.3. PESTEL analysis
- 4.4. Market Entropy
- 4.5. Patent/Trademark Analysis
- 5. Global Computed Tomography Market Analysis, Insights and Forecast, 2019-2031
- 5.1. Market Analysis, Insights and Forecast - by Type
- 5.1.1. Low Slice
- 5.1.2. Medium Slice
- 5.1.3. High Slice
- 5.2. Market Analysis, Insights and Forecast - by Application
- 5.2.1. Oncology
- 5.2.2. Neurology
- 5.2.3. Cardiovascular
- 5.2.4. Musculoskeletal
- 5.2.5. Other Applications
- 5.3. Market Analysis, Insights and Forecast - by End User
- 5.3.1. Hospitals
- 5.3.2. Diagnostic Centers
- 5.3.3. Other End Users
- 5.4. Market Analysis, Insights and Forecast - by Region
- 5.4.1. North America
- 5.4.2. Europe
- 5.4.3. Asia Pacific
- 5.4.4. Middle East and Africa
- 5.4.5. South America
- 5.1. Market Analysis, Insights and Forecast - by Type
- 6. North America Computed Tomography Market Analysis, Insights and Forecast, 2019-2031
- 6.1. Market Analysis, Insights and Forecast - by Type
- 6.1.1. Low Slice
- 6.1.2. Medium Slice
- 6.1.3. High Slice
- 6.2. Market Analysis, Insights and Forecast - by Application
- 6.2.1. Oncology
- 6.2.2. Neurology
- 6.2.3. Cardiovascular
- 6.2.4. Musculoskeletal
- 6.2.5. Other Applications
- 6.3. Market Analysis, Insights and Forecast - by End User
- 6.3.1. Hospitals
- 6.3.2. Diagnostic Centers
- 6.3.3. Other End Users
- 6.1. Market Analysis, Insights and Forecast - by Type
- 7. Europe Computed Tomography Market Analysis, Insights and Forecast, 2019-2031
- 7.1. Market Analysis, Insights and Forecast - by Type
- 7.1.1. Low Slice
- 7.1.2. Medium Slice
- 7.1.3. High Slice
- 7.2. Market Analysis, Insights and Forecast - by Application
- 7.2.1. Oncology
- 7.2.2. Neurology
- 7.2.3. Cardiovascular
- 7.2.4. Musculoskeletal
- 7.2.5. Other Applications
- 7.3. Market Analysis, Insights and Forecast - by End User
- 7.3.1. Hospitals
- 7.3.2. Diagnostic Centers
- 7.3.3. Other End Users
- 7.1. Market Analysis, Insights and Forecast - by Type
- 8. Asia Pacific Computed Tomography Market Analysis, Insights and Forecast, 2019-2031
- 8.1. Market Analysis, Insights and Forecast - by Type
- 8.1.1. Low Slice
- 8.1.2. Medium Slice
- 8.1.3. High Slice
- 8.2. Market Analysis, Insights and Forecast - by Application
- 8.2.1. Oncology
- 8.2.2. Neurology
- 8.2.3. Cardiovascular
- 8.2.4. Musculoskeletal
- 8.2.5. Other Applications
- 8.3. Market Analysis, Insights and Forecast - by End User
- 8.3.1. Hospitals
- 8.3.2. Diagnostic Centers
- 8.3.3. Other End Users
- 8.1. Market Analysis, Insights and Forecast - by Type
- 9. Middle East and Africa Computed Tomography Market Analysis, Insights and Forecast, 2019-2031
- 9.1. Market Analysis, Insights and Forecast - by Type
- 9.1.1. Low Slice
- 9.1.2. Medium Slice
- 9.1.3. High Slice
- 9.2. Market Analysis, Insights and Forecast - by Application
- 9.2.1. Oncology
- 9.2.2. Neurology
- 9.2.3. Cardiovascular
- 9.2.4. Musculoskeletal
- 9.2.5. Other Applications
- 9.3. Market Analysis, Insights and Forecast - by End User
- 9.3.1. Hospitals
- 9.3.2. Diagnostic Centers
- 9.3.3. Other End Users
- 9.1. Market Analysis, Insights and Forecast - by Type
- 10. South America Computed Tomography Market Analysis, Insights and Forecast, 2019-2031
- 10.1. Market Analysis, Insights and Forecast - by Type
- 10.1.1. Low Slice
- 10.1.2. Medium Slice
- 10.1.3. High Slice
- 10.2. Market Analysis, Insights and Forecast - by Application
- 10.2.1. Oncology
- 10.2.2. Neurology
- 10.2.3. Cardiovascular
- 10.2.4. Musculoskeletal
- 10.2.5. Other Applications
- 10.3. Market Analysis, Insights and Forecast - by End User
- 10.3.1. Hospitals
- 10.3.2. Diagnostic Centers
- 10.3.3. Other End Users
- 10.1. Market Analysis, Insights and Forecast - by Type
- 11. North America Computed Tomography Market Analysis, Insights and Forecast, 2019-2031
- 11.1. Market Analysis, Insights and Forecast - By Country/Sub-region
- 11.1.1 United States
- 11.1.2 Canada
- 11.1.3 Mexico
- 12. Europe Computed Tomography Market Analysis, Insights and Forecast, 2019-2031
- 12.1. Market Analysis, Insights and Forecast - By Country/Sub-region
- 12.1.1 Germany
- 12.1.2 United Kingdom
- 12.1.3 France
- 12.1.4 Italy
- 12.1.5 Spain
- 12.1.6 Rest of Europe
- 13. Asia Pacific Computed Tomography Market Analysis, Insights and Forecast, 2019-2031
- 13.1. Market Analysis, Insights and Forecast - By Country/Sub-region
- 13.1.1 China
- 13.1.2 Japan
- 13.1.3 India
- 13.1.4 Australia
- 13.1.5 South Korea
- 13.1.6 Rest of Asia Pacific
- 14. Middle East and Africa Computed Tomography Market Analysis, Insights and Forecast, 2019-2031
- 14.1. Market Analysis, Insights and Forecast - By Country/Sub-region
- 14.1.1 GCC
- 14.1.2 South Africa
- 14.1.3 Rest of Middle East and Africa
- 15. South America Computed Tomography Market Analysis, Insights and Forecast, 2019-2031
- 15.1. Market Analysis, Insights and Forecast - By Country/Sub-region
- 15.1.1 Brazil
- 15.1.2 Argentina
- 15.1.3 Rest of South America
- 16. Competitive Analysis
- 16.1. Global Market Share Analysis 2024
- 16.2. Company Profiles
- 16.2.1 Siemens Healthineers
- 16.2.1.1. Overview
- 16.2.1.2. Products
- 16.2.1.3. SWOT Analysis
- 16.2.1.4. Recent Developments
- 16.2.1.5. Financials (Based on Availability)
- 16.2.2 GE Healthcare
- 16.2.2.1. Overview
- 16.2.2.2. Products
- 16.2.2.3. SWOT Analysis
- 16.2.2.4. Recent Developments
- 16.2.2.5. Financials (Based on Availability)
- 16.2.3 Koning Corporation
- 16.2.3.1. Overview
- 16.2.3.2. Products
- 16.2.3.3. SWOT Analysis
- 16.2.3.4. Recent Developments
- 16.2.3.5. Financials (Based on Availability)
- 16.2.4 Carestream Health
- 16.2.4.1. Overview
- 16.2.4.2. Products
- 16.2.4.3. SWOT Analysis
- 16.2.4.4. Recent Developments
- 16.2.4.5. Financials (Based on Availability)
- 16.2.5 Neusoft Medical Systems Co Ltd
- 16.2.5.1. Overview
- 16.2.5.2. Products
- 16.2.5.3. SWOT Analysis
- 16.2.5.4. Recent Developments
- 16.2.5.5. Financials (Based on Availability)
- 16.2.6 Stryker Corporation
- 16.2.6.1. Overview
- 16.2.6.2. Products
- 16.2.6.3. SWOT Analysis
- 16.2.6.4. Recent Developments
- 16.2.6.5. Financials (Based on Availability)
- 16.2.7 Koninklijke Philips NV
- 16.2.7.1. Overview
- 16.2.7.2. Products
- 16.2.7.3. SWOT Analysis
- 16.2.7.4. Recent Developments
- 16.2.7.5. Financials (Based on Availability)
- 16.2.8 Canon Medical Systems Corporation
- 16.2.8.1. Overview
- 16.2.8.2. Products
- 16.2.8.3. SWOT Analysis
- 16.2.8.4. Recent Developments
- 16.2.8.5. Financials (Based on Availability)
- 16.2.9 Planmeca Group (Planmed OY)
- 16.2.9.1. Overview
- 16.2.9.2. Products
- 16.2.9.3. SWOT Analysis
- 16.2.9.4. Recent Developments
- 16.2.9.5. Financials (Based on Availability)
- 16.2.10 Shimadzu Corporation
- 16.2.10.1. Overview
- 16.2.10.2. Products
- 16.2.10.3. SWOT Analysis
- 16.2.10.4. Recent Developments
- 16.2.10.5. Financials (Based on Availability)
- 16.2.11 Fujifilm Holdings Corporation
- 16.2.11.1. Overview
- 16.2.11.2. Products
- 16.2.11.3. SWOT Analysis
- 16.2.11.4. Recent Developments
- 16.2.11.5. Financials (Based on Availability)
- 16.2.1 Siemens Healthineers
List of Figures
- Figure 1: Global Computed Tomography Market Revenue Breakdown (Million, %) by Region 2024 & 2032
- Figure 2: North America Computed Tomography Market Revenue (Million), by Country 2024 & 2032
- Figure 3: North America Computed Tomography Market Revenue Share (%), by Country 2024 & 2032
- Figure 4: Europe Computed Tomography Market Revenue (Million), by Country 2024 & 2032
- Figure 5: Europe Computed Tomography Market Revenue Share (%), by Country 2024 & 2032
- Figure 6: Asia Pacific Computed Tomography Market Revenue (Million), by Country 2024 & 2032
- Figure 7: Asia Pacific Computed Tomography Market Revenue Share (%), by Country 2024 & 2032
- Figure 8: Middle East and Africa Computed Tomography Market Revenue (Million), by Country 2024 & 2032
- Figure 9: Middle East and Africa Computed Tomography Market Revenue Share (%), by Country 2024 & 2032
- Figure 10: South America Computed Tomography Market Revenue (Million), by Country 2024 & 2032
- Figure 11: South America Computed Tomography Market Revenue Share (%), by Country 2024 & 2032
- Figure 12: North America Computed Tomography Market Revenue (Million), by Type 2024 & 2032
- Figure 13: North America Computed Tomography Market Revenue Share (%), by Type 2024 & 2032
- Figure 14: North America Computed Tomography Market Revenue (Million), by Application 2024 & 2032
- Figure 15: North America Computed Tomography Market Revenue Share (%), by Application 2024 & 2032
- Figure 16: North America Computed Tomography Market Revenue (Million), by End User 2024 & 2032
- Figure 17: North America Computed Tomography Market Revenue Share (%), by End User 2024 & 2032
- Figure 18: North America Computed Tomography Market Revenue (Million), by Country 2024 & 2032
- Figure 19: North America Computed Tomography Market Revenue Share (%), by Country 2024 & 2032
- Figure 20: Europe Computed Tomography Market Revenue (Million), by Type 2024 & 2032
- Figure 21: Europe Computed Tomography Market Revenue Share (%), by Type 2024 & 2032
- Figure 22: Europe Computed Tomography Market Revenue (Million), by Application 2024 & 2032
- Figure 23: Europe Computed Tomography Market Revenue Share (%), by Application 2024 & 2032
- Figure 24: Europe Computed Tomography Market Revenue (Million), by End User 2024 & 2032
- Figure 25: Europe Computed Tomography Market Revenue Share (%), by End User 2024 & 2032
- Figure 26: Europe Computed Tomography Market Revenue (Million), by Country 2024 & 2032
- Figure 27: Europe Computed Tomography Market Revenue Share (%), by Country 2024 & 2032
- Figure 28: Asia Pacific Computed Tomography Market Revenue (Million), by Type 2024 & 2032
- Figure 29: Asia Pacific Computed Tomography Market Revenue Share (%), by Type 2024 & 2032
- Figure 30: Asia Pacific Computed Tomography Market Revenue (Million), by Application 2024 & 2032
- Figure 31: Asia Pacific Computed Tomography Market Revenue Share (%), by Application 2024 & 2032
- Figure 32: Asia Pacific Computed Tomography Market Revenue (Million), by End User 2024 & 2032
- Figure 33: Asia Pacific Computed Tomography Market Revenue Share (%), by End User 2024 & 2032
- Figure 34: Asia Pacific Computed Tomography Market Revenue (Million), by Country 2024 & 2032
- Figure 35: Asia Pacific Computed Tomography Market Revenue Share (%), by Country 2024 & 2032
- Figure 36: Middle East and Africa Computed Tomography Market Revenue (Million), by Type 2024 & 2032
- Figure 37: Middle East and Africa Computed Tomography Market Revenue Share (%), by Type 2024 & 2032
- Figure 38: Middle East and Africa Computed Tomography Market Revenue (Million), by Application 2024 & 2032
- Figure 39: Middle East and Africa Computed Tomography Market Revenue Share (%), by Application 2024 & 2032
- Figure 40: Middle East and Africa Computed Tomography Market Revenue (Million), by End User 2024 & 2032
- Figure 41: Middle East and Africa Computed Tomography Market Revenue Share (%), by End User 2024 & 2032
- Figure 42: Middle East and Africa Computed Tomography Market Revenue (Million), by Country 2024 & 2032
- Figure 43: Middle East and Africa Computed Tomography Market Revenue Share (%), by Country 2024 & 2032
- Figure 44: South America Computed Tomography Market Revenue (Million), by Type 2024 & 2032
- Figure 45: South America Computed Tomography Market Revenue Share (%), by Type 2024 & 2032
- Figure 46: South America Computed Tomography Market Revenue (Million), by Application 2024 & 2032
- Figure 47: South America Computed Tomography Market Revenue Share (%), by Application 2024 & 2032
- Figure 48: South America Computed Tomography Market Revenue (Million), by End User 2024 & 2032
- Figure 49: South America Computed Tomography Market Revenue Share (%), by End User 2024 & 2032
- Figure 50: South America Computed Tomography Market Revenue (Million), by Country 2024 & 2032
- Figure 51: South America Computed Tomography Market Revenue Share (%), by Country 2024 & 2032
List of Tables
- Table 1: Global Computed Tomography Market Revenue Million Forecast, by Region 2019 & 2032
- Table 2: Global Computed Tomography Market Revenue Million Forecast, by Type 2019 & 2032
- Table 3: Global Computed Tomography Market Revenue Million Forecast, by Application 2019 & 2032
- Table 4: Global Computed Tomography Market Revenue Million Forecast, by End User 2019 & 2032
- Table 5: Global Computed Tomography Market Revenue Million Forecast, by Region 2019 & 2032
- Table 6: Global Computed Tomography Market Revenue Million Forecast, by Country 2019 & 2032
- Table 7: United States Computed Tomography Market Revenue (Million) Forecast, by Application 2019 & 2032
- Table 8: Canada Computed Tomography Market Revenue (Million) Forecast, by Application 2019 & 2032
- Table 9: Mexico Computed Tomography Market Revenue (Million) Forecast, by Application 2019 & 2032
- Table 10: Global Computed Tomography Market Revenue Million Forecast, by Country 2019 & 2032
- Table 11: Germany Computed Tomography Market Revenue (Million) Forecast, by Application 2019 & 2032
- Table 12: United Kingdom Computed Tomography Market Revenue (Million) Forecast, by Application 2019 & 2032
- Table 13: France Computed Tomography Market Revenue (Million) Forecast, by Application 2019 & 2032
- Table 14: Italy Computed Tomography Market Revenue (Million) Forecast, by Application 2019 & 2032
- Table 15: Spain Computed Tomography Market Revenue (Million) Forecast, by Application 2019 & 2032
- Table 16: Rest of Europe Computed Tomography Market Revenue (Million) Forecast, by Application 2019 & 2032
- Table 17: Global Computed Tomography Market Revenue Million Forecast, by Country 2019 & 2032
- Table 18: China Computed Tomography Market Revenue (Million) Forecast, by Application 2019 & 2032
- Table 19: Japan Computed Tomography Market Revenue (Million) Forecast, by Application 2019 & 2032
- Table 20: India Computed Tomography Market Revenue (Million) Forecast, by Application 2019 & 2032
- Table 21: Australia Computed Tomography Market Revenue (Million) Forecast, by Application 2019 & 2032
- Table 22: South Korea Computed Tomography Market Revenue (Million) Forecast, by Application 2019 & 2032
- Table 23: Rest of Asia Pacific Computed Tomography Market Revenue (Million) Forecast, by Application 2019 & 2032
- Table 24: Global Computed Tomography Market Revenue Million Forecast, by Country 2019 & 2032
- Table 25: GCC Computed Tomography Market Revenue (Million) Forecast, by Application 2019 & 2032
- Table 26: South Africa Computed Tomography Market Revenue (Million) Forecast, by Application 2019 & 2032
- Table 27: Rest of Middle East and Africa Computed Tomography Market Revenue (Million) Forecast, by Application 2019 & 2032
- Table 28: Global Computed Tomography Market Revenue Million Forecast, by Country 2019 & 2032
- Table 29: Brazil Computed Tomography Market Revenue (Million) Forecast, by Application 2019 & 2032
- Table 30: Argentina Computed Tomography Market Revenue (Million) Forecast, by Application 2019 & 2032
- Table 31: Rest of South America Computed Tomography Market Revenue (Million) Forecast, by Application 2019 & 2032
- Table 32: Global Computed Tomography Market Revenue Million Forecast, by Type 2019 & 2032
- Table 33: Global Computed Tomography Market Revenue Million Forecast, by Application 2019 & 2032
- Table 34: Global Computed Tomography Market Revenue Million Forecast, by End User 2019 & 2032
- Table 35: Global Computed Tomography Market Revenue Million Forecast, by Country 2019 & 2032
- Table 36: United States Computed Tomography Market Revenue (Million) Forecast, by Application 2019 & 2032
- Table 37: Canada Computed Tomography Market Revenue (Million) Forecast, by Application 2019 & 2032
- Table 38: Mexico Computed Tomography Market Revenue (Million) Forecast, by Application 2019 & 2032
- Table 39: Global Computed Tomography Market Revenue Million Forecast, by Type 2019 & 2032
- Table 40: Global Computed Tomography Market Revenue Million Forecast, by Application 2019 & 2032
- Table 41: Global Computed Tomography Market Revenue Million Forecast, by End User 2019 & 2032
- Table 42: Global Computed Tomography Market Revenue Million Forecast, by Country 2019 & 2032
- Table 43: Germany Computed Tomography Market Revenue (Million) Forecast, by Application 2019 & 2032
- Table 44: United Kingdom Computed Tomography Market Revenue (Million) Forecast, by Application 2019 & 2032
- Table 45: France Computed Tomography Market Revenue (Million) Forecast, by Application 2019 & 2032
- Table 46: Italy Computed Tomography Market Revenue (Million) Forecast, by Application 2019 & 2032
- Table 47: Spain Computed Tomography Market Revenue (Million) Forecast, by Application 2019 & 2032
- Table 48: Rest of Europe Computed Tomography Market Revenue (Million) Forecast, by Application 2019 & 2032
- Table 49: Global Computed Tomography Market Revenue Million Forecast, by Type 2019 & 2032
- Table 50: Global Computed Tomography Market Revenue Million Forecast, by Application 2019 & 2032
- Table 51: Global Computed Tomography Market Revenue Million Forecast, by End User 2019 & 2032
- Table 52: Global Computed Tomography Market Revenue Million Forecast, by Country 2019 & 2032
- Table 53: China Computed Tomography Market Revenue (Million) Forecast, by Application 2019 & 2032
- Table 54: Japan Computed Tomography Market Revenue (Million) Forecast, by Application 2019 & 2032
- Table 55: India Computed Tomography Market Revenue (Million) Forecast, by Application 2019 & 2032
- Table 56: Australia Computed Tomography Market Revenue (Million) Forecast, by Application 2019 & 2032
- Table 57: South Korea Computed Tomography Market Revenue (Million) Forecast, by Application 2019 & 2032
- Table 58: Rest of Asia Pacific Computed Tomography Market Revenue (Million) Forecast, by Application 2019 & 2032
- Table 59: Global Computed Tomography Market Revenue Million Forecast, by Type 2019 & 2032
- Table 60: Global Computed Tomography Market Revenue Million Forecast, by Application 2019 & 2032
- Table 61: Global Computed Tomography Market Revenue Million Forecast, by End User 2019 & 2032
- Table 62: Global Computed Tomography Market Revenue Million Forecast, by Country 2019 & 2032
- Table 63: GCC Computed Tomography Market Revenue (Million) Forecast, by Application 2019 & 2032
- Table 64: South Africa Computed Tomography Market Revenue (Million) Forecast, by Application 2019 & 2032
- Table 65: Rest of Middle East and Africa Computed Tomography Market Revenue (Million) Forecast, by Application 2019 & 2032
- Table 66: Global Computed Tomography Market Revenue Million Forecast, by Type 2019 & 2032
- Table 67: Global Computed Tomography Market Revenue Million Forecast, by Application 2019 & 2032
- Table 68: Global Computed Tomography Market Revenue Million Forecast, by End User 2019 & 2032
- Table 69: Global Computed Tomography Market Revenue Million Forecast, by Country 2019 & 2032
- Table 70: Brazil Computed Tomography Market Revenue (Million) Forecast, by Application 2019 & 2032
- Table 71: Argentina Computed Tomography Market Revenue (Million) Forecast, by Application 2019 & 2032
- Table 72: Rest of South America Computed Tomography Market Revenue (Million) Forecast, by Application 2019 & 2032
Frequently Asked Questions
1. What is the projected Compound Annual Growth Rate (CAGR) of the Computed Tomography Market?
The projected CAGR is approximately 6.12%.
2. Which companies are prominent players in the Computed Tomography Market?
Key companies in the market include Siemens Healthineers, GE Healthcare, Koning Corporation, Carestream Health, Neusoft Medical Systems Co Ltd, Stryker Corporation, Koninklijke Philips NV, Canon Medical Systems Corporation, Planmeca Group (Planmed OY), Shimadzu Corporation, Fujifilm Holdings Corporation.
3. What are the main segments of the Computed Tomography Market?
The market segments include Type, Application, End User.
4. Can you provide details about the market size?
The market size is estimated to be USD 8.64 Million as of 2022.
5. What are some drivers contributing to market growth?
Rising Geriatric Population and Increasing Incidences of Chronic Diseases; Shifting Medical Care Toward Image-guided Interventions; Technological Advancements.
6. What are the notable trends driving market growth?
The High Slice Segment is Expected to Observe Healthy Growth.
7. Are there any restraints impacting market growth?
Lack of Adequate Reimbursement; Stringent Regulatory Framework.
8. Can you provide examples of recent developments in the market?
June 2022: Trivitron Healthcare announced plans to launch made-in-India CT-Scan and MRI systems in fiscal year 2022-23. It will be for both Indian and international markets, and it will be used for better diagnosis in remote areas too because of its smart features, cost, and portability.
9. What pricing options are available for accessing the report?
Pricing options include single-user, multi-user, and enterprise licenses priced at USD 4750, USD 5250, and USD 8750 respectively.
10. Is the market size provided in terms of value or volume?
The market size is provided in terms of value, measured in Million.
11. Are there any specific market keywords associated with the report?
Yes, the market keyword associated with the report is "Computed Tomography Market," which aids in identifying and referencing the specific market segment covered.
12. How do I determine which pricing option suits my needs best?
The pricing options vary based on user requirements and access needs. Individual users may opt for single-user licenses, while businesses requiring broader access may choose multi-user or enterprise licenses for cost-effective access to the report.
13. Are there any additional resources or data provided in the Computed Tomography Market report?
While the report offers comprehensive insights, it's advisable to review the specific contents or supplementary materials provided to ascertain if additional resources or data are available.
14. How can I stay updated on further developments or reports in the Computed Tomography Market?
To stay informed about further developments, trends, and reports in the Computed Tomography Market, consider subscribing to industry newsletters, following relevant companies and organizations, or regularly checking reputable industry news sources and publications.
Methodology
Step 1 - Identification of Relevant Samples Size from Population Database


Step 2 - Approaches for Defining Global Market Size (Value, Volume* & Price*)

Note*: In applicable scenarios
Step 3 - Data Sources
Primary Research
- Web Analytics
- Survey Reports
- Research Institute
- Latest Research Reports
- Opinion Leaders
Secondary Research
- Annual Reports
- White Paper
- Latest Press Release
- Industry Association
- Paid Database
- Investor Presentations

Step 4 - Data Triangulation
Involves using different sources of information in order to increase the validity of a study
These sources are likely to be stakeholders in a program - participants, other researchers, program staff, other community members, and so on.
Then we put all data in single framework & apply various statistical tools to find out the dynamic on the market.
During the analysis stage, feedback from the stakeholder groups would be compared to determine areas of agreement as well as areas of divergence
