

Key Insights
The global confectionery market, valued at $83.5 billion in 2025, is projected to achieve a Compound Annual Growth Rate (CAGR) of 1.5%. This growth is propelled by rising disposable incomes, evolving lifestyle preferences for convenient snacks, and continuous product innovation, including healthier options with reduced sugar and unique flavors. The expansion of online retail channels and strategic industry collaborations further enhance market reach and competition. Key challenges include growing health consciousness and the demand for sugar-free alternatives, underscoring the need for innovative product development. The market is segmented by product type, with chocolate holding the largest share, followed by gummies, hard candies, and caramels. Distribution is diverse, with convenience stores, online retail, and supermarkets being primary channels. Regionally, North America and Europe lead in market share, while the Asia-Pacific region is poised for significant growth due to population increases and rising purchasing power.
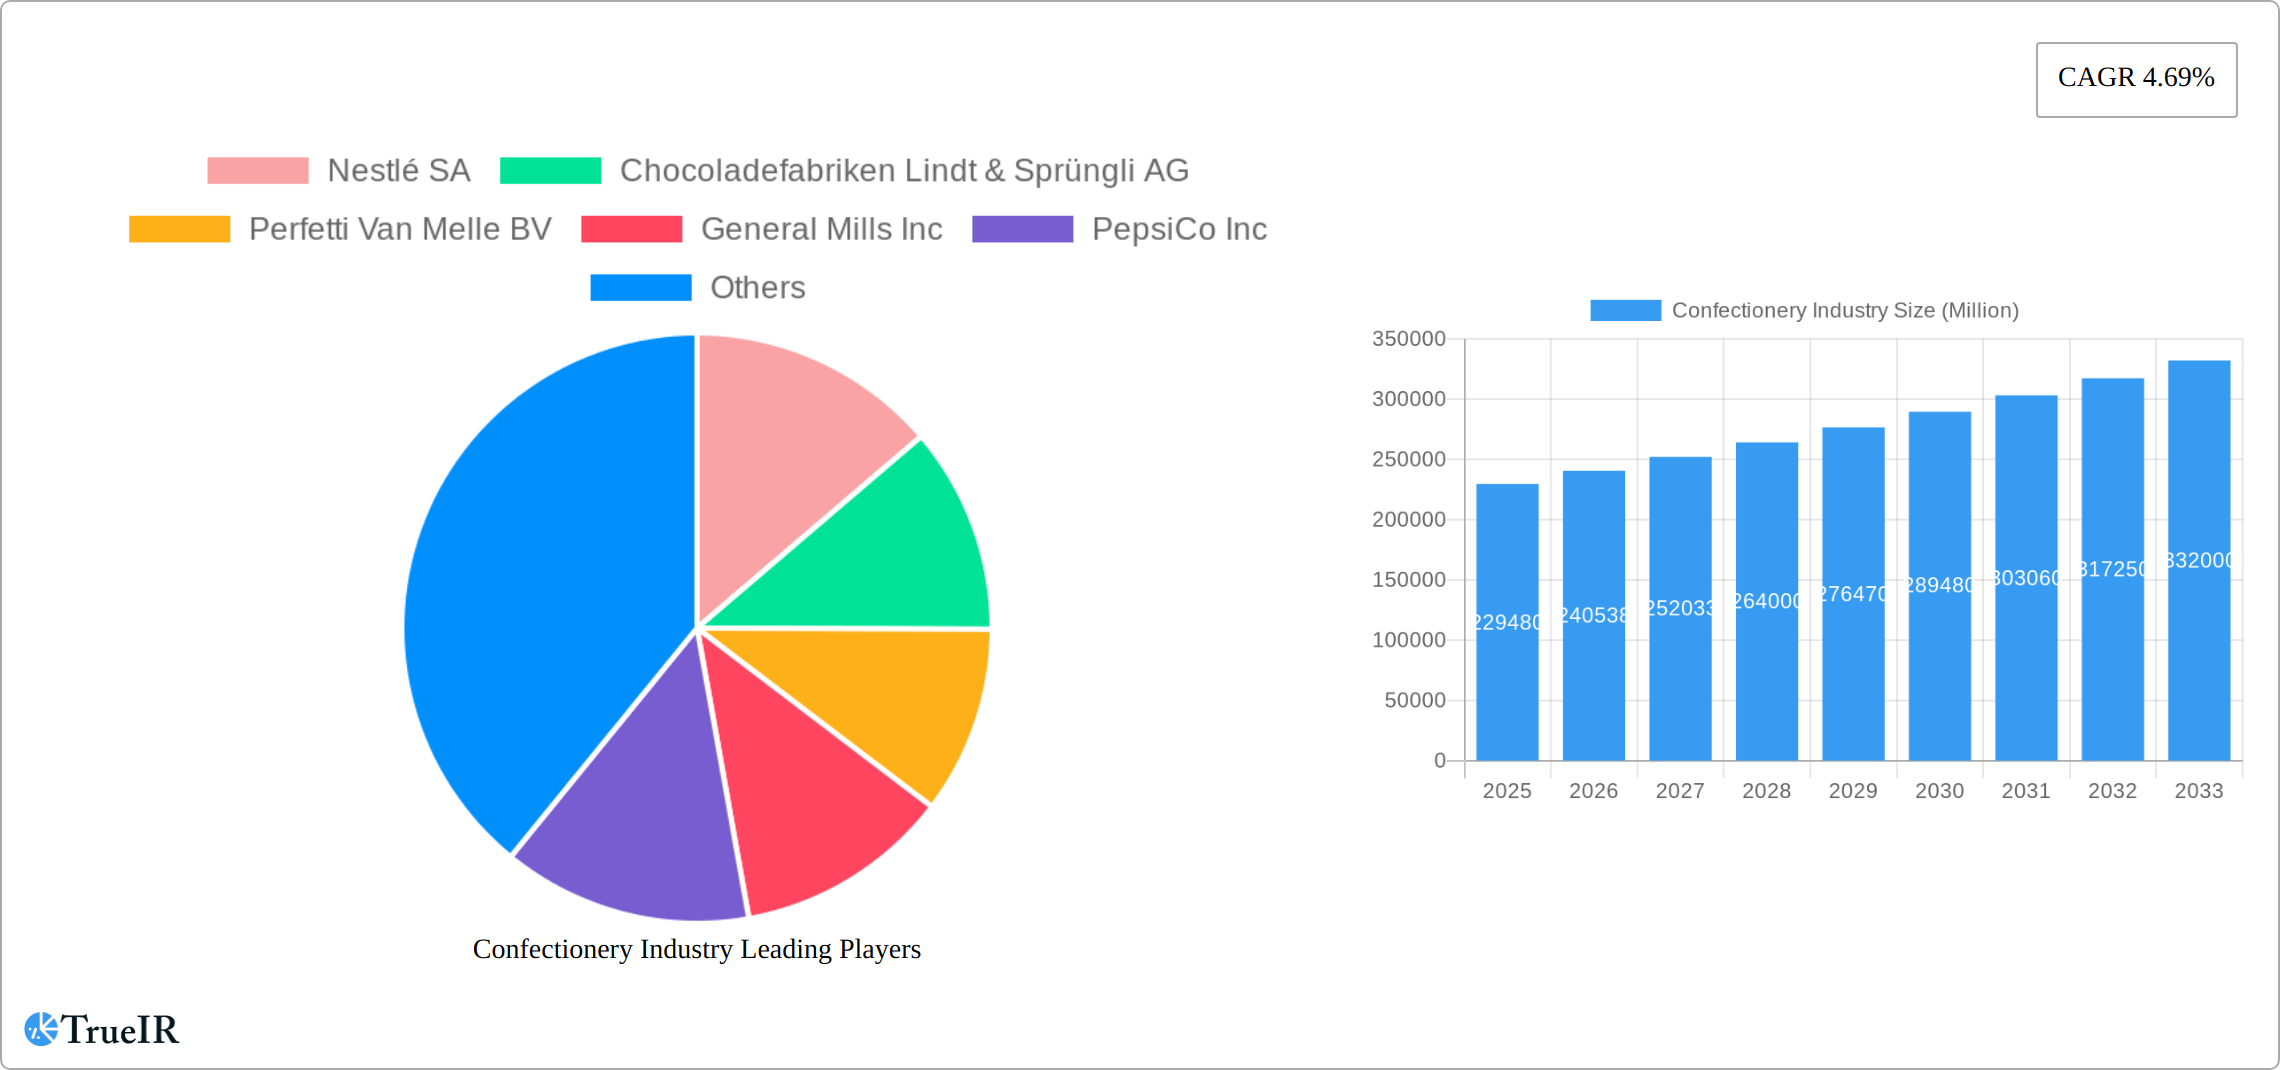
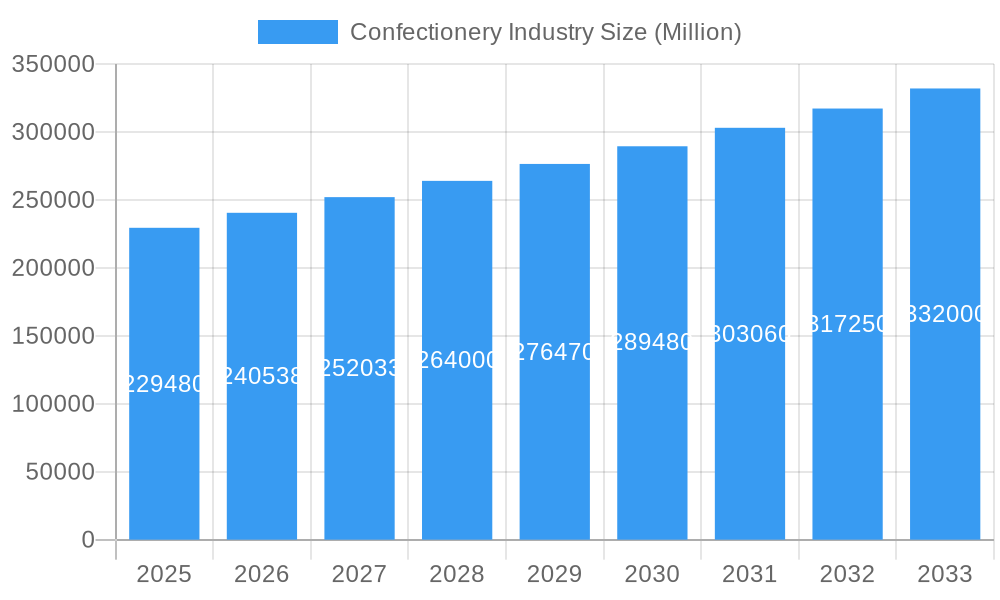
Confectionery Industry Market Size (In Billion)
The forecast period (2025-2033) indicates sustained market expansion driven by product diversification, strategic marketing, and wider distribution. While health considerations persist, the industry's adaptability in offering healthier alternatives ensures continued growth. E-commerce presents substantial opportunities for market penetration and efficient logistics. Developing economies are expected to spearhead regional growth. Success in this dynamic market hinges on innovation, effective marketing, and a deep understanding of consumer trends. Agile strategies focused on product development and market penetration will be critical for navigating market complexities and capitalizing on emerging opportunities.
Confectionery Industry Company Market Share
Confectionery Industry Market Report: 2019-2033
This comprehensive report provides a detailed analysis of the global confectionery industry, encompassing market size, segmentation, competitive landscape, and future growth projections. The study period covers 2019-2033, with 2025 as the base and estimated year. The report utilizes data from the historical period (2019-2024) and forecasts the market's trajectory from 2025 to 2033. Key players like Nestlé SA, Lindt & Sprüngli, and Ferrero are analyzed, alongside crucial market segments and distribution channels. Discover invaluable insights into market trends, challenges, and opportunities for success in this dynamic sector. This report is crucial for confectionery businesses, investors, and anyone seeking to understand the complexities of this multi-billion dollar industry.
Confectionery Industry Market Structure & Competitive Landscape
The global confectionery market, valued at $xx Million in 2024, is characterized by a moderately concentrated structure. Top players, including Nestlé SA, Mars Incorporated, Ferrero International SA, and Mondelez International Inc., command a significant market share, driving competition through innovation and strategic acquisitions. The Herfindahl-Hirschman Index (HHI) for the market is estimated at xx, indicating a moderately consolidated landscape.
- Market Concentration: Top 5 players hold approximately xx% market share.
- Innovation Drivers: Healthier product offerings, premiumization, and sustainable packaging are key innovation drivers.
- Regulatory Impacts: Regulations concerning sugar content, labeling, and ingredient sourcing influence product development and market access.
- Product Substitutes: The rise of healthy snacks and alternative sweeteners presents a challenge to traditional confectionery products.
- End-User Segmentation: The market caters to various demographics, with significant segments including children, young adults, and adults seeking indulgence.
- M&A Trends: The past five years have witnessed xx major mergers and acquisitions, totaling an estimated $xx Million in transaction value, reflecting consolidation and expansion strategies within the industry. This activity is expected to continue, driven by the pursuit of scale and diversification.
Confectionery Industry Market Trends & Opportunities
The global confectionery market exhibits a strong growth trajectory, with a projected Compound Annual Growth Rate (CAGR) of xx% from 2025 to 2033, reaching an estimated value of $xx Million by 2033. This growth is driven by several key factors:
- Market Size Growth: Rising disposable incomes, particularly in emerging markets, are fueling demand for confectionery products.
- Technological Shifts: Automation in manufacturing processes and advanced packaging solutions enhance efficiency and product appeal.
- Consumer Preferences: Growing demand for premium, organic, and functional confectionery products is transforming the market landscape. This includes the rise of vegan and sugar-free options.
- Competitive Dynamics: Intense competition necessitates continuous innovation and strategic brand management to maintain market share. The rise of direct-to-consumer brands is also a significant factor.
- Market Penetration: The market penetration rate in emerging economies remains relatively low, presenting significant growth potential. These markets present opportunities for strategic expansion and localized product offerings.
Dominant Markets & Segments in Confectionery Industry
The global confectionery market is significantly shaped by regional dynamics and segment preferences. Currently, the North American region stands as the dominant force, closely followed by established markets in Europe and the rapidly expanding Asia-Pacific. Within these broad regions, key economies such as the United States, Germany, and Japan consistently exhibit high consumption volumes, underscoring their importance to global confectionery trends.
Dominant Segments:
- Distribution Channel: The traditional strength of supermarkets and hypermarkets continues to secure them the largest share of the distribution channel. However, the landscape is evolving. Convenience stores remain vital for impulse purchases, while online retail stores are experiencing explosive growth. This surge in e-commerce is driven by an expanding digital infrastructure and a growing consumer preference for the convenience, variety, and personalized offers available online.
- Confections: Within the product categories, chocolate firmly maintains its position as the dominant segment, commanding the most substantial market share. Following closely are other popular confectionery items, including a diverse range of gum, candies, and other sweet treats. Innovations in flavor, format, and functional ingredients are continuously shaping consumer choices within these categories.
Key Growth Drivers:
- Developed Markets: Sustained market dominance in developed regions is often attributed to deep-rooted brand loyalty, a testament to effective marketing and product quality over time. Furthermore, robust and well-established distribution networks ensure widespread product availability and consumer access.
- Emerging Markets: The burgeoning potential of emerging economies is a critical growth engine. Factors such as rising disposable incomes, accelerating urbanization, and the associated changing lifestyles are significantly fueling the demand for a broader range of confectionery products. Consumers in these regions are increasingly seeking both everyday treats and premium indulgence options.
- Infrastructure Development: Continuous improvements in retail infrastructure, encompassing modern store formats and enhanced supply chain management, are crucial. Equally important is the development of efficient cold-chain logistics, which is essential for the distribution of temperature-sensitive confectionery products, thereby facilitating broader market access and reducing spoilage.
Confectionery Industry Product Analysis
The confectionery industry exhibits significant innovation in product development, with a focus on health and wellness. New product launches feature reduced sugar, increased protein and fiber, natural ingredients, and sustainable packaging. These innovations address consumer health concerns and align with evolving preferences for healthier snacks. Furthermore, premiumization is a growing trend, with confectionery companies offering high-quality, indulgent products at a higher price point. This caters to consumers willing to pay more for enhanced taste and experience. Competition in this space is fierce, with companies constantly seeking ways to differentiate themselves through unique product attributes and compelling brand stories.
Key Drivers, Barriers & Challenges in Confectionery Industry
Key Drivers:
- Rising Disposable Incomes: Increased purchasing power, particularly in developing economies, fuels demand for confectionery products.
- Changing Consumer Preferences: Demand for healthier, premium, and convenient confectionery options drives innovation.
- Technological Advancements: Automation and new production methods enhance efficiency and product quality.
Challenges and Restraints:
- Health Concerns: Growing awareness of the health risks associated with high sugar consumption impacts consumer choices. This leads to a shift towards healthier alternatives.
- Regulatory Scrutiny: Government regulations regarding sugar content, labeling, and ingredients pose challenges for manufacturers.
- Supply Chain Disruptions: Global supply chain volatility and rising raw material costs can significantly impact profitability. The impact of this on profit margins is estimated to be approximately xx%.
Growth Drivers in the Confectionery Industry Market
The confectionery market is experiencing robust growth propelled by a confluence of powerful drivers. A primary catalyst is the rising disposable incomes observed in emerging economies, empowering consumers to allocate more spending towards discretionary treats. Simultaneously, evolving consumer preferences are steering demand towards healthier, premium, and more convenient confectionery options, prompting manufacturers to innovate with reduced sugar content, natural ingredients, and single-serve formats. Technological advancements in production and packaging are also playing a pivotal role, enabling greater efficiency, novel product presentations, and enhanced shelf life. Furthermore, strategic and impactful marketing and branding initiatives continue to be instrumental in capturing consumer attention and fostering brand affinity. While these drivers propel the market forward, it's important to note that government regulations, though sometimes presenting challenges, also act as catalysts for innovation, encouraging the development of compliant and consumer-focused products.
Challenges Impacting Confectionery Industry Growth
Despite the promising growth trajectory, the confectionery industry navigates a landscape fraught with significant challenges. A pervasive trend is the increasing health consciousness among consumers, leading to a noticeable reduction in the consumption of traditional high-sugar products and a growing demand for healthier alternatives. This shift necessitates a pivot in product development and marketing strategies. Moreover, the industry faces persistent pressure from rising raw material costs, including cocoa, sugar, and dairy, which directly impacts profitability and requires diligent cost management. Stricter regulations and labeling requirements, particularly concerning nutritional information and ingredient transparency, add another layer of complexity, demanding compliance and potentially increasing operational costs. Finally, the market is characterized by intense competition, not only from established global players with strong brand recognition but also from agile emerging brands that often cater to niche markets or innovative product concepts. Successfully navigating these challenges requires a strategic and proactive approach focused on continuous innovation, efficient cost management, and compelling brand building to ensure sustained and profitable growth.
Key Players Shaping the Confectionery Industry Market
- Nestlé SA
- Chocoladefabriken Lindt & Sprüngli AG
- Perfetti Van Melle BV
- General Mills Inc
- PepsiCo Inc
- August Storck KG
- Ferrero International SA
- Mars Incorporated
- Yıldız Holding AŞ
- Lotte Corporation
- HARIBO Holding GmbH & Co KG
- Mondelēz International Inc
- Meiji Holdings Company Ltd
- The Hershey Company
- Kellogg Company
Significant Confectionery Industry Milestones
- July 2023: HARIBO® opened its first North American manufacturing facility, significantly increasing its production capacity to meet growing US demand.
- July 2023: Ferrara Candy Co. (Ferrero's sister company) acquired Dori Alimentos, expanding its presence in the Brazilian confectionery market.
- August 2023: Ferrero North America showcased new Kinder Chocolate products and seasonal offerings at the Sweets & Snacks Expo, signaling continued innovation and product expansion in the US market.
Future Outlook for Confectionery Industry Market
The future outlook for the confectionery market remains overwhelmingly positive, with projections indicating continued and substantial growth on a global scale. This expansion will be primarily fueled by the sustained increase in disposable incomes across various regions, particularly in developing economies, which will unlock greater purchasing power for confectionery products. A significant trend shaping the future will be the ongoing evolution of consumer preferences, with a pronounced shift towards products that are perceived as healthier, premium, and ethically sourced. Manufacturers who can successfully cater to these evolving demands with innovative formulations, natural ingredients, and transparent sourcing will be best positioned for success. Furthermore, continued technological advancements in production and packaging will enable greater product differentiation, improved sustainability, and more efficient delivery systems. The strategic focus on innovation, sustainability, and robust brand building will be paramount for navigating this dynamic and increasingly competitive landscape. The untapped potential of emerging markets, coupled with the ever-growing influence of e-commerce, presents significant opportunities for market expansion, enhanced consumer reach, and deeper market penetration for forward-thinking confectionery companies.
Confectionery Industry Segmentation
-
1. Confections
-
1.1. Chocolate
-
1.1.1. By Confectionery Variant
- 1.1.1.1. Dark Chocolate
- 1.1.1.2. Milk and White Chocolate
-
1.1.1. By Confectionery Variant
-
1.2. Gums
- 1.2.1. Bubble Gum
-
1.2.2. Chewing Gum
-
1.2.2.1. By Sugar Content
- 1.2.2.1.1. Sugar Chewing Gum
- 1.2.2.1.2. Sugar-free Chewing Gum
-
1.2.2.1. By Sugar Content
-
1.3. Snack Bar
- 1.3.1. Cereal Bar
- 1.3.2. Fruit & Nut Bar
- 1.3.3. Protein Bar
-
1.4. Sugar Confectionery
- 1.4.1. Hard Candy
- 1.4.2. Lollipops
- 1.4.3. Mints
- 1.4.4. Pastilles, Gummies, and Jellies
- 1.4.5. Toffees and Nougats
- 1.4.6. Others
-
1.1. Chocolate
-
2. Distribution Channel
- 2.1. Convenience Store
- 2.2. Online Retail Store
- 2.3. Supermarket/Hypermarket
- 2.4. Others
Confectionery Industry Segmentation By Geography
-
1. North America
- 1.1. United States
- 1.2. Canada
- 1.3. Mexico
-
2. South America
- 2.1. Brazil
- 2.2. Argentina
- 2.3. Rest of South America
-
3. Europe
- 3.1. United Kingdom
- 3.2. Germany
- 3.3. France
- 3.4. Italy
- 3.5. Spain
- 3.6. Russia
- 3.7. Benelux
- 3.8. Nordics
- 3.9. Rest of Europe
-
4. Middle East & Africa
- 4.1. Turkey
- 4.2. Israel
- 4.3. GCC
- 4.4. North Africa
- 4.5. South Africa
- 4.6. Rest of Middle East & Africa
-
5. Asia Pacific
- 5.1. China
- 5.2. India
- 5.3. Japan
- 5.4. South Korea
- 5.5. ASEAN
- 5.6. Oceania
- 5.7. Rest of Asia Pacific
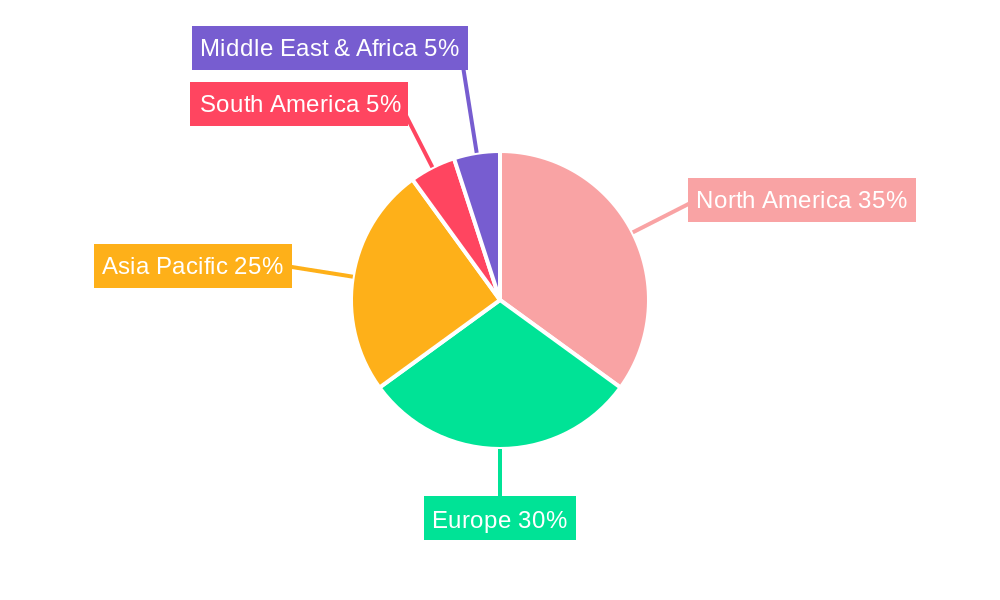
Confectionery Industry Regional Market Share
Geographic Coverage of Confectionery Industry
Confectionery Industry REPORT HIGHLIGHTS
| Aspects | Details |
|---|---|
| Study Period | 2020-2034 |
| Base Year | 2025 |
| Estimated Year | 2026 |
| Forecast Period | 2026-2034 |
| Historical Period | 2020-2025 |
| Growth Rate | CAGR of 1.5% from 2020-2034 |
| Segmentation |
|
Table of Contents
- 1. Introduction
- 1.1. Research Scope
- 1.2. Market Segmentation
- 1.3. Research Objective
- 1.4. Definitions and Assumptions
- 2. Executive Summary
- 2.1. Market Snapshot
- 3. Market Dynamics
- 3.1. Market Drivers
- 3.2. Market Restrains
- 3.3. Market Trends
- 3.4. Market Opportunities
- 4. Market Factor Analysis
- 4.1. Porters Five Forces
- 4.1.1. Bargaining Power of Suppliers
- 4.1.2. Bargaining Power of Buyers
- 4.1.3. Threat of New Entrants
- 4.1.4. Threat of Substitutes
- 4.1.5. Competitive Rivalry
- 4.2. PESTEL analysis
- 4.3. BCG Analysis
- 4.3.1. Stars (High Growth, High Market Share)
- 4.3.2. Cash Cows (Low Growth, High Market Share)
- 4.3.3. Question Mark (High Growth, Low Market Share)
- 4.3.4. Dogs (Low Growth, Low Market Share)
- 4.4. Ansoff Matrix Analysis
- 4.5. Supply Chain Analysis
- 4.6. Regulatory Landscape
- 4.7. Current Market Potential and Opportunity Assessment (TAM–SAM–SOM Framework)
- 4.8. TIR Analyst Note
- 4.1. Porters Five Forces
- 5. Market Analysis, Insights and Forecast 2021-2033
- 5.1. Market Analysis, Insights and Forecast - by Confections
- 5.1.1. Chocolate
- 5.1.1.1. By Confectionery Variant
- 5.1.1.1.1. Dark Chocolate
- 5.1.1.1.2. Milk and White Chocolate
- 5.1.1.1. By Confectionery Variant
- 5.1.2. Gums
- 5.1.2.1. Bubble Gum
- 5.1.2.2. Chewing Gum
- 5.1.2.2.1. By Sugar Content
- 5.1.2.2.1.1. Sugar Chewing Gum
- 5.1.2.2.1.2. Sugar-free Chewing Gum
- 5.1.2.2.1. By Sugar Content
- 5.1.3. Snack Bar
- 5.1.3.1. Cereal Bar
- 5.1.3.2. Fruit & Nut Bar
- 5.1.3.3. Protein Bar
- 5.1.4. Sugar Confectionery
- 5.1.4.1. Hard Candy
- 5.1.4.2. Lollipops
- 5.1.4.3. Mints
- 5.1.4.4. Pastilles, Gummies, and Jellies
- 5.1.4.5. Toffees and Nougats
- 5.1.4.6. Others
- 5.1.1. Chocolate
- 5.2. Market Analysis, Insights and Forecast - by Distribution Channel
- 5.2.1. Convenience Store
- 5.2.2. Online Retail Store
- 5.2.3. Supermarket/Hypermarket
- 5.2.4. Others
- 5.3. Market Analysis, Insights and Forecast - by Region
- 5.3.1. North America
- 5.3.2. South America
- 5.3.3. Europe
- 5.3.4. Middle East & Africa
- 5.3.5. Asia Pacific
- 5.1. Market Analysis, Insights and Forecast - by Confections
- 6. Global Confectionery Industry Analysis, Insights and Forecast, 2021-2033
- 6.1. Market Analysis, Insights and Forecast - by Confections
- 6.1.1. Chocolate
- 6.1.1.1. By Confectionery Variant
- 6.1.1.1.1. Dark Chocolate
- 6.1.1.1.2. Milk and White Chocolate
- 6.1.1.1. By Confectionery Variant
- 6.1.2. Gums
- 6.1.2.1. Bubble Gum
- 6.1.2.2. Chewing Gum
- 6.1.2.2.1. By Sugar Content
- 6.1.2.2.1.1. Sugar Chewing Gum
- 6.1.2.2.1.2. Sugar-free Chewing Gum
- 6.1.2.2.1. By Sugar Content
- 6.1.3. Snack Bar
- 6.1.3.1. Cereal Bar
- 6.1.3.2. Fruit & Nut Bar
- 6.1.3.3. Protein Bar
- 6.1.4. Sugar Confectionery
- 6.1.4.1. Hard Candy
- 6.1.4.2. Lollipops
- 6.1.4.3. Mints
- 6.1.4.4. Pastilles, Gummies, and Jellies
- 6.1.4.5. Toffees and Nougats
- 6.1.4.6. Others
- 6.1.1. Chocolate
- 6.2. Market Analysis, Insights and Forecast - by Distribution Channel
- 6.2.1. Convenience Store
- 6.2.2. Online Retail Store
- 6.2.3. Supermarket/Hypermarket
- 6.2.4. Others
- 6.1. Market Analysis, Insights and Forecast - by Confections
- 7. North America Confectionery Industry Analysis, Insights and Forecast, 2020-2032
- 7.1. Market Analysis, Insights and Forecast - by Confections
- 7.1.1. Chocolate
- 7.1.1.1. By Confectionery Variant
- 7.1.1.1.1. Dark Chocolate
- 7.1.1.1.2. Milk and White Chocolate
- 7.1.1.1. By Confectionery Variant
- 7.1.2. Gums
- 7.1.2.1. Bubble Gum
- 7.1.2.2. Chewing Gum
- 7.1.2.2.1. By Sugar Content
- 7.1.2.2.1.1. Sugar Chewing Gum
- 7.1.2.2.1.2. Sugar-free Chewing Gum
- 7.1.2.2.1. By Sugar Content
- 7.1.3. Snack Bar
- 7.1.3.1. Cereal Bar
- 7.1.3.2. Fruit & Nut Bar
- 7.1.3.3. Protein Bar
- 7.1.4. Sugar Confectionery
- 7.1.4.1. Hard Candy
- 7.1.4.2. Lollipops
- 7.1.4.3. Mints
- 7.1.4.4. Pastilles, Gummies, and Jellies
- 7.1.4.5. Toffees and Nougats
- 7.1.4.6. Others
- 7.1.1. Chocolate
- 7.2. Market Analysis, Insights and Forecast - by Distribution Channel
- 7.2.1. Convenience Store
- 7.2.2. Online Retail Store
- 7.2.3. Supermarket/Hypermarket
- 7.2.4. Others
- 7.1. Market Analysis, Insights and Forecast - by Confections
- 8. South America Confectionery Industry Analysis, Insights and Forecast, 2020-2032
- 8.1. Market Analysis, Insights and Forecast - by Confections
- 8.1.1. Chocolate
- 8.1.1.1. By Confectionery Variant
- 8.1.1.1.1. Dark Chocolate
- 8.1.1.1.2. Milk and White Chocolate
- 8.1.1.1. By Confectionery Variant
- 8.1.2. Gums
- 8.1.2.1. Bubble Gum
- 8.1.2.2. Chewing Gum
- 8.1.2.2.1. By Sugar Content
- 8.1.2.2.1.1. Sugar Chewing Gum
- 8.1.2.2.1.2. Sugar-free Chewing Gum
- 8.1.2.2.1. By Sugar Content
- 8.1.3. Snack Bar
- 8.1.3.1. Cereal Bar
- 8.1.3.2. Fruit & Nut Bar
- 8.1.3.3. Protein Bar
- 8.1.4. Sugar Confectionery
- 8.1.4.1. Hard Candy
- 8.1.4.2. Lollipops
- 8.1.4.3. Mints
- 8.1.4.4. Pastilles, Gummies, and Jellies
- 8.1.4.5. Toffees and Nougats
- 8.1.4.6. Others
- 8.1.1. Chocolate
- 8.2. Market Analysis, Insights and Forecast - by Distribution Channel
- 8.2.1. Convenience Store
- 8.2.2. Online Retail Store
- 8.2.3. Supermarket/Hypermarket
- 8.2.4. Others
- 8.1. Market Analysis, Insights and Forecast - by Confections
- 9. Europe Confectionery Industry Analysis, Insights and Forecast, 2020-2032
- 9.1. Market Analysis, Insights and Forecast - by Confections
- 9.1.1. Chocolate
- 9.1.1.1. By Confectionery Variant
- 9.1.1.1.1. Dark Chocolate
- 9.1.1.1.2. Milk and White Chocolate
- 9.1.1.1. By Confectionery Variant
- 9.1.2. Gums
- 9.1.2.1. Bubble Gum
- 9.1.2.2. Chewing Gum
- 9.1.2.2.1. By Sugar Content
- 9.1.2.2.1.1. Sugar Chewing Gum
- 9.1.2.2.1.2. Sugar-free Chewing Gum
- 9.1.2.2.1. By Sugar Content
- 9.1.3. Snack Bar
- 9.1.3.1. Cereal Bar
- 9.1.3.2. Fruit & Nut Bar
- 9.1.3.3. Protein Bar
- 9.1.4. Sugar Confectionery
- 9.1.4.1. Hard Candy
- 9.1.4.2. Lollipops
- 9.1.4.3. Mints
- 9.1.4.4. Pastilles, Gummies, and Jellies
- 9.1.4.5. Toffees and Nougats
- 9.1.4.6. Others
- 9.1.1. Chocolate
- 9.2. Market Analysis, Insights and Forecast - by Distribution Channel
- 9.2.1. Convenience Store
- 9.2.2. Online Retail Store
- 9.2.3. Supermarket/Hypermarket
- 9.2.4. Others
- 9.1. Market Analysis, Insights and Forecast - by Confections
- 10. Middle East & Africa Confectionery Industry Analysis, Insights and Forecast, 2020-2032
- 10.1. Market Analysis, Insights and Forecast - by Confections
- 10.1.1. Chocolate
- 10.1.1.1. By Confectionery Variant
- 10.1.1.1.1. Dark Chocolate
- 10.1.1.1.2. Milk and White Chocolate
- 10.1.1.1. By Confectionery Variant
- 10.1.2. Gums
- 10.1.2.1. Bubble Gum
- 10.1.2.2. Chewing Gum
- 10.1.2.2.1. By Sugar Content
- 10.1.2.2.1.1. Sugar Chewing Gum
- 10.1.2.2.1.2. Sugar-free Chewing Gum
- 10.1.2.2.1. By Sugar Content
- 10.1.3. Snack Bar
- 10.1.3.1. Cereal Bar
- 10.1.3.2. Fruit & Nut Bar
- 10.1.3.3. Protein Bar
- 10.1.4. Sugar Confectionery
- 10.1.4.1. Hard Candy
- 10.1.4.2. Lollipops
- 10.1.4.3. Mints
- 10.1.4.4. Pastilles, Gummies, and Jellies
- 10.1.4.5. Toffees and Nougats
- 10.1.4.6. Others
- 10.1.1. Chocolate
- 10.2. Market Analysis, Insights and Forecast - by Distribution Channel
- 10.2.1. Convenience Store
- 10.2.2. Online Retail Store
- 10.2.3. Supermarket/Hypermarket
- 10.2.4. Others
- 10.1. Market Analysis, Insights and Forecast - by Confections
- 11. Asia Pacific Confectionery Industry Analysis, Insights and Forecast, 2020-2032
- 11.1. Market Analysis, Insights and Forecast - by Confections
- 11.1.1. Chocolate
- 11.1.1.1. By Confectionery Variant
- 11.1.1.1.1. Dark Chocolate
- 11.1.1.1.2. Milk and White Chocolate
- 11.1.1.1. By Confectionery Variant
- 11.1.2. Gums
- 11.1.2.1. Bubble Gum
- 11.1.2.2. Chewing Gum
- 11.1.2.2.1. By Sugar Content
- 11.1.2.2.1.1. Sugar Chewing Gum
- 11.1.2.2.1.2. Sugar-free Chewing Gum
- 11.1.2.2.1. By Sugar Content
- 11.1.3. Snack Bar
- 11.1.3.1. Cereal Bar
- 11.1.3.2. Fruit & Nut Bar
- 11.1.3.3. Protein Bar
- 11.1.4. Sugar Confectionery
- 11.1.4.1. Hard Candy
- 11.1.4.2. Lollipops
- 11.1.4.3. Mints
- 11.1.4.4. Pastilles, Gummies, and Jellies
- 11.1.4.5. Toffees and Nougats
- 11.1.4.6. Others
- 11.1.1. Chocolate
- 11.2. Market Analysis, Insights and Forecast - by Distribution Channel
- 11.2.1. Convenience Store
- 11.2.2. Online Retail Store
- 11.2.3. Supermarket/Hypermarket
- 11.2.4. Others
- 11.1. Market Analysis, Insights and Forecast - by Confections
- 12. Competitive Analysis
- 12.1. Company Profiles
- 12.1.1 Nestlé SA
- 12.1.1.1. Company Overview
- 12.1.1.2. Products
- 12.1.1.3. Company Financials
- 12.1.1.4. SWOT Analysis
- 12.1.2 Chocoladefabriken Lindt & Sprüngli AG
- 12.1.2.1. Company Overview
- 12.1.2.2. Products
- 12.1.2.3. Company Financials
- 12.1.2.4. SWOT Analysis
- 12.1.3 Perfetti Van Melle BV
- 12.1.3.1. Company Overview
- 12.1.3.2. Products
- 12.1.3.3. Company Financials
- 12.1.3.4. SWOT Analysis
- 12.1.4 General Mills Inc
- 12.1.4.1. Company Overview
- 12.1.4.2. Products
- 12.1.4.3. Company Financials
- 12.1.4.4. SWOT Analysis
- 12.1.5 PepsiCo Inc
- 12.1.5.1. Company Overview
- 12.1.5.2. Products
- 12.1.5.3. Company Financials
- 12.1.5.4. SWOT Analysis
- 12.1.6 August Storck KG
- 12.1.6.1. Company Overview
- 12.1.6.2. Products
- 12.1.6.3. Company Financials
- 12.1.6.4. SWOT Analysis
- 12.1.7 Ferrero International SA
- 12.1.7.1. Company Overview
- 12.1.7.2. Products
- 12.1.7.3. Company Financials
- 12.1.7.4. SWOT Analysis
- 12.1.8 Mars Incorporated
- 12.1.8.1. Company Overview
- 12.1.8.2. Products
- 12.1.8.3. Company Financials
- 12.1.8.4. SWOT Analysis
- 12.1.9 Yıldız Holding A
- 12.1.9.1. Company Overview
- 12.1.9.2. Products
- 12.1.9.3. Company Financials
- 12.1.9.4. SWOT Analysis
- 12.1.10 Lotte Corporation
- 12.1.10.1. Company Overview
- 12.1.10.2. Products
- 12.1.10.3. Company Financials
- 12.1.10.4. SWOT Analysis
- 12.1.11 HARIBO Holding GmbH & Co KG
- 12.1.11.1. Company Overview
- 12.1.11.2. Products
- 12.1.11.3. Company Financials
- 12.1.11.4. SWOT Analysis
- 12.1.12 Mondelēz International Inc
- 12.1.12.1. Company Overview
- 12.1.12.2. Products
- 12.1.12.3. Company Financials
- 12.1.12.4. SWOT Analysis
- 12.1.13 Meiji Holdings Company Ltd
- 12.1.13.1. Company Overview
- 12.1.13.2. Products
- 12.1.13.3. Company Financials
- 12.1.13.4. SWOT Analysis
- 12.1.14 The Hershey Company
- 12.1.14.1. Company Overview
- 12.1.14.2. Products
- 12.1.14.3. Company Financials
- 12.1.14.4. SWOT Analysis
- 12.1.15 Kellogg Company
- 12.1.15.1. Company Overview
- 12.1.15.2. Products
- 12.1.15.3. Company Financials
- 12.1.15.4. SWOT Analysis
- 12.1.1 Nestlé SA
- 12.2. Market Entropy
- 12.2.1 Company's Key Areas Served
- 12.2.2 Recent Developments
- 12.3. Company Market Share Analysis 2025
- 12.3.1 Top 5 Companies Market Share Analysis
- 12.3.2 Top 3 Companies Market Share Analysis
- 12.4. List of Potential Customers
- 13. Research Methodology
List of Figures
- Figure 1: Global Confectionery Industry Revenue Breakdown (billion, %) by Region 2025 & 2033
- Figure 2: Global Confectionery Industry Volume Breakdown (K Tons, %) by Region 2025 & 2033
- Figure 3: North America Confectionery Industry Revenue (billion), by Confections 2025 & 2033
- Figure 4: North America Confectionery Industry Volume (K Tons), by Confections 2025 & 2033
- Figure 5: North America Confectionery Industry Revenue Share (%), by Confections 2025 & 2033
- Figure 6: North America Confectionery Industry Volume Share (%), by Confections 2025 & 2033
- Figure 7: North America Confectionery Industry Revenue (billion), by Distribution Channel 2025 & 2033
- Figure 8: North America Confectionery Industry Volume (K Tons), by Distribution Channel 2025 & 2033
- Figure 9: North America Confectionery Industry Revenue Share (%), by Distribution Channel 2025 & 2033
- Figure 10: North America Confectionery Industry Volume Share (%), by Distribution Channel 2025 & 2033
- Figure 11: North America Confectionery Industry Revenue (billion), by Country 2025 & 2033
- Figure 12: North America Confectionery Industry Volume (K Tons), by Country 2025 & 2033
- Figure 13: North America Confectionery Industry Revenue Share (%), by Country 2025 & 2033
- Figure 14: North America Confectionery Industry Volume Share (%), by Country 2025 & 2033
- Figure 15: South America Confectionery Industry Revenue (billion), by Confections 2025 & 2033
- Figure 16: South America Confectionery Industry Volume (K Tons), by Confections 2025 & 2033
- Figure 17: South America Confectionery Industry Revenue Share (%), by Confections 2025 & 2033
- Figure 18: South America Confectionery Industry Volume Share (%), by Confections 2025 & 2033
- Figure 19: South America Confectionery Industry Revenue (billion), by Distribution Channel 2025 & 2033
- Figure 20: South America Confectionery Industry Volume (K Tons), by Distribution Channel 2025 & 2033
- Figure 21: South America Confectionery Industry Revenue Share (%), by Distribution Channel 2025 & 2033
- Figure 22: South America Confectionery Industry Volume Share (%), by Distribution Channel 2025 & 2033
- Figure 23: South America Confectionery Industry Revenue (billion), by Country 2025 & 2033
- Figure 24: South America Confectionery Industry Volume (K Tons), by Country 2025 & 2033
- Figure 25: South America Confectionery Industry Revenue Share (%), by Country 2025 & 2033
- Figure 26: South America Confectionery Industry Volume Share (%), by Country 2025 & 2033
- Figure 27: Europe Confectionery Industry Revenue (billion), by Confections 2025 & 2033
- Figure 28: Europe Confectionery Industry Volume (K Tons), by Confections 2025 & 2033
- Figure 29: Europe Confectionery Industry Revenue Share (%), by Confections 2025 & 2033
- Figure 30: Europe Confectionery Industry Volume Share (%), by Confections 2025 & 2033
- Figure 31: Europe Confectionery Industry Revenue (billion), by Distribution Channel 2025 & 2033
- Figure 32: Europe Confectionery Industry Volume (K Tons), by Distribution Channel 2025 & 2033
- Figure 33: Europe Confectionery Industry Revenue Share (%), by Distribution Channel 2025 & 2033
- Figure 34: Europe Confectionery Industry Volume Share (%), by Distribution Channel 2025 & 2033
- Figure 35: Europe Confectionery Industry Revenue (billion), by Country 2025 & 2033
- Figure 36: Europe Confectionery Industry Volume (K Tons), by Country 2025 & 2033
- Figure 37: Europe Confectionery Industry Revenue Share (%), by Country 2025 & 2033
- Figure 38: Europe Confectionery Industry Volume Share (%), by Country 2025 & 2033
- Figure 39: Middle East & Africa Confectionery Industry Revenue (billion), by Confections 2025 & 2033
- Figure 40: Middle East & Africa Confectionery Industry Volume (K Tons), by Confections 2025 & 2033
- Figure 41: Middle East & Africa Confectionery Industry Revenue Share (%), by Confections 2025 & 2033
- Figure 42: Middle East & Africa Confectionery Industry Volume Share (%), by Confections 2025 & 2033
- Figure 43: Middle East & Africa Confectionery Industry Revenue (billion), by Distribution Channel 2025 & 2033
- Figure 44: Middle East & Africa Confectionery Industry Volume (K Tons), by Distribution Channel 2025 & 2033
- Figure 45: Middle East & Africa Confectionery Industry Revenue Share (%), by Distribution Channel 2025 & 2033
- Figure 46: Middle East & Africa Confectionery Industry Volume Share (%), by Distribution Channel 2025 & 2033
- Figure 47: Middle East & Africa Confectionery Industry Revenue (billion), by Country 2025 & 2033
- Figure 48: Middle East & Africa Confectionery Industry Volume (K Tons), by Country 2025 & 2033
- Figure 49: Middle East & Africa Confectionery Industry Revenue Share (%), by Country 2025 & 2033
- Figure 50: Middle East & Africa Confectionery Industry Volume Share (%), by Country 2025 & 2033
- Figure 51: Asia Pacific Confectionery Industry Revenue (billion), by Confections 2025 & 2033
- Figure 52: Asia Pacific Confectionery Industry Volume (K Tons), by Confections 2025 & 2033
- Figure 53: Asia Pacific Confectionery Industry Revenue Share (%), by Confections 2025 & 2033
- Figure 54: Asia Pacific Confectionery Industry Volume Share (%), by Confections 2025 & 2033
- Figure 55: Asia Pacific Confectionery Industry Revenue (billion), by Distribution Channel 2025 & 2033
- Figure 56: Asia Pacific Confectionery Industry Volume (K Tons), by Distribution Channel 2025 & 2033
- Figure 57: Asia Pacific Confectionery Industry Revenue Share (%), by Distribution Channel 2025 & 2033
- Figure 58: Asia Pacific Confectionery Industry Volume Share (%), by Distribution Channel 2025 & 2033
- Figure 59: Asia Pacific Confectionery Industry Revenue (billion), by Country 2025 & 2033
- Figure 60: Asia Pacific Confectionery Industry Volume (K Tons), by Country 2025 & 2033
- Figure 61: Asia Pacific Confectionery Industry Revenue Share (%), by Country 2025 & 2033
- Figure 62: Asia Pacific Confectionery Industry Volume Share (%), by Country 2025 & 2033
List of Tables
- Table 1: Global Confectionery Industry Revenue billion Forecast, by Confections 2020 & 2033
- Table 2: Global Confectionery Industry Volume K Tons Forecast, by Confections 2020 & 2033
- Table 3: Global Confectionery Industry Revenue billion Forecast, by Distribution Channel 2020 & 2033
- Table 4: Global Confectionery Industry Volume K Tons Forecast, by Distribution Channel 2020 & 2033
- Table 5: Global Confectionery Industry Revenue billion Forecast, by Region 2020 & 2033
- Table 6: Global Confectionery Industry Volume K Tons Forecast, by Region 2020 & 2033
- Table 7: Global Confectionery Industry Revenue billion Forecast, by Confections 2020 & 2033
- Table 8: Global Confectionery Industry Volume K Tons Forecast, by Confections 2020 & 2033
- Table 9: Global Confectionery Industry Revenue billion Forecast, by Distribution Channel 2020 & 2033
- Table 10: Global Confectionery Industry Volume K Tons Forecast, by Distribution Channel 2020 & 2033
- Table 11: Global Confectionery Industry Revenue billion Forecast, by Country 2020 & 2033
- Table 12: Global Confectionery Industry Volume K Tons Forecast, by Country 2020 & 2033
- Table 13: United States Confectionery Industry Revenue (billion) Forecast, by Application 2020 & 2033
- Table 14: United States Confectionery Industry Volume (K Tons) Forecast, by Application 2020 & 2033
- Table 15: Canada Confectionery Industry Revenue (billion) Forecast, by Application 2020 & 2033
- Table 16: Canada Confectionery Industry Volume (K Tons) Forecast, by Application 2020 & 2033
- Table 17: Mexico Confectionery Industry Revenue (billion) Forecast, by Application 2020 & 2033
- Table 18: Mexico Confectionery Industry Volume (K Tons) Forecast, by Application 2020 & 2033
- Table 19: Global Confectionery Industry Revenue billion Forecast, by Confections 2020 & 2033
- Table 20: Global Confectionery Industry Volume K Tons Forecast, by Confections 2020 & 2033
- Table 21: Global Confectionery Industry Revenue billion Forecast, by Distribution Channel 2020 & 2033
- Table 22: Global Confectionery Industry Volume K Tons Forecast, by Distribution Channel 2020 & 2033
- Table 23: Global Confectionery Industry Revenue billion Forecast, by Country 2020 & 2033
- Table 24: Global Confectionery Industry Volume K Tons Forecast, by Country 2020 & 2033
- Table 25: Brazil Confectionery Industry Revenue (billion) Forecast, by Application 2020 & 2033
- Table 26: Brazil Confectionery Industry Volume (K Tons) Forecast, by Application 2020 & 2033
- Table 27: Argentina Confectionery Industry Revenue (billion) Forecast, by Application 2020 & 2033
- Table 28: Argentina Confectionery Industry Volume (K Tons) Forecast, by Application 2020 & 2033
- Table 29: Rest of South America Confectionery Industry Revenue (billion) Forecast, by Application 2020 & 2033
- Table 30: Rest of South America Confectionery Industry Volume (K Tons) Forecast, by Application 2020 & 2033
- Table 31: Global Confectionery Industry Revenue billion Forecast, by Confections 2020 & 2033
- Table 32: Global Confectionery Industry Volume K Tons Forecast, by Confections 2020 & 2033
- Table 33: Global Confectionery Industry Revenue billion Forecast, by Distribution Channel 2020 & 2033
- Table 34: Global Confectionery Industry Volume K Tons Forecast, by Distribution Channel 2020 & 2033
- Table 35: Global Confectionery Industry Revenue billion Forecast, by Country 2020 & 2033
- Table 36: Global Confectionery Industry Volume K Tons Forecast, by Country 2020 & 2033
- Table 37: United Kingdom Confectionery Industry Revenue (billion) Forecast, by Application 2020 & 2033
- Table 38: United Kingdom Confectionery Industry Volume (K Tons) Forecast, by Application 2020 & 2033
- Table 39: Germany Confectionery Industry Revenue (billion) Forecast, by Application 2020 & 2033
- Table 40: Germany Confectionery Industry Volume (K Tons) Forecast, by Application 2020 & 2033
- Table 41: France Confectionery Industry Revenue (billion) Forecast, by Application 2020 & 2033
- Table 42: France Confectionery Industry Volume (K Tons) Forecast, by Application 2020 & 2033
- Table 43: Italy Confectionery Industry Revenue (billion) Forecast, by Application 2020 & 2033
- Table 44: Italy Confectionery Industry Volume (K Tons) Forecast, by Application 2020 & 2033
- Table 45: Spain Confectionery Industry Revenue (billion) Forecast, by Application 2020 & 2033
- Table 46: Spain Confectionery Industry Volume (K Tons) Forecast, by Application 2020 & 2033
- Table 47: Russia Confectionery Industry Revenue (billion) Forecast, by Application 2020 & 2033
- Table 48: Russia Confectionery Industry Volume (K Tons) Forecast, by Application 2020 & 2033
- Table 49: Benelux Confectionery Industry Revenue (billion) Forecast, by Application 2020 & 2033
- Table 50: Benelux Confectionery Industry Volume (K Tons) Forecast, by Application 2020 & 2033
- Table 51: Nordics Confectionery Industry Revenue (billion) Forecast, by Application 2020 & 2033
- Table 52: Nordics Confectionery Industry Volume (K Tons) Forecast, by Application 2020 & 2033
- Table 53: Rest of Europe Confectionery Industry Revenue (billion) Forecast, by Application 2020 & 2033
- Table 54: Rest of Europe Confectionery Industry Volume (K Tons) Forecast, by Application 2020 & 2033
- Table 55: Global Confectionery Industry Revenue billion Forecast, by Confections 2020 & 2033
- Table 56: Global Confectionery Industry Volume K Tons Forecast, by Confections 2020 & 2033
- Table 57: Global Confectionery Industry Revenue billion Forecast, by Distribution Channel 2020 & 2033
- Table 58: Global Confectionery Industry Volume K Tons Forecast, by Distribution Channel 2020 & 2033
- Table 59: Global Confectionery Industry Revenue billion Forecast, by Country 2020 & 2033
- Table 60: Global Confectionery Industry Volume K Tons Forecast, by Country 2020 & 2033
- Table 61: Turkey Confectionery Industry Revenue (billion) Forecast, by Application 2020 & 2033
- Table 62: Turkey Confectionery Industry Volume (K Tons) Forecast, by Application 2020 & 2033
- Table 63: Israel Confectionery Industry Revenue (billion) Forecast, by Application 2020 & 2033
- Table 64: Israel Confectionery Industry Volume (K Tons) Forecast, by Application 2020 & 2033
- Table 65: GCC Confectionery Industry Revenue (billion) Forecast, by Application 2020 & 2033
- Table 66: GCC Confectionery Industry Volume (K Tons) Forecast, by Application 2020 & 2033
- Table 67: North Africa Confectionery Industry Revenue (billion) Forecast, by Application 2020 & 2033
- Table 68: North Africa Confectionery Industry Volume (K Tons) Forecast, by Application 2020 & 2033
- Table 69: South Africa Confectionery Industry Revenue (billion) Forecast, by Application 2020 & 2033
- Table 70: South Africa Confectionery Industry Volume (K Tons) Forecast, by Application 2020 & 2033
- Table 71: Rest of Middle East & Africa Confectionery Industry Revenue (billion) Forecast, by Application 2020 & 2033
- Table 72: Rest of Middle East & Africa Confectionery Industry Volume (K Tons) Forecast, by Application 2020 & 2033
- Table 73: Global Confectionery Industry Revenue billion Forecast, by Confections 2020 & 2033
- Table 74: Global Confectionery Industry Volume K Tons Forecast, by Confections 2020 & 2033
- Table 75: Global Confectionery Industry Revenue billion Forecast, by Distribution Channel 2020 & 2033
- Table 76: Global Confectionery Industry Volume K Tons Forecast, by Distribution Channel 2020 & 2033
- Table 77: Global Confectionery Industry Revenue billion Forecast, by Country 2020 & 2033
- Table 78: Global Confectionery Industry Volume K Tons Forecast, by Country 2020 & 2033
- Table 79: China Confectionery Industry Revenue (billion) Forecast, by Application 2020 & 2033
- Table 80: China Confectionery Industry Volume (K Tons) Forecast, by Application 2020 & 2033
- Table 81: India Confectionery Industry Revenue (billion) Forecast, by Application 2020 & 2033
- Table 82: India Confectionery Industry Volume (K Tons) Forecast, by Application 2020 & 2033
- Table 83: Japan Confectionery Industry Revenue (billion) Forecast, by Application 2020 & 2033
- Table 84: Japan Confectionery Industry Volume (K Tons) Forecast, by Application 2020 & 2033
- Table 85: South Korea Confectionery Industry Revenue (billion) Forecast, by Application 2020 & 2033
- Table 86: South Korea Confectionery Industry Volume (K Tons) Forecast, by Application 2020 & 2033
- Table 87: ASEAN Confectionery Industry Revenue (billion) Forecast, by Application 2020 & 2033
- Table 88: ASEAN Confectionery Industry Volume (K Tons) Forecast, by Application 2020 & 2033
- Table 89: Oceania Confectionery Industry Revenue (billion) Forecast, by Application 2020 & 2033
- Table 90: Oceania Confectionery Industry Volume (K Tons) Forecast, by Application 2020 & 2033
- Table 91: Rest of Asia Pacific Confectionery Industry Revenue (billion) Forecast, by Application 2020 & 2033
- Table 92: Rest of Asia Pacific Confectionery Industry Volume (K Tons) Forecast, by Application 2020 & 2033
Frequently Asked Questions
1. What is the projected Compound Annual Growth Rate (CAGR) of the Confectionery Industry?
The projected CAGR is approximately 1.5%.
2. Which companies are prominent players in the Confectionery Industry?
Key companies in the market include Nestlé SA, Chocoladefabriken Lindt & Sprüngli AG, Perfetti Van Melle BV, General Mills Inc, PepsiCo Inc, August Storck KG, Ferrero International SA, Mars Incorporated, Yıldız Holding A, Lotte Corporation, HARIBO Holding GmbH & Co KG, Mondelēz International Inc, Meiji Holdings Company Ltd, The Hershey Company, Kellogg Company.
3. What are the main segments of the Confectionery Industry?
The market segments include Confections, Distribution Channel.
4. Can you provide details about the market size?
The market size is estimated to be USD 83.5 billion as of 2022.
5. What are some drivers contributing to market growth?
Increased Consumption of Baked Goods; Demand for Indigenous Fermented Foods.
6. What are the notable trends driving market growth?
OTHER KEY INDUSTRY TRENDS COVERED IN THE REPORT.
7. Are there any restraints impacting market growth?
Potential Side-effects of Yeast.
8. Can you provide examples of recent developments in the market?
August 2023: Ferrero North America, in the United States, revealed new products and seasonal offerings, including Kinder Chocolate, at the Annual Sweets & Snacks Expo in Chicago.July 2023: HARIBO® officially began gummi production at its first-ever North American manufacturing facility, located in Pleasant Prairie, Wis. The brand-new, state-of-the-art factory was created to meet the growing demand by US consumers of the beloved gummi brand, which produces over 25 varieties of gummi treats in the US and more than 1,200 types globally.July 2023: Ferrero's sister company, Ferrara Candy Co., announced the acquisition of Brazilian snacks company Dori Alimentos, which sells a variety of chocolate and sugar confectionery brands, including Dori, Pettiz, and Jubes.
9. What pricing options are available for accessing the report?
Pricing options include single-user, multi-user, and enterprise licenses priced at USD 3800, USD 4500, and USD 5800 respectively.
10. Is the market size provided in terms of value or volume?
The market size is provided in terms of value, measured in billion and volume, measured in K Tons.
11. Are there any specific market keywords associated with the report?
Yes, the market keyword associated with the report is "Confectionery Industry," which aids in identifying and referencing the specific market segment covered.
12. How do I determine which pricing option suits my needs best?
The pricing options vary based on user requirements and access needs. Individual users may opt for single-user licenses, while businesses requiring broader access may choose multi-user or enterprise licenses for cost-effective access to the report.
13. Are there any additional resources or data provided in the Confectionery Industry report?
While the report offers comprehensive insights, it's advisable to review the specific contents or supplementary materials provided to ascertain if additional resources or data are available.
14. How can I stay updated on further developments or reports in the Confectionery Industry?
To stay informed about further developments, trends, and reports in the Confectionery Industry, consider subscribing to industry newsletters, following relevant companies and organizations, or regularly checking reputable industry news sources and publications.
Methodology
Step 1 - Identification of Relevant Samples Size from Population Database


Step 2 - Approaches for Defining Global Market Size (Value, Volume* & Price*)

Note*: In applicable scenarios
Step 3 - Data Sources
Primary Research
- Web Analytics
- Survey Reports
- Research Institute
- Latest Research Reports
- Opinion Leaders
Secondary Research
- Annual Reports
- White Paper
- Latest Press Release
- Industry Association
- Paid Database
- Investor Presentations

Step 4 - Data Triangulation
Involves using different sources of information in order to increase the validity of a study
These sources are likely to be stakeholders in a program - participants, other researchers, program staff, other community members, and so on.
Then we put all data in single framework & apply various statistical tools to find out the dynamic on the market.
During the analysis stage, feedback from the stakeholder groups would be compared to determine areas of agreement as well as areas of divergence