

Key Insights
The U.S. contraceptive market, a significant segment of the global market, is experiencing robust growth fueled by several key factors. The increasing awareness of family planning and reproductive health among women, coupled with government initiatives promoting access to contraception, significantly contributes to market expansion. Technological advancements in contraceptive methods, including the development of more effective and user-friendly options like long-acting reversible contraceptives (LARCs) such as IUDs and implants, are driving market growth. Furthermore, the rising prevalence of sexually transmitted infections (STIs) is increasing the demand for barrier methods of contraception, further bolstering market size. Competition among established pharmaceutical companies and emerging players introduces innovation and diverse product offerings, catering to a wide range of consumer needs and preferences. While pricing and insurance coverage remain potential challenges, the overall market outlook for contraceptives in the U.S. remains positive, projecting sustained growth throughout the forecast period.
The market segmentation within the U.S. reveals diverse growth patterns. The injectable contraceptives segment is witnessing considerable traction due to its long-lasting effectiveness and ease of administration. The female segment naturally dominates the market due to biological factors, while the male contraceptive segment is exhibiting emerging growth potential as new and more effective options are developed. The drug-based contraceptives segment commands a substantial market share owing to their widespread availability and efficacy. Geographic variations exist within the U.S., with higher adoption rates observed in urban areas compared to rural regions due to better access to healthcare facilities and information. However, consistent efforts towards improving healthcare access in underserved communities are expected to bridge this gap and drive market expansion across all regions. Future growth will be shaped by ongoing research and development, regulatory approvals for new products, and continued efforts to improve affordability and access to contraception for all.

Contraceptive Industry in United States: A Comprehensive Market Report (2019-2033)
This dynamic report provides a detailed analysis of the U.S. contraceptive market, offering invaluable insights for stakeholders across the industry. Leveraging extensive data from 2019-2024 (historical period), a base year of 2025, and a forecast period extending to 2033, this study unveils critical market trends, growth drivers, and competitive landscapes. The report covers key segments including Contraceptive Injectable (by device, gender – male & female, and by drug products), offering a granular understanding of market size, segment performance, and future potential. Key players such as Church & Dwight Co Inc, Bayer AG, Teva Pharmaceuticals Ltd, Merck & Co Inc, Ani Pharmaceuticals Inc, Agile Therapeutics, Johnson & Johnson Ltd, Allergan PLC, Fuji Latex Co Ltd, and Pfizer Inc are meticulously analyzed. The projected market value in 2025 is estimated at xx Million and is expected to witness significant growth during the forecast period.
Contraceptive Industry in United States Market Structure & Competitive Landscape
The U.S. contraceptive market exhibits a moderately concentrated structure, with a few major players holding significant market share. However, the presence of numerous smaller players and emerging innovative companies creates a dynamic competitive landscape. Innovation in drug delivery systems, improved efficacy, and patient-centric product development are key drivers. Regulatory changes, particularly those impacting access and affordability, significantly influence market dynamics. Product substitutes, such as natural family planning methods, exert competitive pressure. The market is segmented by end-users, including hospitals, clinics, pharmacies, and individual consumers. M&A activity in the sector has been relatively moderate in recent years, with xx Million in deals completed between 2019 and 2024, primarily focused on expanding product portfolios and geographical reach. The Herfindahl-Hirschman Index (HHI) for the market is estimated at xx, indicating a moderately concentrated market.
- Market Concentration: Moderately concentrated, with a few dominant players.
- Innovation Drivers: Improved efficacy, convenient delivery systems, personalized solutions.
- Regulatory Impacts: Significant influence on market access and pricing.
- Product Substitutes: Natural family planning methods pose competitive pressure.
- End-User Segmentation: Hospitals, clinics, pharmacies, individual consumers.
- M&A Trends: Moderate activity, focused on portfolio expansion and geographical reach.
Contraceptive Industry in United States Market Trends & Opportunities
The U.S. contraceptive market is experiencing robust growth, projected to reach [Insert Updated Market Size in Millions] by 2033, exhibiting a Compound Annual Growth Rate (CAGR) of [Insert Updated CAGR]% during the forecast period (2025-2033). This expansion is driven by a confluence of factors, including heightened awareness of reproductive health and family planning, rising disposable incomes, and improved access to comprehensive healthcare services. Technological advancements play a pivotal role, with the development and increased adoption of long-acting reversible contraceptives (LARCs), such as intrauterine devices (IUDs) and implants, and the emergence of personalized contraceptive options tailored to individual needs and preferences. Consumers are increasingly prioritizing convenient and highly effective methods, leading to a surge in demand for LARCs and hormonal contraceptives. The competitive landscape is dynamic, characterized by continuous innovation, product differentiation strategies, aggressive marketing campaigns, and strategic mergers and acquisitions. Market penetration rates vary considerably across different contraceptive methods, with LARCs demonstrating particularly strong adoption rates and growth potential.
Dominant Markets & Segments in Contraceptive Industry in United States
Hormonal contraceptives, encompassing oral contraceptives (pills) and injectables, constitute the dominant segment of the U.S. contraceptive market, accounting for approximately [Insert Updated Market Share in Millions] in 2025. Within injectable contraceptives, the female segment maintains a significant market share. The continued growth of this segment is fueled by several key factors:
- Exceptional Effectiveness: Injectable contraceptives offer a high degree of birth control efficacy.
- Extended Duration: Their long-acting nature minimizes the need for frequent refills and reduces concerns about consistent adherence.
- Enhanced Awareness & Education: Comprehensive public health campaigns and increased access to accurate information are driving adoption.
- Improved Accessibility: Expanded availability through diverse healthcare providers, including telehealth platforms.
While the male contraceptive segment currently represents a smaller portion of the market, substantial investments in research and development suggest significant potential for future expansion. Geographically, urban areas exhibit higher contraceptive usage rates than rural regions, reflecting disparities in healthcare access, awareness, and socioeconomic factors.
Contraceptive Industry in United States Product Analysis
The U.S. contraceptive market showcases continuous product innovation, with a focus on improving efficacy, convenience, and user experience. Technological advancements have led to the development of long-acting reversible contraceptives (LARCs), such as intrauterine devices (IUDs) and implants, offering extended protection and reduced user intervention. These advancements cater to consumer preferences for long-term, effective, and convenient contraception. The market also sees innovation in hormonal contraceptives, focusing on personalized formulations and improved tolerability profiles. These product innovations are enhancing market competitiveness and driving market growth.
Key Drivers, Barriers & Challenges in Contraceptive Industry in United States
Key Drivers: Technological advancements in contraceptive methods, rising disposable incomes enabling access to premium products, and increased awareness of reproductive health through public health campaigns are key drivers. Government initiatives promoting family planning also contribute.
Challenges: Regulatory hurdles in obtaining approvals for new products, supply chain disruptions affecting product availability, and intense competition among established players and new entrants create significant challenges. These factors can impact market growth and profitability. The fluctuating costs of raw materials also pose a threat.
Growth Drivers in the Contraceptive Industry in United States Market
Several key factors are propelling growth within the U.S. contraceptive industry. These include technological innovations leading to improved contraceptive delivery systems, a rising awareness of reproductive health and family planning among diverse populations, increased government funding directed towards family planning programs and initiatives, and a steady rise in the disposable income of women. Furthermore, favorable regulatory environments that streamline product approvals and enhance access to contraceptives contribute significantly to market expansion. The increasing integration of telehealth and digital health technologies also plays a major role in improving accessibility and convenience for consumers.
Challenges Impacting Contraceptive Industry in United States Growth
Stringent regulatory approvals for new contraceptive methods, potential supply chain disruptions due to geopolitical uncertainties, and intense price competition among established and emerging players represent key challenges. The impact of these factors needs careful consideration by companies operating within the U.S. contraceptive market.
Key Players Shaping the Contraceptive Industry in United States Market
- Church & Dwight Co Inc
- Bayer AG
- Teva Pharmaceuticals Ltd
- Merck & Co Inc
- Ani Pharmaceuticals Inc
- Agile Therapeutics
- Johnson & Johnson Ltd
- Allergan PLC
- Fuji Latex Co Ltd
- Pfizer Inc
Significant Contraceptive Industry in United States Industry Milestones
- 2020: FDA approval of a new extended-release contraceptive implant, signifying a step forward in long-acting reversible contraception.
- 2021: Launch of a novel hormonal contraceptive patch by a major player, introducing a new delivery method and enhancing consumer choices.
- 2022: Merger between two smaller contraceptive manufacturers, resulting in an expanded product portfolio and increased market competitiveness.
- 2023: Significant increase in government funding allocated to family planning initiatives, enhancing access and affordability.
- 2024: Introduction of a new telehealth platform for convenient contraceptive access, improving accessibility and reducing barriers to care.
Future Outlook for Contraceptive Industry in United States Market
The U.S. contraceptive market is expected to experience sustained growth driven by technological innovation, increased consumer awareness, and government support. Strategic partnerships and collaborations between pharmaceutical companies and healthcare providers will further expand market access and penetration. The development of novel contraceptive technologies, including male contraceptives and personalized options, holds significant potential for future market expansion, offering substantial opportunities for market growth and innovation.
Contraceptive Industry in United States Segmentation
-
1. Products
-
1.1. By Drugs
- 1.1.1. Oral Contraceptives
- 1.1.2. Topical Contraceptives
- 1.1.3. Contraceptive Injectable
-
1.2. By Device
- 1.2.1. Condoms
- 1.2.2. Diaphragms
- 1.2.3. Cervical Caps
- 1.2.4. Sponges
- 1.2.5. Vaginal Rings
- 1.2.6. IUDs
- 1.2.7. Other Devices
-
1.1. By Drugs
-
2. Gender
- 2.1. Male
- 2.2. Female
-
3. Geography
-
3.1. North America
- 3.1.1. United States
- 3.1.2. Canada
- 3.1.3. Mexico
-
3.1. North America
Contraceptive Industry in United States Segmentation By Geography
-
1. North America
- 1.1. United States
- 1.2. Canada
- 1.3. Mexico
Contraceptive Industry in United States REPORT HIGHLIGHTS
| Aspects | Details |
|---|---|
| Study Period | 2019-2033 |
| Base Year | 2024 |
| Estimated Year | 2025 |
| Forecast Period | 2025-2033 |
| Historical Period | 2019-2024 |
| Growth Rate | CAGR of 5.90% from 2019-2033 |
| Segmentation |
|
Table of Contents
- 1. Introduction
- 1.1. Research Scope
- 1.2. Market Segmentation
- 1.3. Research Methodology
- 1.4. Definitions and Assumptions
- 2. Executive Summary
- 2.1. Introduction
- 3. Market Dynamics
- 3.1. Introduction
- 3.2. Market Drivers
- 3.2.1. ; Increasing Rate of Unintended Pregnancies; Rise in Government Initiatives
- 3.3. Market Restrains
- 3.3.1. ; Side Effects Associated with the Use of Contraceptive Drugs and Devices
- 3.4. Market Trends
- 3.4.1. Condoms are Expected to Dominate the Contraceptive Devices Market
- 4. Market Factor Analysis
- 4.1. Porters Five Forces
- 4.2. Supply/Value Chain
- 4.3. PESTEL analysis
- 4.4. Market Entropy
- 4.5. Patent/Trademark Analysis
- 5. Global Contraceptive Industry in United States Analysis, Insights and Forecast, 2019-2031
- 5.1. Market Analysis, Insights and Forecast - by Products
- 5.1.1. By Drugs
- 5.1.1.1. Oral Contraceptives
- 5.1.1.2. Topical Contraceptives
- 5.1.1.3. Contraceptive Injectable
- 5.1.2. By Device
- 5.1.2.1. Condoms
- 5.1.2.2. Diaphragms
- 5.1.2.3. Cervical Caps
- 5.1.2.4. Sponges
- 5.1.2.5. Vaginal Rings
- 5.1.2.6. IUDs
- 5.1.2.7. Other Devices
- 5.1.1. By Drugs
- 5.2. Market Analysis, Insights and Forecast - by Gender
- 5.2.1. Male
- 5.2.2. Female
- 5.3. Market Analysis, Insights and Forecast - by Geography
- 5.3.1. North America
- 5.3.1.1. United States
- 5.3.1.2. Canada
- 5.3.1.3. Mexico
- 5.3.1. North America
- 5.4. Market Analysis, Insights and Forecast - by Region
- 5.4.1. North America
- 5.1. Market Analysis, Insights and Forecast - by Products
- 6. North America Contraceptive Industry in United States Analysis, Insights and Forecast, 2019-2031
- 6.1. Market Analysis, Insights and Forecast - By Country/Sub-region
- 6.1.1 United States
- 6.1.2 Canada
- 6.1.3 Mexico
- 7. Europe Contraceptive Industry in United States Analysis, Insights and Forecast, 2019-2031
- 7.1. Market Analysis, Insights and Forecast - By Country/Sub-region
- 7.1.1 Germany
- 7.1.2 United Kingdom
- 7.1.3 France
- 7.1.4 Spain
- 7.1.5 Italy
- 7.1.6 Spain
- 7.1.7 Belgium
- 7.1.8 Netherland
- 7.1.9 Nordics
- 7.1.10 Rest of Europe
- 8. Asia Pacific Contraceptive Industry in United States Analysis, Insights and Forecast, 2019-2031
- 8.1. Market Analysis, Insights and Forecast - By Country/Sub-region
- 8.1.1 China
- 8.1.2 Japan
- 8.1.3 India
- 8.1.4 South Korea
- 8.1.5 Southeast Asia
- 8.1.6 Australia
- 8.1.7 Indonesia
- 8.1.8 Phillipes
- 8.1.9 Singapore
- 8.1.10 Thailandc
- 8.1.11 Rest of Asia Pacific
- 9. South America Contraceptive Industry in United States Analysis, Insights and Forecast, 2019-2031
- 9.1. Market Analysis, Insights and Forecast - By Country/Sub-region
- 9.1.1 Brazil
- 9.1.2 Argentina
- 9.1.3 Peru
- 9.1.4 Chile
- 9.1.5 Colombia
- 9.1.6 Ecuador
- 9.1.7 Venezuela
- 9.1.8 Rest of South America
- 10. North America Contraceptive Industry in United States Analysis, Insights and Forecast, 2019-2031
- 10.1. Market Analysis, Insights and Forecast - By Country/Sub-region
- 10.1.1 United States
- 10.1.2 Canada
- 10.1.3 Mexico
- 11. MEA Contraceptive Industry in United States Analysis, Insights and Forecast, 2019-2031
- 11.1. Market Analysis, Insights and Forecast - By Country/Sub-region
- 11.1.1 United Arab Emirates
- 11.1.2 Saudi Arabia
- 11.1.3 South Africa
- 11.1.4 Rest of Middle East and Africa
- 12. Competitive Analysis
- 12.1. Global Market Share Analysis 2024
- 12.2. Company Profiles
- 12.2.1 Church & Dwight Co Inc
- 12.2.1.1. Overview
- 12.2.1.2. Products
- 12.2.1.3. SWOT Analysis
- 12.2.1.4. Recent Developments
- 12.2.1.5. Financials (Based on Availability)
- 12.2.2 Bayer AG
- 12.2.2.1. Overview
- 12.2.2.2. Products
- 12.2.2.3. SWOT Analysis
- 12.2.2.4. Recent Developments
- 12.2.2.5. Financials (Based on Availability)
- 12.2.3 Teva Pharmaceuticals Ltd
- 12.2.3.1. Overview
- 12.2.3.2. Products
- 12.2.3.3. SWOT Analysis
- 12.2.3.4. Recent Developments
- 12.2.3.5. Financials (Based on Availability)
- 12.2.4 Merck & Co Inc
- 12.2.4.1. Overview
- 12.2.4.2. Products
- 12.2.4.3. SWOT Analysis
- 12.2.4.4. Recent Developments
- 12.2.4.5. Financials (Based on Availability)
- 12.2.5 Ani Pharmaceuticals Inc
- 12.2.5.1. Overview
- 12.2.5.2. Products
- 12.2.5.3. SWOT Analysis
- 12.2.5.4. Recent Developments
- 12.2.5.5. Financials (Based on Availability)
- 12.2.6 Agile Therapeutics
- 12.2.6.1. Overview
- 12.2.6.2. Products
- 12.2.6.3. SWOT Analysis
- 12.2.6.4. Recent Developments
- 12.2.6.5. Financials (Based on Availability)
- 12.2.7 Johnson & Johnson Ltd*List Not Exhaustive
- 12.2.7.1. Overview
- 12.2.7.2. Products
- 12.2.7.3. SWOT Analysis
- 12.2.7.4. Recent Developments
- 12.2.7.5. Financials (Based on Availability)
- 12.2.8 Allergan PLC
- 12.2.8.1. Overview
- 12.2.8.2. Products
- 12.2.8.3. SWOT Analysis
- 12.2.8.4. Recent Developments
- 12.2.8.5. Financials (Based on Availability)
- 12.2.9 Fuji Latex Co Ltd
- 12.2.9.1. Overview
- 12.2.9.2. Products
- 12.2.9.3. SWOT Analysis
- 12.2.9.4. Recent Developments
- 12.2.9.5. Financials (Based on Availability)
- 12.2.10 Pfizer Inc
- 12.2.10.1. Overview
- 12.2.10.2. Products
- 12.2.10.3. SWOT Analysis
- 12.2.10.4. Recent Developments
- 12.2.10.5. Financials (Based on Availability)
- 12.2.1 Church & Dwight Co Inc
List of Figures
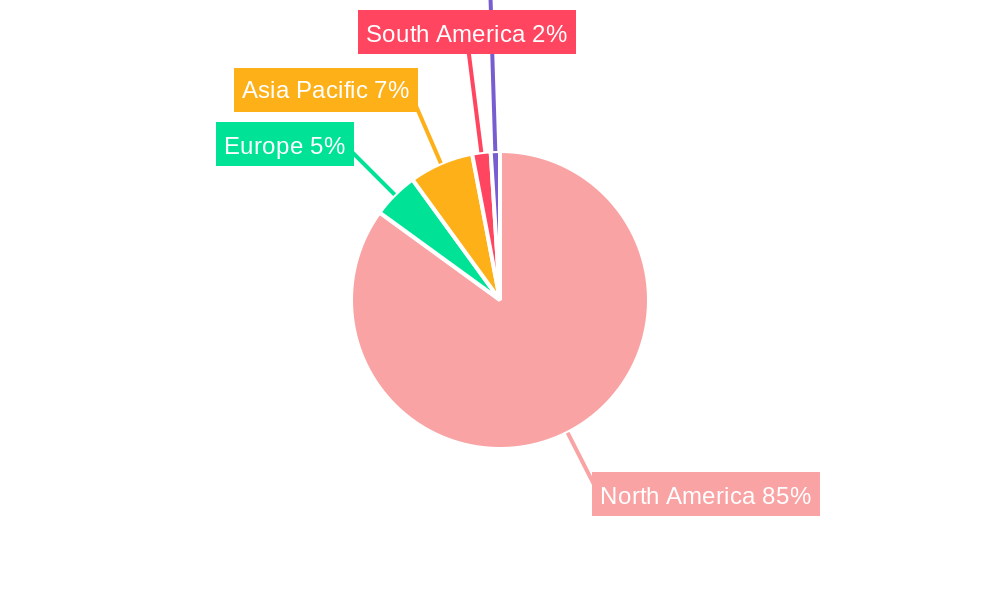
- Figure 1: Global Contraceptive Industry in United States Revenue Breakdown (Million, %) by Region 2024 & 2032
- Figure 2: North America Contraceptive Industry in United States Revenue (Million), by Country 2024 & 2032
- Figure 3: North America Contraceptive Industry in United States Revenue Share (%), by Country 2024 & 2032
- Figure 4: Europe Contraceptive Industry in United States Revenue (Million), by Country 2024 & 2032
- Figure 5: Europe Contraceptive Industry in United States Revenue Share (%), by Country 2024 & 2032
- Figure 6: Asia Pacific Contraceptive Industry in United States Revenue (Million), by Country 2024 & 2032
- Figure 7: Asia Pacific Contraceptive Industry in United States Revenue Share (%), by Country 2024 & 2032
- Figure 8: South America Contraceptive Industry in United States Revenue (Million), by Country 2024 & 2032
- Figure 9: South America Contraceptive Industry in United States Revenue Share (%), by Country 2024 & 2032
- Figure 10: North America Contraceptive Industry in United States Revenue (Million), by Country 2024 & 2032
- Figure 11: North America Contraceptive Industry in United States Revenue Share (%), by Country 2024 & 2032
- Figure 12: MEA Contraceptive Industry in United States Revenue (Million), by Country 2024 & 2032
- Figure 13: MEA Contraceptive Industry in United States Revenue Share (%), by Country 2024 & 2032
- Figure 14: North America Contraceptive Industry in United States Revenue (Million), by Products 2024 & 2032
- Figure 15: North America Contraceptive Industry in United States Revenue Share (%), by Products 2024 & 2032
- Figure 16: North America Contraceptive Industry in United States Revenue (Million), by Gender 2024 & 2032
- Figure 17: North America Contraceptive Industry in United States Revenue Share (%), by Gender 2024 & 2032
- Figure 18: North America Contraceptive Industry in United States Revenue (Million), by Geography 2024 & 2032
- Figure 19: North America Contraceptive Industry in United States Revenue Share (%), by Geography 2024 & 2032
- Figure 20: North America Contraceptive Industry in United States Revenue (Million), by Country 2024 & 2032
- Figure 21: North America Contraceptive Industry in United States Revenue Share (%), by Country 2024 & 2032
List of Tables
- Table 1: Global Contraceptive Industry in United States Revenue Million Forecast, by Region 2019 & 2032
- Table 2: Global Contraceptive Industry in United States Revenue Million Forecast, by Products 2019 & 2032
- Table 3: Global Contraceptive Industry in United States Revenue Million Forecast, by Gender 2019 & 2032
- Table 4: Global Contraceptive Industry in United States Revenue Million Forecast, by Geography 2019 & 2032
- Table 5: Global Contraceptive Industry in United States Revenue Million Forecast, by Region 2019 & 2032
- Table 6: Global Contraceptive Industry in United States Revenue Million Forecast, by Country 2019 & 2032
- Table 7: United States Contraceptive Industry in United States Revenue (Million) Forecast, by Application 2019 & 2032
- Table 8: Canada Contraceptive Industry in United States Revenue (Million) Forecast, by Application 2019 & 2032
- Table 9: Mexico Contraceptive Industry in United States Revenue (Million) Forecast, by Application 2019 & 2032
- Table 10: Global Contraceptive Industry in United States Revenue Million Forecast, by Country 2019 & 2032
- Table 11: Germany Contraceptive Industry in United States Revenue (Million) Forecast, by Application 2019 & 2032
- Table 12: United Kingdom Contraceptive Industry in United States Revenue (Million) Forecast, by Application 2019 & 2032
- Table 13: France Contraceptive Industry in United States Revenue (Million) Forecast, by Application 2019 & 2032
- Table 14: Spain Contraceptive Industry in United States Revenue (Million) Forecast, by Application 2019 & 2032
- Table 15: Italy Contraceptive Industry in United States Revenue (Million) Forecast, by Application 2019 & 2032
- Table 16: Spain Contraceptive Industry in United States Revenue (Million) Forecast, by Application 2019 & 2032
- Table 17: Belgium Contraceptive Industry in United States Revenue (Million) Forecast, by Application 2019 & 2032
- Table 18: Netherland Contraceptive Industry in United States Revenue (Million) Forecast, by Application 2019 & 2032
- Table 19: Nordics Contraceptive Industry in United States Revenue (Million) Forecast, by Application 2019 & 2032
- Table 20: Rest of Europe Contraceptive Industry in United States Revenue (Million) Forecast, by Application 2019 & 2032
- Table 21: Global Contraceptive Industry in United States Revenue Million Forecast, by Country 2019 & 2032
- Table 22: China Contraceptive Industry in United States Revenue (Million) Forecast, by Application 2019 & 2032
- Table 23: Japan Contraceptive Industry in United States Revenue (Million) Forecast, by Application 2019 & 2032
- Table 24: India Contraceptive Industry in United States Revenue (Million) Forecast, by Application 2019 & 2032
- Table 25: South Korea Contraceptive Industry in United States Revenue (Million) Forecast, by Application 2019 & 2032
- Table 26: Southeast Asia Contraceptive Industry in United States Revenue (Million) Forecast, by Application 2019 & 2032
- Table 27: Australia Contraceptive Industry in United States Revenue (Million) Forecast, by Application 2019 & 2032
- Table 28: Indonesia Contraceptive Industry in United States Revenue (Million) Forecast, by Application 2019 & 2032
- Table 29: Phillipes Contraceptive Industry in United States Revenue (Million) Forecast, by Application 2019 & 2032
- Table 30: Singapore Contraceptive Industry in United States Revenue (Million) Forecast, by Application 2019 & 2032
- Table 31: Thailandc Contraceptive Industry in United States Revenue (Million) Forecast, by Application 2019 & 2032
- Table 32: Rest of Asia Pacific Contraceptive Industry in United States Revenue (Million) Forecast, by Application 2019 & 2032
- Table 33: Global Contraceptive Industry in United States Revenue Million Forecast, by Country 2019 & 2032
- Table 34: Brazil Contraceptive Industry in United States Revenue (Million) Forecast, by Application 2019 & 2032
- Table 35: Argentina Contraceptive Industry in United States Revenue (Million) Forecast, by Application 2019 & 2032
- Table 36: Peru Contraceptive Industry in United States Revenue (Million) Forecast, by Application 2019 & 2032
- Table 37: Chile Contraceptive Industry in United States Revenue (Million) Forecast, by Application 2019 & 2032
- Table 38: Colombia Contraceptive Industry in United States Revenue (Million) Forecast, by Application 2019 & 2032
- Table 39: Ecuador Contraceptive Industry in United States Revenue (Million) Forecast, by Application 2019 & 2032
- Table 40: Venezuela Contraceptive Industry in United States Revenue (Million) Forecast, by Application 2019 & 2032
- Table 41: Rest of South America Contraceptive Industry in United States Revenue (Million) Forecast, by Application 2019 & 2032
- Table 42: Global Contraceptive Industry in United States Revenue Million Forecast, by Country 2019 & 2032
- Table 43: United States Contraceptive Industry in United States Revenue (Million) Forecast, by Application 2019 & 2032
- Table 44: Canada Contraceptive Industry in United States Revenue (Million) Forecast, by Application 2019 & 2032
- Table 45: Mexico Contraceptive Industry in United States Revenue (Million) Forecast, by Application 2019 & 2032
- Table 46: Global Contraceptive Industry in United States Revenue Million Forecast, by Country 2019 & 2032
- Table 47: United Arab Emirates Contraceptive Industry in United States Revenue (Million) Forecast, by Application 2019 & 2032
- Table 48: Saudi Arabia Contraceptive Industry in United States Revenue (Million) Forecast, by Application 2019 & 2032
- Table 49: South Africa Contraceptive Industry in United States Revenue (Million) Forecast, by Application 2019 & 2032
- Table 50: Rest of Middle East and Africa Contraceptive Industry in United States Revenue (Million) Forecast, by Application 2019 & 2032
- Table 51: Global Contraceptive Industry in United States Revenue Million Forecast, by Products 2019 & 2032
- Table 52: Global Contraceptive Industry in United States Revenue Million Forecast, by Gender 2019 & 2032
- Table 53: Global Contraceptive Industry in United States Revenue Million Forecast, by Geography 2019 & 2032
- Table 54: Global Contraceptive Industry in United States Revenue Million Forecast, by Country 2019 & 2032
- Table 55: United States Contraceptive Industry in United States Revenue (Million) Forecast, by Application 2019 & 2032
- Table 56: Canada Contraceptive Industry in United States Revenue (Million) Forecast, by Application 2019 & 2032
- Table 57: Mexico Contraceptive Industry in United States Revenue (Million) Forecast, by Application 2019 & 2032
Frequently Asked Questions
1. What is the projected Compound Annual Growth Rate (CAGR) of the Contraceptive Industry in United States?
The projected CAGR is approximately 5.90%.
2. Which companies are prominent players in the Contraceptive Industry in United States?
Key companies in the market include Church & Dwight Co Inc, Bayer AG, Teva Pharmaceuticals Ltd, Merck & Co Inc, Ani Pharmaceuticals Inc, Agile Therapeutics, Johnson & Johnson Ltd*List Not Exhaustive, Allergan PLC, Fuji Latex Co Ltd, Pfizer Inc.
3. What are the main segments of the Contraceptive Industry in United States?
The market segments include Products, Gender, Geography.
4. Can you provide details about the market size?
The market size is estimated to be USD XX Million as of 2022.
5. What are some drivers contributing to market growth?
; Increasing Rate of Unintended Pregnancies; Rise in Government Initiatives.
6. What are the notable trends driving market growth?
Condoms are Expected to Dominate the Contraceptive Devices Market.
7. Are there any restraints impacting market growth?
; Side Effects Associated with the Use of Contraceptive Drugs and Devices.
8. Can you provide examples of recent developments in the market?
N/A
9. What pricing options are available for accessing the report?
Pricing options include single-user, multi-user, and enterprise licenses priced at USD 4750, USD 5250, and USD 8750 respectively.
10. Is the market size provided in terms of value or volume?
The market size is provided in terms of value, measured in Million.
11. Are there any specific market keywords associated with the report?
Yes, the market keyword associated with the report is "Contraceptive Industry in United States," which aids in identifying and referencing the specific market segment covered.
12. How do I determine which pricing option suits my needs best?
The pricing options vary based on user requirements and access needs. Individual users may opt for single-user licenses, while businesses requiring broader access may choose multi-user or enterprise licenses for cost-effective access to the report.
13. Are there any additional resources or data provided in the Contraceptive Industry in United States report?
While the report offers comprehensive insights, it's advisable to review the specific contents or supplementary materials provided to ascertain if additional resources or data are available.
14. How can I stay updated on further developments or reports in the Contraceptive Industry in United States?
To stay informed about further developments, trends, and reports in the Contraceptive Industry in United States, consider subscribing to industry newsletters, following relevant companies and organizations, or regularly checking reputable industry news sources and publications.
Methodology
Step 1 - Identification of Relevant Samples Size from Population Database


Step 2 - Approaches for Defining Global Market Size (Value, Volume* & Price*)

Note*: In applicable scenarios
Step 3 - Data Sources
Primary Research
- Web Analytics
- Survey Reports
- Research Institute
- Latest Research Reports
- Opinion Leaders
Secondary Research
- Annual Reports
- White Paper
- Latest Press Release
- Industry Association
- Paid Database
- Investor Presentations

Step 4 - Data Triangulation
Involves using different sources of information in order to increase the validity of a study
These sources are likely to be stakeholders in a program - participants, other researchers, program staff, other community members, and so on.
Then we put all data in single framework & apply various statistical tools to find out the dynamic on the market.
During the analysis stage, feedback from the stakeholder groups would be compared to determine areas of agreement as well as areas of divergence
