

Key Insights
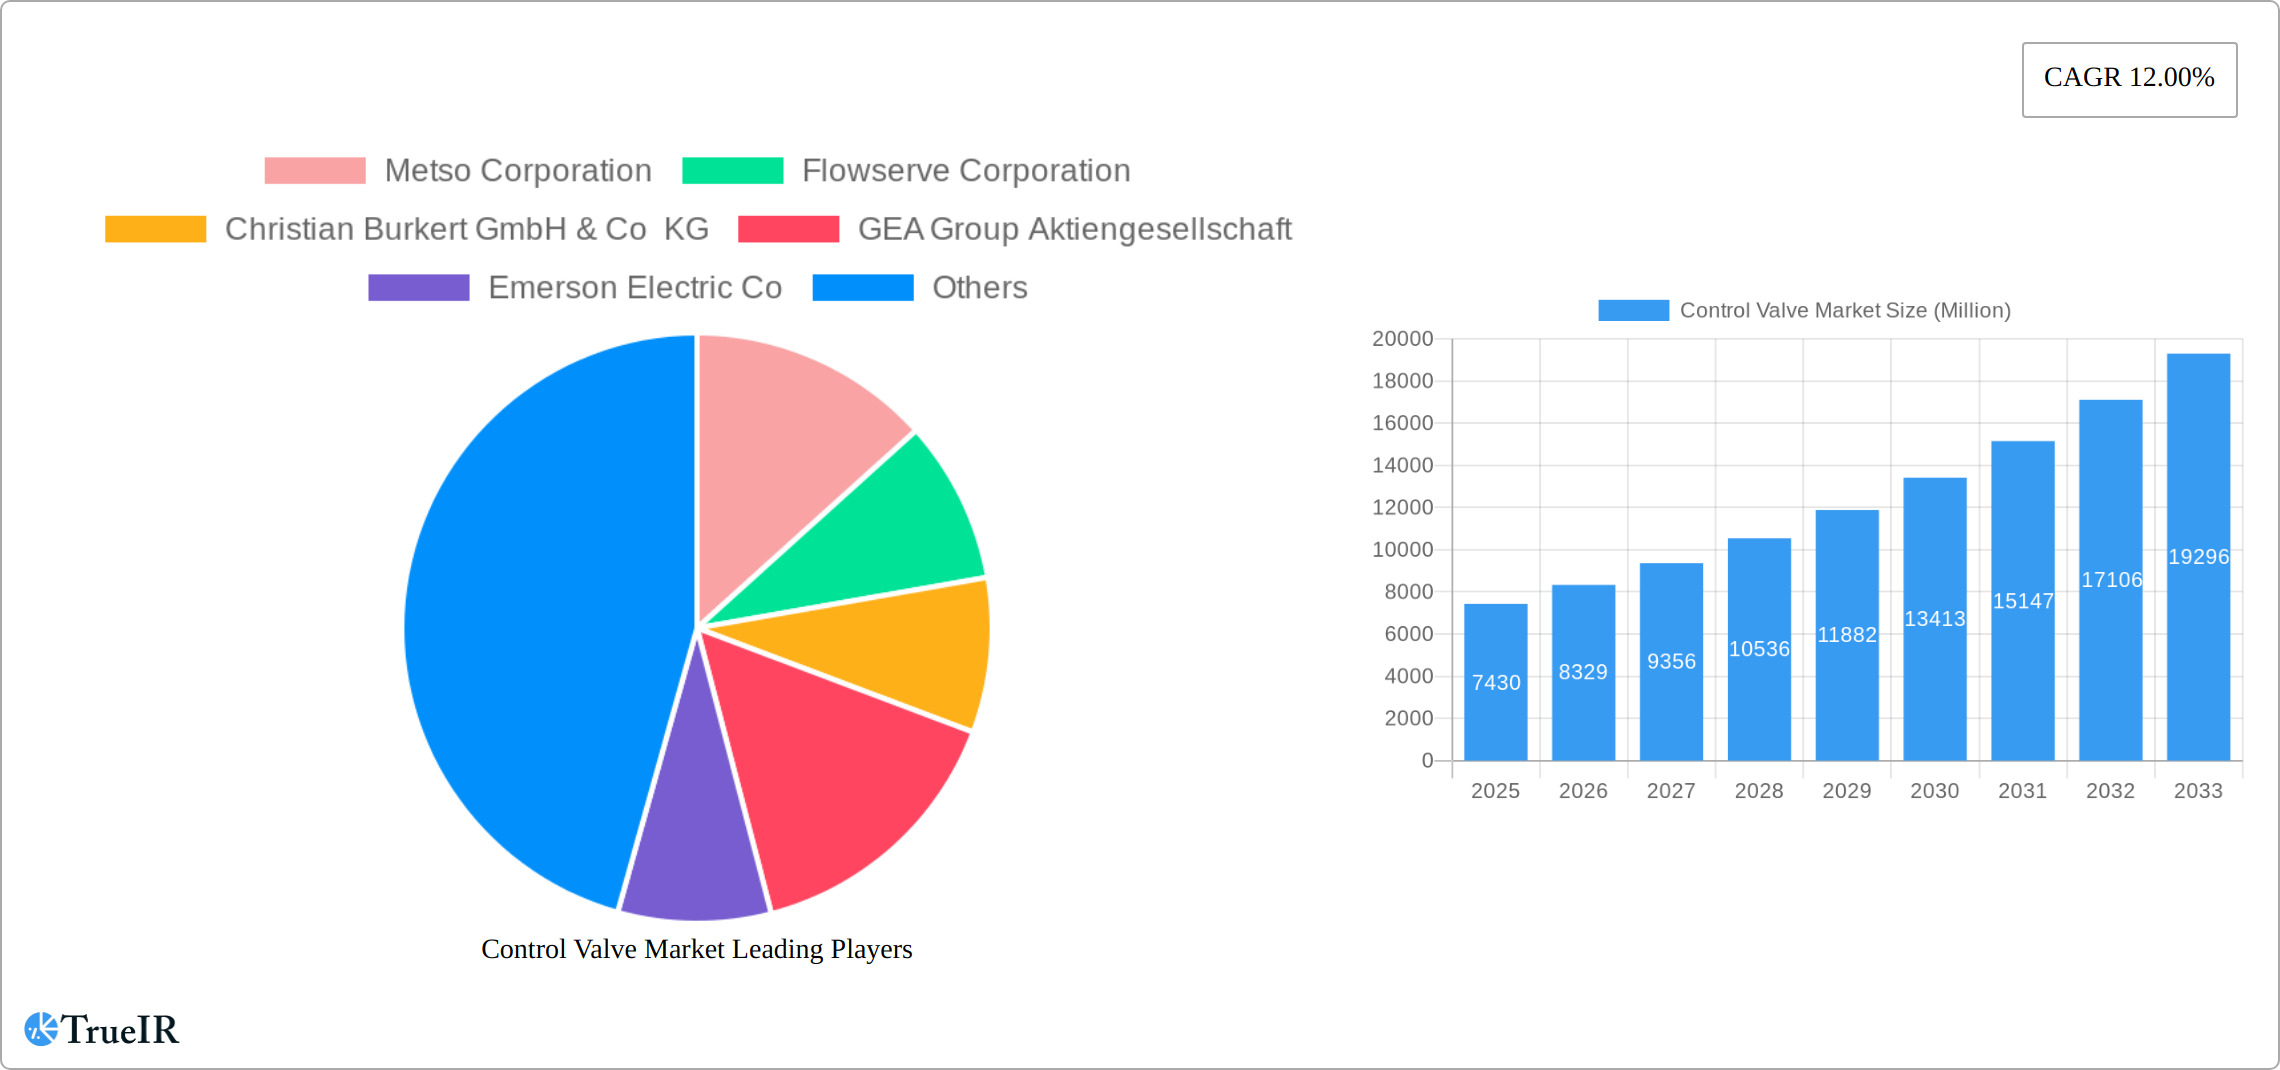
The global control valve market, valued at $7.43 billion in 2025, is projected to experience robust growth, driven by a compound annual growth rate (CAGR) of 12% from 2025 to 2033. This expansion is fueled by several key factors. Firstly, the burgeoning oil and gas industry, coupled with increasing investments in petrochemical and energy sectors, significantly boosts demand for efficient process control solutions. Secondly, the growing emphasis on automation and digitalization within industrial processes necessitates the adoption of advanced control valves offering enhanced precision and remote monitoring capabilities. Furthermore, stringent environmental regulations and the need for optimized resource management in water and wastewater treatment plants are driving the demand for energy-efficient and reliable control valves. The market's segmentation reflects this diversification, with significant contributions from globe, ball, and butterfly valves across various end-user industries. While specific regional breakdowns are not fully detailed, North America and Asia (particularly China and India) are anticipated to be major contributors due to their substantial industrial bases and ongoing infrastructure development.
The competitive landscape is characterized by both established multinational corporations like Metso Corporation, Flowserve Corporation, and Emerson Electric Co., and regional players. Innovation in valve design and materials, including the development of smart valves with integrated sensors and communication capabilities, is shaping the market. However, challenges remain, including potential fluctuations in raw material prices and the need to address specific operational challenges in different industrial settings. Nonetheless, the overall outlook for the control valve market remains positive, driven by long-term growth projections in key end-user industries and continuous technological advancements offering improved efficiency, safety, and sustainability. The market's resilience is supported by the indispensable role control valves play in maintaining operational efficiency and safety across diverse industrial sectors.
Control Valve Market: A Comprehensive Report (2019-2033)
This dynamic report provides a detailed analysis of the Control Valve Market, encompassing market size, segmentation, competitive landscape, growth drivers, and future outlook. Leveraging extensive research and data from 2019 to 2033 (forecast period: 2025-2033, base year: 2025), this report is an essential resource for industry stakeholders seeking actionable insights and strategic guidance. The global control valve market is projected to reach xx Million by 2033, exhibiting a robust CAGR of xx% during the forecast period.
Control Valve Market Market Structure & Competitive Landscape
The Control Valve market exhibits a moderately consolidated structure, with key players such as Metso Corporation, Flowserve Corporation, Emerson Electric Co, and Baker Hughes Company holding significant market share. The Herfindahl-Hirschman Index (HHI) is estimated at xx, indicating a moderately competitive landscape. Innovation is a key driver, with companies continuously developing advanced materials, control technologies, and automation solutions to enhance efficiency and reduce operational costs. Stringent environmental regulations, particularly regarding emissions and safety, significantly impact market dynamics, driving demand for advanced control valves with improved precision and performance. Product substitution, primarily from digitally enhanced and smart valve technologies, presents both opportunities and challenges for established players.
End-user segmentation significantly influences market demand, with the oil and gas, chemical, and energy sectors being dominant consumers. The increasing prevalence of mergers and acquisitions (M&A) activity suggests consolidation and expansion strategies within the industry. Over the period 2019-2024, an estimated xx Million in M&A transactions were recorded in the Control Valve sector, highlighting aggressive market positioning. This trend is expected to continue, driven by the pursuit of economies of scale, technological expertise, and enhanced market reach.
- Market Concentration: Moderately Consolidated (HHI: xx)
- Innovation Drivers: Advanced materials, control technologies, automation
- Regulatory Impacts: Stringent environmental regulations, safety standards
- Product Substitutes: Smart valves, digitally enhanced control systems
- End-User Segmentation: Oil & Gas, Chemical, Energy, Water Treatment, etc.
- M&A Trends: Significant activity (xx Million in 2019-2024), expected to continue.
Control Valve Market Market Trends & Opportunities
The Control Valve market is experiencing significant growth, driven by increasing industrial automation, rising demand from emerging economies, and the ongoing need for efficient process control across diverse sectors. The market size expanded from xx Million in 2019 to xx Million in 2024, indicating a strong growth trajectory. Technological advancements, such as smart valves with integrated sensors and remote monitoring capabilities, are transforming the industry. These smart valves enable predictive maintenance, improved operational efficiency, and reduced downtime. Consumer preferences are shifting toward more sustainable and energy-efficient solutions, prompting manufacturers to develop eco-friendly control valves.
Competitive dynamics are characterized by intense rivalry among established players and the emergence of innovative startups. Market penetration rates vary significantly across different regions and end-user segments, with higher penetration in developed economies compared to developing regions. The CAGR for the forecast period (2025-2033) is projected to be xx%, indicating substantial growth potential. The increased adoption of Industry 4.0 principles and the burgeoning demand for automation in various industries are expected to further accelerate market expansion.

Dominant Markets & Segments in Control Valve Market
The Oil and Gas sector remains the dominant end-user industry for control valves, accounting for an estimated xx% of global market share in 2024. Growth is fueled by ongoing exploration and production activities, particularly in regions with significant reserves. The chemical and petrochemical industries are other key segments exhibiting strong demand for control valves due to their sophisticated process control requirements. The Asia-Pacific region is anticipated to show the highest growth rate, fueled by rapid industrialization and infrastructure development.
- Leading Region: Asia-Pacific (projected highest growth)
- Leading End-User Industry: Oil and Gas (xx% market share in 2024)
- Fastest-Growing Segment (Type): Smart valves and digitally enhanced systems
Key Growth Drivers (by region/segment):
- Asia-Pacific: Rapid industrialization, infrastructure investments, rising energy demand.
- Oil & Gas: Increased exploration & production, focus on efficiency & safety.
- Chemical/Petrochemical: Complex process control needs, stringent safety regulations.
Control Valve Market Product Analysis
Recent advancements in control valve technology focus on enhancing precision, durability, and energy efficiency. The integration of advanced sensors and communication protocols enables real-time monitoring and predictive maintenance, significantly reducing operational costs. New materials with improved corrosion resistance and higher temperature tolerance expand the applicability of control valves in harsh environments. The market increasingly favors intelligent and connected valves that optimize performance and reduce energy consumption. This trend is driven by the growing need for automated and autonomous industrial processes.
Key Drivers, Barriers & Challenges in Control Valve Market
Key Drivers:
- Technological advancements (smart valves, digitalization)
- Growing industrial automation across various sectors
- Increasing demand from emerging economies
- Stringent environmental regulations and safety standards
Key Challenges & Restraints:
- Supply chain disruptions (material shortages, logistical bottlenecks) impacting xx% of production in 2024.
- Intense competition among established players and new entrants
- High initial investment costs for advanced control valve systems
- Regulatory hurdles and compliance requirements impacting xx% of market growth.
Growth Drivers in the Control Valve Market Market
The market is propelled by strong demand from key end-user industries like oil and gas, chemicals, and power generation, driven by continuous expansion and modernization of these sectors. Technological advancements such as smart valves, wireless communication, and advanced materials are improving efficiency, reliability, and safety, thereby increasing adoption rates. Government initiatives to promote industrial automation and smart manufacturing further stimulate market growth.
Challenges Impacting Control Valve Market Growth
The market faces challenges including volatile raw material prices impacting production costs, global supply chain disruptions causing delays and impacting sales, and stringent environmental regulations increasing compliance costs for manufacturers. Intense competition from both established and emerging players puts pressure on margins and pricing.
Key Players Shaping the Control Valve Market Market
- Metso Corporation
- Flowserve Corporation
- Christian Burkert GmbH & Co KG
- GEA Group Aktiengesellschaft
- Emerson Electric Co
- CIRCOR International Inc
- Baker Hughes Company
- Neway Valve (Suzhou) Co Lt
- IMI PLC
Significant Control Valve Market Industry Milestones
- November 2023: Emerson announced its innovative Fisher Whisper Trim Technology, enhancing its noise reduction solutions.
- March 2024: Precision Pump & Valve partnered with Beaumont Manufacturing & Distribution, expanding its reach in the oil and gas market.
Future Outlook for Control Valve Market Market
The Control Valve market is poised for sustained growth, driven by continuous technological innovation, increasing automation across industries, and robust demand from key end-user sectors. Strategic opportunities exist for players focusing on developing sustainable, energy-efficient, and digitally enabled solutions. The market's future potential is significant, with continued expansion anticipated across diverse geographical regions and application areas.
Control Valve Market Segmentation
-
1. Type
- 1.1. Globe
- 1.2. Ball
- 1.3. Butterfly
- 1.4. Plug
- 1.5. Diaphragm
- 1.6. Other Types of Valves
-
2. End-user Industry
- 2.1. Oil and Gas
- 2.2. Chemical, Petrochemical, and Fertilizer
- 2.3. Energy and Power
- 2.4. Water and Wastewater Treatment
- 2.5. Metal and Mining
- 2.6. Other
Control Valve Market Segmentation By Geography
-
1. North America
- 1.1. United States
- 1.2. Canada
-
2. Europe
- 2.1. United Kingdom
- 2.2. Germany
- 2.3. France
- 2.4. Italy
-
3. Asia
- 3.1. China
- 3.2. Japan
- 3.3. India
- 3.4. South Korea
- 4. Australia and New Zealand
- 5. Latin America
- 6. Middle East and Africa

Control Valve Market REPORT HIGHLIGHTS
| Aspects | Details |
|---|---|
| Study Period | 2019-2033 |
| Base Year | 2024 |
| Estimated Year | 2025 |
| Forecast Period | 2025-2033 |
| Historical Period | 2019-2024 |
| Growth Rate | CAGR of 12.00% from 2019-2033 |
| Segmentation |
|
Table of Contents
- 1. Introduction
- 1.1. Research Scope
- 1.2. Market Segmentation
- 1.3. Research Methodology
- 1.4. Definitions and Assumptions
- 2. Executive Summary
- 2.1. Introduction
- 3. Market Dynamics
- 3.1. Introduction
- 3.2. Market Drivers
- 3.2.1. Growing emphasis on Power and Water and Wastewater in Emerging Markets; Focus of End Users on Environmental Issues and Refurbishment of Aging Infrastructure to Stay Competitive
- 3.3. Market Restrains
- 3.3.1. ; High Capital Investment and Increasing Use of Fiber Optic Transmission Cables; Regulatory Constraints and Limited Orbital Locations
- 3.4. Market Trends
- 3.4.1. The Oil and Gas Segment is Expected to Drive the Market
- 4. Market Factor Analysis
- 4.1. Porters Five Forces
- 4.2. Supply/Value Chain
- 4.3. PESTEL analysis
- 4.4. Market Entropy
- 4.5. Patent/Trademark Analysis
- 5. Global Control Valve Market Analysis, Insights and Forecast, 2019-2031
- 5.1. Market Analysis, Insights and Forecast - by Type
- 5.1.1. Globe
- 5.1.2. Ball
- 5.1.3. Butterfly
- 5.1.4. Plug
- 5.1.5. Diaphragm
- 5.1.6. Other Types of Valves
- 5.2. Market Analysis, Insights and Forecast - by End-user Industry
- 5.2.1. Oil and Gas
- 5.2.2. Chemical, Petrochemical, and Fertilizer
- 5.2.3. Energy and Power
- 5.2.4. Water and Wastewater Treatment
- 5.2.5. Metal and Mining
- 5.2.6. Other
- 5.3. Market Analysis, Insights and Forecast - by Region
- 5.3.1. North America
- 5.3.2. Europe
- 5.3.3. Asia
- 5.3.4. Australia and New Zealand
- 5.3.5. Latin America
- 5.3.6. Middle East and Africa
- 5.1. Market Analysis, Insights and Forecast - by Type
- 6. North America Control Valve Market Analysis, Insights and Forecast, 2019-2031
- 6.1. Market Analysis, Insights and Forecast - by Type
- 6.1.1. Globe
- 6.1.2. Ball
- 6.1.3. Butterfly
- 6.1.4. Plug
- 6.1.5. Diaphragm
- 6.1.6. Other Types of Valves
- 6.2. Market Analysis, Insights and Forecast - by End-user Industry
- 6.2.1. Oil and Gas
- 6.2.2. Chemical, Petrochemical, and Fertilizer
- 6.2.3. Energy and Power
- 6.2.4. Water and Wastewater Treatment
- 6.2.5. Metal and Mining
- 6.2.6. Other
- 6.1. Market Analysis, Insights and Forecast - by Type
- 7. Europe Control Valve Market Analysis, Insights and Forecast, 2019-2031
- 7.1. Market Analysis, Insights and Forecast - by Type
- 7.1.1. Globe
- 7.1.2. Ball
- 7.1.3. Butterfly
- 7.1.4. Plug
- 7.1.5. Diaphragm
- 7.1.6. Other Types of Valves
- 7.2. Market Analysis, Insights and Forecast - by End-user Industry
- 7.2.1. Oil and Gas
- 7.2.2. Chemical, Petrochemical, and Fertilizer
- 7.2.3. Energy and Power
- 7.2.4. Water and Wastewater Treatment
- 7.2.5. Metal and Mining
- 7.2.6. Other
- 7.1. Market Analysis, Insights and Forecast - by Type
- 8. Asia Control Valve Market Analysis, Insights and Forecast, 2019-2031
- 8.1. Market Analysis, Insights and Forecast - by Type
- 8.1.1. Globe
- 8.1.2. Ball
- 8.1.3. Butterfly
- 8.1.4. Plug
- 8.1.5. Diaphragm
- 8.1.6. Other Types of Valves
- 8.2. Market Analysis, Insights and Forecast - by End-user Industry
- 8.2.1. Oil and Gas
- 8.2.2. Chemical, Petrochemical, and Fertilizer
- 8.2.3. Energy and Power
- 8.2.4. Water and Wastewater Treatment
- 8.2.5. Metal and Mining
- 8.2.6. Other
- 8.1. Market Analysis, Insights and Forecast - by Type
- 9. Australia and New Zealand Control Valve Market Analysis, Insights and Forecast, 2019-2031
- 9.1. Market Analysis, Insights and Forecast - by Type
- 9.1.1. Globe
- 9.1.2. Ball
- 9.1.3. Butterfly
- 9.1.4. Plug
- 9.1.5. Diaphragm
- 9.1.6. Other Types of Valves
- 9.2. Market Analysis, Insights and Forecast - by End-user Industry
- 9.2.1. Oil and Gas
- 9.2.2. Chemical, Petrochemical, and Fertilizer
- 9.2.3. Energy and Power
- 9.2.4. Water and Wastewater Treatment
- 9.2.5. Metal and Mining
- 9.2.6. Other
- 9.1. Market Analysis, Insights and Forecast - by Type
- 10. Latin America Control Valve Market Analysis, Insights and Forecast, 2019-2031
- 10.1. Market Analysis, Insights and Forecast - by Type
- 10.1.1. Globe
- 10.1.2. Ball
- 10.1.3. Butterfly
- 10.1.4. Plug
- 10.1.5. Diaphragm
- 10.1.6. Other Types of Valves
- 10.2. Market Analysis, Insights and Forecast - by End-user Industry
- 10.2.1. Oil and Gas
- 10.2.2. Chemical, Petrochemical, and Fertilizer
- 10.2.3. Energy and Power
- 10.2.4. Water and Wastewater Treatment
- 10.2.5. Metal and Mining
- 10.2.6. Other
- 10.1. Market Analysis, Insights and Forecast - by Type
- 11. Middle East and Africa Control Valve Market Analysis, Insights and Forecast, 2019-2031
- 11.1. Market Analysis, Insights and Forecast - by Type
- 11.1.1. Globe
- 11.1.2. Ball
- 11.1.3. Butterfly
- 11.1.4. Plug
- 11.1.5. Diaphragm
- 11.1.6. Other Types of Valves
- 11.2. Market Analysis, Insights and Forecast - by End-user Industry
- 11.2.1. Oil and Gas
- 11.2.2. Chemical, Petrochemical, and Fertilizer
- 11.2.3. Energy and Power
- 11.2.4. Water and Wastewater Treatment
- 11.2.5. Metal and Mining
- 11.2.6. Other
- 11.1. Market Analysis, Insights and Forecast - by Type
- 12. North America Control Valve Market Analysis, Insights and Forecast, 2019-2031
- 12.1. Market Analysis, Insights and Forecast - By Country/Sub-region
- 12.1.1 United States
- 12.1.2 Canada
- 13. Europe Control Valve Market Analysis, Insights and Forecast, 2019-2031
- 13.1. Market Analysis, Insights and Forecast - By Country/Sub-region
- 13.1.1 United Kingdom
- 13.1.2 Germany
- 13.1.3 France
- 13.1.4 Italy
- 14. Asia Control Valve Market Analysis, Insights and Forecast, 2019-2031
- 14.1. Market Analysis, Insights and Forecast - By Country/Sub-region
- 14.1.1 China
- 14.1.2 Japan
- 14.1.3 India
- 14.1.4 South Korea
- 15. Australia and New Zealand Control Valve Market Analysis, Insights and Forecast, 2019-2031
- 15.1. Market Analysis, Insights and Forecast - By Country/Sub-region
- 15.1.1.
- 16. Latin America Control Valve Market Analysis, Insights and Forecast, 2019-2031
- 16.1. Market Analysis, Insights and Forecast - By Country/Sub-region
- 16.1.1.
- 17. Middle East and Africa Control Valve Market Analysis, Insights and Forecast, 2019-2031
- 17.1. Market Analysis, Insights and Forecast - By Country/Sub-region
- 17.1.1.
- 18. Competitive Analysis
- 18.1. Global Market Share Analysis 2024
- 18.2. Company Profiles
- 18.2.1 Metso Corporation
- 18.2.1.1. Overview
- 18.2.1.2. Products
- 18.2.1.3. SWOT Analysis
- 18.2.1.4. Recent Developments
- 18.2.1.5. Financials (Based on Availability)
- 18.2.2 Flowserve Corporation
- 18.2.2.1. Overview
- 18.2.2.2. Products
- 18.2.2.3. SWOT Analysis
- 18.2.2.4. Recent Developments
- 18.2.2.5. Financials (Based on Availability)
- 18.2.3 Christian Burkert GmbH & Co KG
- 18.2.3.1. Overview
- 18.2.3.2. Products
- 18.2.3.3. SWOT Analysis
- 18.2.3.4. Recent Developments
- 18.2.3.5. Financials (Based on Availability)
- 18.2.4 GEA Group Aktiengesellschaft
- 18.2.4.1. Overview
- 18.2.4.2. Products
- 18.2.4.3. SWOT Analysis
- 18.2.4.4. Recent Developments
- 18.2.4.5. Financials (Based on Availability)
- 18.2.5 Emerson Electric Co
- 18.2.5.1. Overview
- 18.2.5.2. Products
- 18.2.5.3. SWOT Analysis
- 18.2.5.4. Recent Developments
- 18.2.5.5. Financials (Based on Availability)
- 18.2.6 CIRCOR International Inc
- 18.2.6.1. Overview
- 18.2.6.2. Products
- 18.2.6.3. SWOT Analysis
- 18.2.6.4. Recent Developments
- 18.2.6.5. Financials (Based on Availability)
- 18.2.7 Baker Hughes Company
- 18.2.7.1. Overview
- 18.2.7.2. Products
- 18.2.7.3. SWOT Analysis
- 18.2.7.4. Recent Developments
- 18.2.7.5. Financials (Based on Availability)
- 18.2.8 Neway Valve (Suzhou) Co Lt
- 18.2.8.1. Overview
- 18.2.8.2. Products
- 18.2.8.3. SWOT Analysis
- 18.2.8.4. Recent Developments
- 18.2.8.5. Financials (Based on Availability)
- 18.2.9 IMI PLC
- 18.2.9.1. Overview
- 18.2.9.2. Products
- 18.2.9.3. SWOT Analysis
- 18.2.9.4. Recent Developments
- 18.2.9.5. Financials (Based on Availability)
- 18.2.1 Metso Corporation
List of Figures
- Figure 1: Global Control Valve Market Revenue Breakdown (Million, %) by Region 2024 & 2032
- Figure 2: North America Control Valve Market Revenue (Million), by Country 2024 & 2032
- Figure 3: North America Control Valve Market Revenue Share (%), by Country 2024 & 2032
- Figure 4: Europe Control Valve Market Revenue (Million), by Country 2024 & 2032
- Figure 5: Europe Control Valve Market Revenue Share (%), by Country 2024 & 2032
- Figure 6: Asia Control Valve Market Revenue (Million), by Country 2024 & 2032
- Figure 7: Asia Control Valve Market Revenue Share (%), by Country 2024 & 2032
- Figure 8: Australia and New Zealand Control Valve Market Revenue (Million), by Country 2024 & 2032
- Figure 9: Australia and New Zealand Control Valve Market Revenue Share (%), by Country 2024 & 2032
- Figure 10: Latin America Control Valve Market Revenue (Million), by Country 2024 & 2032
- Figure 11: Latin America Control Valve Market Revenue Share (%), by Country 2024 & 2032
- Figure 12: Middle East and Africa Control Valve Market Revenue (Million), by Country 2024 & 2032
- Figure 13: Middle East and Africa Control Valve Market Revenue Share (%), by Country 2024 & 2032
- Figure 14: North America Control Valve Market Revenue (Million), by Type 2024 & 2032
- Figure 15: North America Control Valve Market Revenue Share (%), by Type 2024 & 2032
- Figure 16: North America Control Valve Market Revenue (Million), by End-user Industry 2024 & 2032
- Figure 17: North America Control Valve Market Revenue Share (%), by End-user Industry 2024 & 2032
- Figure 18: North America Control Valve Market Revenue (Million), by Country 2024 & 2032
- Figure 19: North America Control Valve Market Revenue Share (%), by Country 2024 & 2032
- Figure 20: Europe Control Valve Market Revenue (Million), by Type 2024 & 2032
- Figure 21: Europe Control Valve Market Revenue Share (%), by Type 2024 & 2032
- Figure 22: Europe Control Valve Market Revenue (Million), by End-user Industry 2024 & 2032
- Figure 23: Europe Control Valve Market Revenue Share (%), by End-user Industry 2024 & 2032
- Figure 24: Europe Control Valve Market Revenue (Million), by Country 2024 & 2032
- Figure 25: Europe Control Valve Market Revenue Share (%), by Country 2024 & 2032
- Figure 26: Asia Control Valve Market Revenue (Million), by Type 2024 & 2032
- Figure 27: Asia Control Valve Market Revenue Share (%), by Type 2024 & 2032
- Figure 28: Asia Control Valve Market Revenue (Million), by End-user Industry 2024 & 2032
- Figure 29: Asia Control Valve Market Revenue Share (%), by End-user Industry 2024 & 2032
- Figure 30: Asia Control Valve Market Revenue (Million), by Country 2024 & 2032
- Figure 31: Asia Control Valve Market Revenue Share (%), by Country 2024 & 2032
- Figure 32: Australia and New Zealand Control Valve Market Revenue (Million), by Type 2024 & 2032
- Figure 33: Australia and New Zealand Control Valve Market Revenue Share (%), by Type 2024 & 2032
- Figure 34: Australia and New Zealand Control Valve Market Revenue (Million), by End-user Industry 2024 & 2032
- Figure 35: Australia and New Zealand Control Valve Market Revenue Share (%), by End-user Industry 2024 & 2032
- Figure 36: Australia and New Zealand Control Valve Market Revenue (Million), by Country 2024 & 2032
- Figure 37: Australia and New Zealand Control Valve Market Revenue Share (%), by Country 2024 & 2032
- Figure 38: Latin America Control Valve Market Revenue (Million), by Type 2024 & 2032
- Figure 39: Latin America Control Valve Market Revenue Share (%), by Type 2024 & 2032
- Figure 40: Latin America Control Valve Market Revenue (Million), by End-user Industry 2024 & 2032
- Figure 41: Latin America Control Valve Market Revenue Share (%), by End-user Industry 2024 & 2032
- Figure 42: Latin America Control Valve Market Revenue (Million), by Country 2024 & 2032
- Figure 43: Latin America Control Valve Market Revenue Share (%), by Country 2024 & 2032
- Figure 44: Middle East and Africa Control Valve Market Revenue (Million), by Type 2024 & 2032
- Figure 45: Middle East and Africa Control Valve Market Revenue Share (%), by Type 2024 & 2032
- Figure 46: Middle East and Africa Control Valve Market Revenue (Million), by End-user Industry 2024 & 2032
- Figure 47: Middle East and Africa Control Valve Market Revenue Share (%), by End-user Industry 2024 & 2032
- Figure 48: Middle East and Africa Control Valve Market Revenue (Million), by Country 2024 & 2032
- Figure 49: Middle East and Africa Control Valve Market Revenue Share (%), by Country 2024 & 2032
List of Tables
- Table 1: Global Control Valve Market Revenue Million Forecast, by Region 2019 & 2032
- Table 2: Global Control Valve Market Revenue Million Forecast, by Type 2019 & 2032
- Table 3: Global Control Valve Market Revenue Million Forecast, by End-user Industry 2019 & 2032
- Table 4: Global Control Valve Market Revenue Million Forecast, by Region 2019 & 2032
- Table 5: Global Control Valve Market Revenue Million Forecast, by Country 2019 & 2032
- Table 6: United States Control Valve Market Revenue (Million) Forecast, by Application 2019 & 2032
- Table 7: Canada Control Valve Market Revenue (Million) Forecast, by Application 2019 & 2032
- Table 8: Global Control Valve Market Revenue Million Forecast, by Country 2019 & 2032
- Table 9: United Kingdom Control Valve Market Revenue (Million) Forecast, by Application 2019 & 2032
- Table 10: Germany Control Valve Market Revenue (Million) Forecast, by Application 2019 & 2032
- Table 11: France Control Valve Market Revenue (Million) Forecast, by Application 2019 & 2032
- Table 12: Italy Control Valve Market Revenue (Million) Forecast, by Application 2019 & 2032
- Table 13: Global Control Valve Market Revenue Million Forecast, by Country 2019 & 2032
- Table 14: China Control Valve Market Revenue (Million) Forecast, by Application 2019 & 2032
- Table 15: Japan Control Valve Market Revenue (Million) Forecast, by Application 2019 & 2032
- Table 16: India Control Valve Market Revenue (Million) Forecast, by Application 2019 & 2032
- Table 17: South Korea Control Valve Market Revenue (Million) Forecast, by Application 2019 & 2032
- Table 18: Global Control Valve Market Revenue Million Forecast, by Country 2019 & 2032
- Table 19: Control Valve Market Revenue (Million) Forecast, by Application 2019 & 2032
- Table 20: Global Control Valve Market Revenue Million Forecast, by Country 2019 & 2032
- Table 21: Control Valve Market Revenue (Million) Forecast, by Application 2019 & 2032
- Table 22: Global Control Valve Market Revenue Million Forecast, by Country 2019 & 2032
- Table 23: Control Valve Market Revenue (Million) Forecast, by Application 2019 & 2032
- Table 24: Global Control Valve Market Revenue Million Forecast, by Type 2019 & 2032
- Table 25: Global Control Valve Market Revenue Million Forecast, by End-user Industry 2019 & 2032
- Table 26: Global Control Valve Market Revenue Million Forecast, by Country 2019 & 2032
- Table 27: United States Control Valve Market Revenue (Million) Forecast, by Application 2019 & 2032
- Table 28: Canada Control Valve Market Revenue (Million) Forecast, by Application 2019 & 2032
- Table 29: Global Control Valve Market Revenue Million Forecast, by Type 2019 & 2032
- Table 30: Global Control Valve Market Revenue Million Forecast, by End-user Industry 2019 & 2032
- Table 31: Global Control Valve Market Revenue Million Forecast, by Country 2019 & 2032
- Table 32: United Kingdom Control Valve Market Revenue (Million) Forecast, by Application 2019 & 2032
- Table 33: Germany Control Valve Market Revenue (Million) Forecast, by Application 2019 & 2032
- Table 34: France Control Valve Market Revenue (Million) Forecast, by Application 2019 & 2032
- Table 35: Italy Control Valve Market Revenue (Million) Forecast, by Application 2019 & 2032
- Table 36: Global Control Valve Market Revenue Million Forecast, by Type 2019 & 2032
- Table 37: Global Control Valve Market Revenue Million Forecast, by End-user Industry 2019 & 2032
- Table 38: Global Control Valve Market Revenue Million Forecast, by Country 2019 & 2032
- Table 39: China Control Valve Market Revenue (Million) Forecast, by Application 2019 & 2032
- Table 40: Japan Control Valve Market Revenue (Million) Forecast, by Application 2019 & 2032
- Table 41: India Control Valve Market Revenue (Million) Forecast, by Application 2019 & 2032
- Table 42: South Korea Control Valve Market Revenue (Million) Forecast, by Application 2019 & 2032
- Table 43: Global Control Valve Market Revenue Million Forecast, by Type 2019 & 2032
- Table 44: Global Control Valve Market Revenue Million Forecast, by End-user Industry 2019 & 2032
- Table 45: Global Control Valve Market Revenue Million Forecast, by Country 2019 & 2032
- Table 46: Global Control Valve Market Revenue Million Forecast, by Type 2019 & 2032
- Table 47: Global Control Valve Market Revenue Million Forecast, by End-user Industry 2019 & 2032
- Table 48: Global Control Valve Market Revenue Million Forecast, by Country 2019 & 2032
- Table 49: Global Control Valve Market Revenue Million Forecast, by Type 2019 & 2032
- Table 50: Global Control Valve Market Revenue Million Forecast, by End-user Industry 2019 & 2032
- Table 51: Global Control Valve Market Revenue Million Forecast, by Country 2019 & 2032
Frequently Asked Questions
1. What is the projected Compound Annual Growth Rate (CAGR) of the Control Valve Market?
The projected CAGR is approximately 12.00%.
2. Which companies are prominent players in the Control Valve Market?
Key companies in the market include Metso Corporation, Flowserve Corporation, Christian Burkert GmbH & Co KG, GEA Group Aktiengesellschaft, Emerson Electric Co, CIRCOR International Inc, Baker Hughes Company, Neway Valve (Suzhou) Co Lt, IMI PLC.
3. What are the main segments of the Control Valve Market?
The market segments include Type, End-user Industry.
4. Can you provide details about the market size?
The market size is estimated to be USD 7.43 Million as of 2022.
5. What are some drivers contributing to market growth?
Growing emphasis on Power and Water and Wastewater in Emerging Markets; Focus of End Users on Environmental Issues and Refurbishment of Aging Infrastructure to Stay Competitive.
6. What are the notable trends driving market growth?
The Oil and Gas Segment is Expected to Drive the Market.
7. Are there any restraints impacting market growth?
; High Capital Investment and Increasing Use of Fiber Optic Transmission Cables; Regulatory Constraints and Limited Orbital Locations.
8. Can you provide examples of recent developments in the market?
March 2024: Precision Pump & Valve ("PPV") announced a partnership with Beaumont Manufacturing & Distribution ("BMD"). The new partnership will allow PPV to further serve customers in the oil and gas surface production market, including midstream and upstream users, fabrication shops, and others. The partnership will allow PPV to provide all BMD products to oil producers across the United States.
9. What pricing options are available for accessing the report?
Pricing options include single-user, multi-user, and enterprise licenses priced at USD 4750, USD 5250, and USD 8750 respectively.
10. Is the market size provided in terms of value or volume?
The market size is provided in terms of value, measured in Million.
11. Are there any specific market keywords associated with the report?
Yes, the market keyword associated with the report is "Control Valve Market," which aids in identifying and referencing the specific market segment covered.
12. How do I determine which pricing option suits my needs best?
The pricing options vary based on user requirements and access needs. Individual users may opt for single-user licenses, while businesses requiring broader access may choose multi-user or enterprise licenses for cost-effective access to the report.
13. Are there any additional resources or data provided in the Control Valve Market report?
While the report offers comprehensive insights, it's advisable to review the specific contents or supplementary materials provided to ascertain if additional resources or data are available.
14. How can I stay updated on further developments or reports in the Control Valve Market?
To stay informed about further developments, trends, and reports in the Control Valve Market, consider subscribing to industry newsletters, following relevant companies and organizations, or regularly checking reputable industry news sources and publications.
Methodology
Step 1 - Identification of Relevant Samples Size from Population Database


Step 2 - Approaches for Defining Global Market Size (Value, Volume* & Price*)

Note*: In applicable scenarios
Step 3 - Data Sources
Primary Research
- Web Analytics
- Survey Reports
- Research Institute
- Latest Research Reports
- Opinion Leaders
Secondary Research
- Annual Reports
- White Paper
- Latest Press Release
- Industry Association
- Paid Database
- Investor Presentations

Step 4 - Data Triangulation
Involves using different sources of information in order to increase the validity of a study
These sources are likely to be stakeholders in a program - participants, other researchers, program staff, other community members, and so on.
Then we put all data in single framework & apply various statistical tools to find out the dynamic on the market.
During the analysis stage, feedback from the stakeholder groups would be compared to determine areas of agreement as well as areas of divergence
